
A pure-terminal TensorBoard viewer — live scalar curves, text summaries, histogram heatmaps/distributions, PR curves, and an HParams table in your terminal (local or SSH), no browser, no X11, no port forwarding.

Project description
terminalboard




A pure-terminal TensorBoard viewer — with an AI assistant built in.
Watch your live training curves right inside any terminal — locally or SSH'd into a remote box — and chat with your runs in plain English. Scalars, text, histograms (heatmap or distribution bands), PR curves and an HParams table, drawn as crisp Unicode/braille. No browser, no X11, no port forwarding.
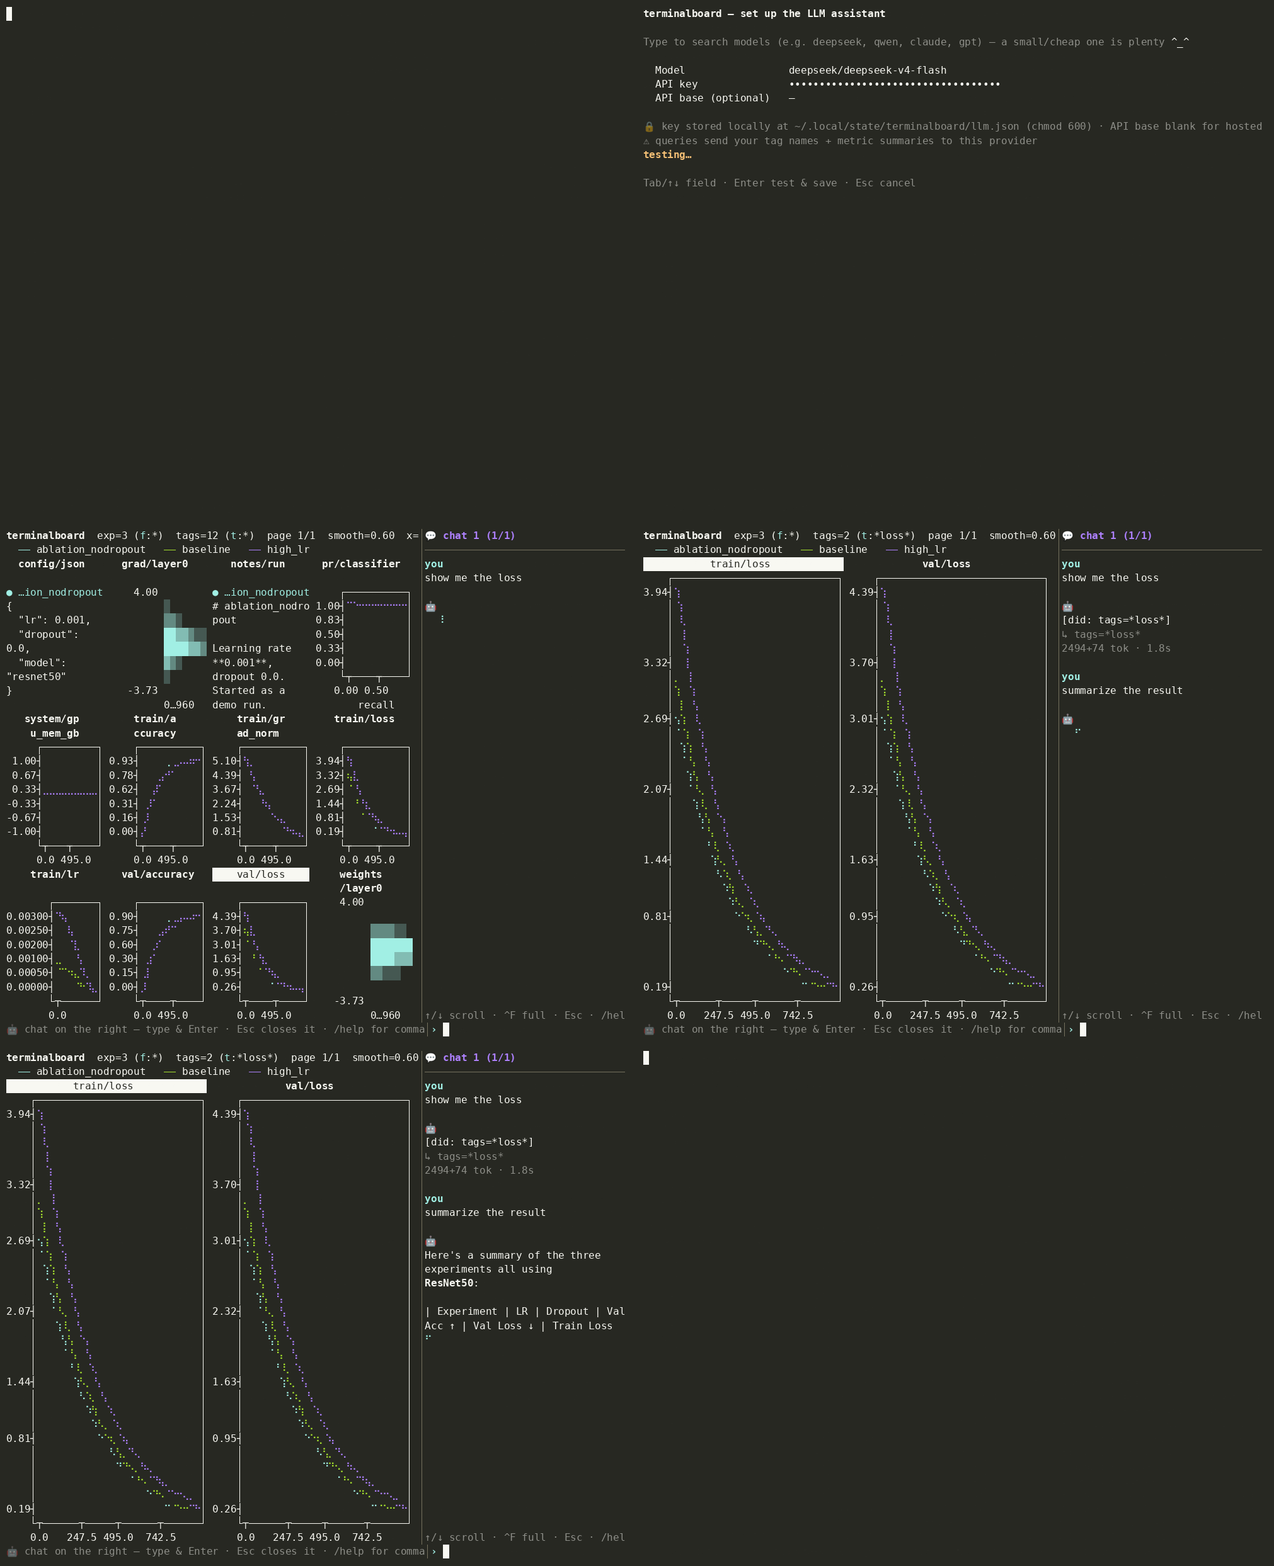
The usual remote-TensorBoard dance is ssh -L 6006:… + a browser, or giving up
and grep-ing the logs. terminalboard reads the event files directly and draws
them in the terminal — a plain SSH session is all you need (and it's just as
nice locally).
Contents — Install · Highlights · Usage · Plot types & controls · AI assistant · Configuration · Design · Roadmap
Install
pip install terminalboard            # one small dependency (plotext); Python 3.9+
terminalboard path/to/tb_logs        # live dashboard in any terminal

# remote training box? just SSH in first — no port forwarding needed:
#   ssh remote
#   terminalboard path/to/tb_logs
Or run it without installing: uvx terminalboard <logdir> (or pipx run terminalboard <logdir>).
Optional extras:
| Extra | Install | Adds |
|---|---|---|
[tb] |
pip install 'terminalboard[tb]' |
the --tb parser (official tensorboard EventAccumulator) |
[llm] |
pip install 'terminalboard[llm]' |
the AI assistant (any provider via LiteLLM) |
Try it without your own logs · install from source
git clone https://github.com/dongfangyixi/terminalboard.git
cd terminalboard
pip install -e '.[tb,llm,dev]'        # editable, with all extras + test tools
python examples/gen_demo_logs.py      # writes ./demo_logs/ (3 runs, every type)
terminalboard demo_logs
Highlights
- 📈 Every TensorBoard type, as terminal text — scalar curves, text summaries, histograms (heatmap or distribution bands), PR curves, and a runs × hyperparameters HParams table.
- 🔍 Built for comparison — multi-experiment overlay with stable colors, smoothing, log-Y, step↔time, zoom, a powerful tag/experiment filter grammar, and a drill-down detail view with a value cursor.
- 🤖 AI assistant (
a) — a multi-session chat (sidebar or full-screen) that sees your live view + all log data, answers questions and operates the dashboard for you, with any LLM provider. Opt-in, audited, privacy-conscious. - 🪶 Light by default — the default install is one small dependency
(
plotext) and a self-contained pure-Python event parser;tensorboardandlitellmare optional extras. - ✨ Smooth TUI — flicker-free repaints (alternate screen + synchronized output), live tailing, per-logdir saved view state, a config file, CSV export.
Usage
terminalboard LOGDIR [options]

  LOGDIR / --logdir   directory of TensorBoard event files (scanned recursively)
  --tb                parse with the tensorboard library (needs [tb]); the
                      built-in pure-Python parser is the default
  --tags GLOB         filter tags, e.g. 'train/*loss*,val/*' (live-editable: t)
  --experiments GLOB  filter experiments/runs (live-editable: f)
  --smooth ALPHA      EMA smoothing weight in [0,1) (default: 0.6; 0 disables)
  --grid RxC          panels per page (default: 2x3)
  --interval SECONDS  live refresh interval (default: 2.0)
  --once              render a single frame and exit
  --list              list all tags and exit
terminalboard logs                       # live dashboard
terminalboard logs --tags 'train/*loss*' # filter to loss curves
terminalboard logs --grid 2x2            # 4 panels per page
terminalboard logs --once                # one frame and exit (good for CI/cron)
Plot types
A page can mix any of these — each panel adapts to its tag's kind:
- Scalars — line/braille curves (multiple experiments overlaid).
- Text summaries — the latest text shown in a panel.
- Histograms — a heatmap over steps, or distribution bands
(percentiles over steps) with
b. - PR curves — precision-vs-recall curves (
pr_curvesplugin). - HParams — a full-screen runs × hyperparameters × metrics table (
P).
Controls (live mode)
| Key | Action |
|---|---|
| arrows | move the focused panel (wraps across pages) |
Enter |
inspect the focused panel full-screen |
n / space, p |
next / previous page of tags |
t / f |
edit the tag / experiment filter live |
c |
type selector — cycle all / scalars / histograms / text / pr-curves |
o |
cycle which overlapping curve is on top (z-order) |
z / Z |
zoom out / in — panels per page: 1·2·4·6·9·12·16·24·36 |
b |
histograms ↔ distribution bands |
+ / - / 0 |
more / less / no smoothing |
x / l |
x-axis step↔time / toggle log-Y (scalars) |
w |
export the focused scalar tag to a CSV |
P |
HParams table · a chat assistant · r refresh · H help |
q / Esc |
quit |
Detail view, filter syntax & line-editing keys
Detail view (after Enter): a single tag full-screen; Esc returns to
the grid. By type:
- scalars overlay all experiments with a cursor —
←/→move it one point (Shift+←/→fast), and a per-experiment value / smoothed / step / wall-time readout updates beneath the plot.x/lchange axis/scale. - histograms show one experiment as a heatmap (
←/→switches;btoggles distribution bands). - pr-curves overlay all experiments;
←/→steps through training. - text is scrollable (
↑/↓,PgUp/PgDn,Home/End),←/→switch experiment, anddshows a config diff — only the keys that differ.
Filter syntax (tags and experiments):
| Pattern | Meaning |
|---|---|
word |
case-insensitive substring (loss → train/loss) |
a b |
AND — both must match |
a | b , a , b |
OR — either matches |
* ? [ ] |
glob wildcards (train/*loss*) |
!word |
NOT — exclude |
/regex/ |
regular expression (case-insensitive, unanchored) |
It's a small glob + boolean DSL, not full regex: a bare word is a substring
(. is literal). For real regex use /.../; if it needs | or spaces, make the
whole filter the regex, e.g. /^train\/(loss|lr)$/. Filters re-apply as you
type; a no-match keeps the current plots and shows a red warning.
In any input prompt: ←/→ move · ↑/↓ history · Home/End (or ^A/^E) ·
^W delete word · ^K kill-to-end · ^U clear · Alt/Ctrl+←/→ word motion ·
Enter apply · Esc cancel.
Multiple experiments: curves are overlaid per panel, each run in its own
stable color (it keeps that color no matter what you filter), with a legend
of full run names. Use f / --experiments to focus a subset.
AI assistant
Optional —
pip install 'terminalboard[llm]'.
Press a to open a chat with your runs. The model both drives the
dashboard (filter, pick a type, smooth, zoom, open a tag, open HParams…) and
analyzes your results — in one turn. For example:
- "show only validation losses, smoothed" → applies the filter + smoothing
- "which run is overfitting?" → a short train-vs-val comparison
- "open the pr curve and tell me if it's good" → opens it and gives a verdict
It's a multi-session chat — sidebar (the dashboard re-tiles beside it) or
full-screen (^F). It sees your live view (focused/visible tags, counts,
mode) plus all log data, streams the answer with light markdown, and keeps
sessions per-logdir (/new, /next, /rename, …; Esc closes). Actions are a
fixed, typed whitelist — it can't run shell or touch files.
Powered by LiteLLM, so any provider
works. On first use a setup form lets you search a model (type deepseek,
qwen, claude, gpt… → ↑/↓ + Enter, or type any custom/self-hosted string)
and enter the matching API key. A small/cheap model is plenty here:
| Model string | Key | API base |
|---|---|---|
gpt-5.4-nano / gpt-5.4-mini |
OpenAI | (blank) |
anthropic/claude-haiku-4-5 |
Anthropic | (blank) |
gemini/gemini-3.5-flash |
(blank) | |
deepseek/deepseek-v4-flash |
DeepSeek | (blank) |
openrouter/qwen/qwen3.6-35b-a3b |
OpenRouter | (blank) |
hosted_vllm/Qwen/Qwen3.6-27B |
(your server) | http://host:8000/v1 |
ollama/llama3 |
(none, local) | (blank) |
(API base stays blank for hosted providers; set it only for your own OpenAI-compatible server — vLLM, Ollama, Azure…)
⚠️ Privacy: queries send your tag names + metric summaries to the chosen provider, and tag names can leak architecture details. If that matters, use a local model (
ollama/...) so nothing leaves your machine. The feature is off until you configure it, and your API key is stored locally (~/.local/state/terminalboard/llm.json,chmod 600).
Security audit (we reviewed the pinned LiteLLM from source)
For the pinned LiteLLM (1.88.1), reviewed from source: your API key is sent
only to the provider endpoint you configured (auth header); there is no
telemetry (the flag exists but nothing reads it; logging callbacks default to
empty); and the single non-provider call — fetching a public pricing JSON from
GitHub at import — is disabled by terminalboard
(LITELLM_LOCAL_MODEL_COST_MAP=true; only the $-estimate may lag price
changes). The extra is version-pinned, so what you install is what was
audited; we re-audit before bumping it.
Configuration
Set defaults in ~/.config/terminalboard.toml (or $TERMINALBOARD_CONFIG); CLI
flags override them. Needs Python 3.11+ (tomllib) or tomli.
[terminalboard]
smooth = 0.6
grid = "2x3"
xaxis = "step"     # or "time"
logy = false
tags = "train/*"
# experiments = "baseline | scaling"
# csv_dir = "~/tb-exports"   # pre-filled folder in the CSV (w) save prompt
# restore = true             # save/restore per-logdir view state (default: on)
Your filters, zoom, smoothing, axis, order and focus are saved per-logdir on
quit and restored next time (under $XDG_STATE_HOME, default ~/.local/state).
Explicit CLI flags win; --reset-view starts fresh; restore = false disables it.
Design
- Read the event files (
events.out.tfevents.*), scanned recursively for multiple runs, into a typed series model. - Render the selected tags as Unicode/braille text — curves, text panels, histogram heatmaps/bands, PR curves — tiled into a grid that fits the terminal.
- Watch the logdir and re-render when new data lands. Repaints are flicker-free (alternate screen buffer + synchronized output, DEC 2026) and an idle dashboard isn't repainted at all.
- Ask (optional): the assistant gets a compact summary of your current view
- log data, replies in the chat, and turns natural language into the same typed actions the keys drive.
Two parsing backends: the default is a self-contained pure-Python
TFRecord + protobuf-wire parser (tiny install, fast startup, ideal for a thin
remote box). --tb uses the official tensorboard EventAccumulator instead
(needs [tb]; falls back to the built-in parser with a note if absent).
Why Python (and not a web app)?
TensorBoard logs are a TF-specific TFRecord/protobuf format with first-class
Python tooling, and Python has mature terminal-plotting libraries
(plotext) — so the whole thing is pure text with no browser or image protocol
needed. A Next.js/TypeScript build would mean hand-reimplementing the TFRecord +
protobuf decoding and have no native terminal-plotting story; its core value
(React/SSR/browser) goes unused for a terminal CLI.
Roadmap
Done: pure-Python + --tb parsers · scalars, text, histograms
(heatmap/distribution), PR curves, HParams table · multi-experiment overlay,
zoom, drill-down cursor, filter grammar · log-Y, step↔time, config diff, CSV
export, config file + saved view state · AI chat assistant (any provider,
searchable model picker) · published to
PyPI.
Next: assistant pull-tools agent loop (reads data on demand) · redaction mode
for sensitive tag names · a non-interactive --analyze report.
Contributing
python3 -m venv .venv
.venv/bin/pip install -e '.[tb,llm,dev]'
.venv/bin/pytest -q
.venv/bin/terminalboard demo_logs --once
Issues and PRs welcome. Releases are documented in
RELEASING.md; the version is single-sourced from
terminalboard/__init__.py.
If terminalboard saves you a port-forward, please ⭐ the repo — it helps.
License
MIT.
Release history Release notifications | RSS feed


Download files
Download the file for your platform. If you're not sure which to choose, learn more about installing packages.
Source Distribution
Built Distribution
Filter files by name, interpreter, ABI, and platform.
If you're not sure about the file name format, learn more about wheel file names.
Copy a direct link to the current filters
File details
Details for the file terminalboard-0.5.1.tar.gz.
File metadata
- Download URL: terminalboard-0.5.1.tar.gz
- Upload date:
- Size: 71.5 kB
- Tags: Source
- Uploaded using Trusted Publishing? No
- Uploaded via: twine/6.2.0 CPython/3.12.3
File hashes
| Algorithm | Hash digest | |
|---|---|---|
| SHA256 |
f7c8a0665800cf6632ad42c05f437cb780dc85e7c29c9766ae5d9b37221c0b2c
|
|
| MD5 |
ac38e6a7512330323bbf99ee62bd853f
|
|
| BLAKE2b-256 |
fc5adb4cd8af0a4ebabfc9374f89b2340a292c6de46471a7988d93d6aa6b2e0b
|
File details
Details for the file terminalboard-0.5.1-py3-none-any.whl.
File metadata
- Download URL: terminalboard-0.5.1-py3-none-any.whl
- Upload date:
- Size: 60.9 kB
- Tags: Python 3
- Uploaded using Trusted Publishing? No
- Uploaded via: twine/6.2.0 CPython/3.12.3
File hashes
| Algorithm | Hash digest | |
|---|---|---|
| SHA256 |
94795723dab612f3c5f0b2a262956689d10dafac1ac48a81da366c980624701d
|
|
| MD5 |
2a53f64d8ea4600336551b336ebdccbb
|
|
| BLAKE2b-256 |
4d6800dcaa844626a06873e15b5716e8ac71721b07cd2d80257a2bfff12ca39e
|






