
terminaltelemetry2
An SSH terminal with live telemetry beside it, one device per window. Log in the way you normally would, and the panels next to the terminal keep polling the device: interfaces, BGP, OSPF, LLDP, CPU and memory, top processes, IP addresses, and on Linux hosts, containers, filesystems and failed systemd units. The panels are plain YAML, so you can change them or write your own.
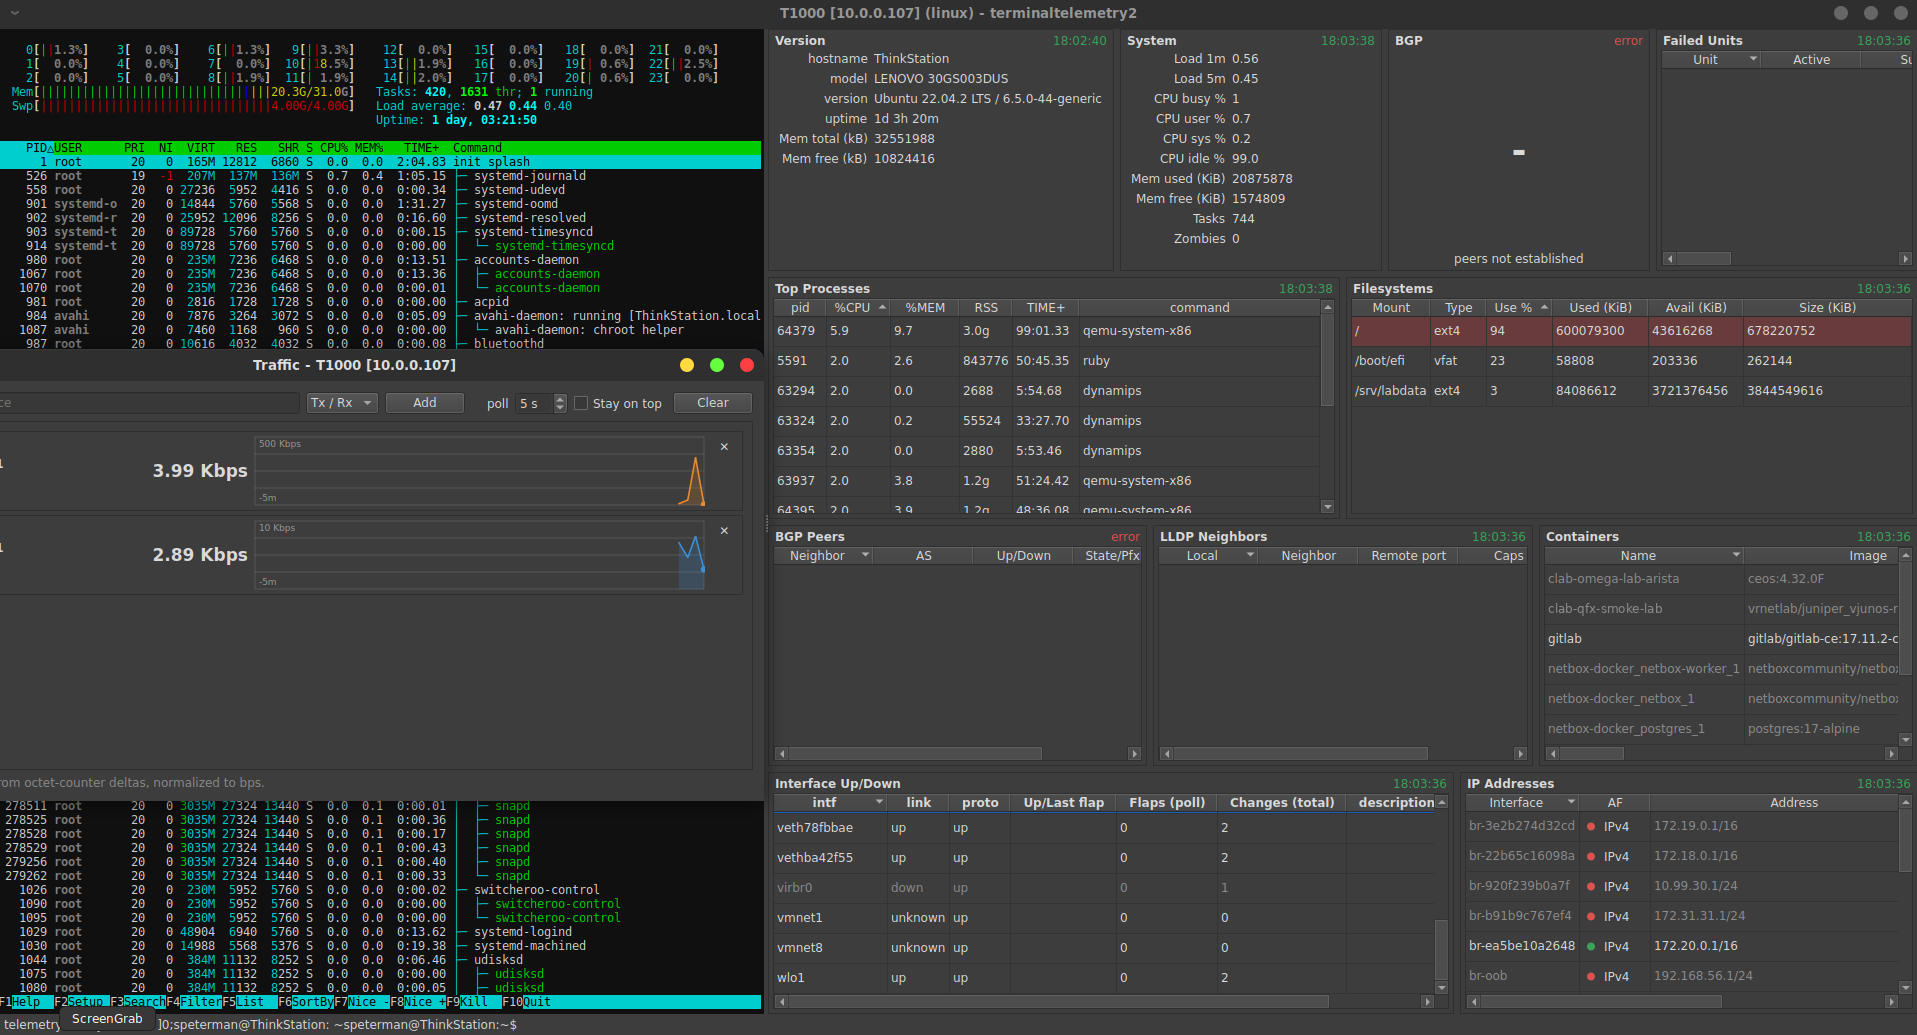
Arista EOS, Cisco IOS, Cisco NX-OS, Juniper Junos and Linux ship with full widget coverage. There are platform packs for about 40 other vendors, most of which provide only the terminal session so far. You can bind widgets to those yourself; see Adding a platform.
Install
pip install terminaltelemetry2 # once published
From source:
git clone https://github.com/scottpeterman/terminaltelemetry2
cd terminaltelemetry2
python -m venv .venv && . .venv/bin/activate
pip install -e .
For the full interactive terminal (cursor addressing, htop, vi), add
anytermqt. It isn't on PyPI yet:
pip install -e ".[terminal]" \
  --find-links https://github.com/scottpeterman/anytermqt/releases/expanded_assets/v0.1.0
Without it you get a basic terminal. The telemetry panels work either way.
Quick start
tt2
This opens the Connect form. Fill in host, platform, user, and a password or key; a jump host is optional. The form remembers your last connection, and the Host box lists recent hosts. Passwords and passphrases are never saved.
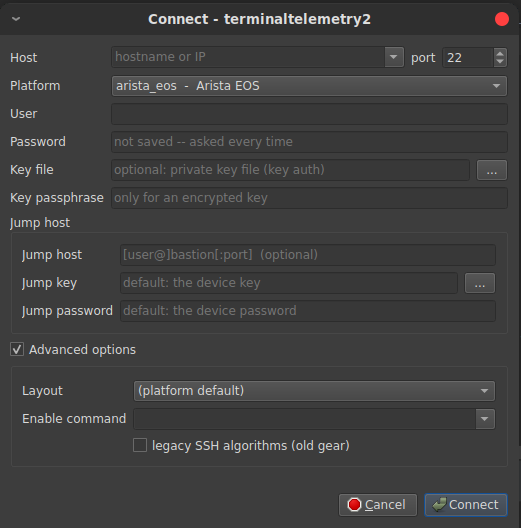
Or connect directly:
tt2 --host 10.0.0.1 --user admin --platform eos
tt2 --host 10.0.0.1 --user admin --platform junos -i ~/.ssh/id_ed25519
tt2 --host 10.0.0.1 --user admin --platform eos -J admin@bastion1:22
Platform short names are eos, ios, nxos, junos and linux. The password
comes from --password, then $TERMINALTELEMETRY2_PASSWORD, then a prompt.
From a session file
tt2 --sessions ~/sessions.yaml
This opens a searchable device picker over the same folder/sessions YAML used
by the other terminal apps. Type to filter, press Down to reach the list, and
press Enter to connect. Per-device jump_host, jump_port and jump_username
entries override the default jump host.
Other useful flags
| Flag | Use |
|---|---|
--enable-command 'enable' |
IOS devices that log you in at user mode |
--legacy-ssh |
Old gear that needs legacy ciphers/KEX |
--layout NAME |
Pick a different panel layout |
--emulate [ip_lookup.json] |
Run against NetEmulate mock devices (demos, offline) |
--debug |
Verbose logging |
Using it
| Key | Action |
|---|---|
F5 |
Refresh every panel now |
Ctrl+N |
Open another device in a new window |
Ctrl/Cmd + / - / 0 |
Terminal font size (remembered) |
Ctrl+T |
Template Manager |
Ctrl+Shift+W |
Widget Designer |
Ctrl+Shift+P |
Platform Pack editor |
Traffic monitor. Right-click an interface row in Interface Up/Down, Ports, LLDP, or a counters table, then choose Monitor <intf>. The interface opens in a Traffic window with a live bps rate and a 5-minute chart. Rates come from octet counters, so they're comparable across vendors and update every poll (5 s by default, adjustable from 2 to 60 s).
When a panel shows an error. Every panel has a { } button, which turns
red when the last parse failed. Click it to open the template lab, loaded with
the exact output the device returned and the template that failed on it. Edit
the template until Test parses, then choose Save to database. The fix is
saved as a new sibling template, so the original keeps working on the gear it
already handled. docs/WIDGETS.md walks through this.
Customizing
Your own widgets, layouts, templates and platform packs go in
~/.terminaltelemetry2/. You can change that location with
$TERMINALTELEMETRY2_HOME. A file there with the same name as a bundled one
replaces the bundled version. The installed package is never modified.
widgets/*.yaml         your widgets
layouts/*.yaml         your layouts
platforms/*.yaml       your platform packs
templates/*.textfsm    template overrides
tfsm_templates.db      your copy of the template DB (created on first run)
Build a widget. Run tt2 --designer, pick a template and a sample output,
and it proposes the whole widget: fields, view, columns and alerts, with a live
preview. Save it and it's available in every window.


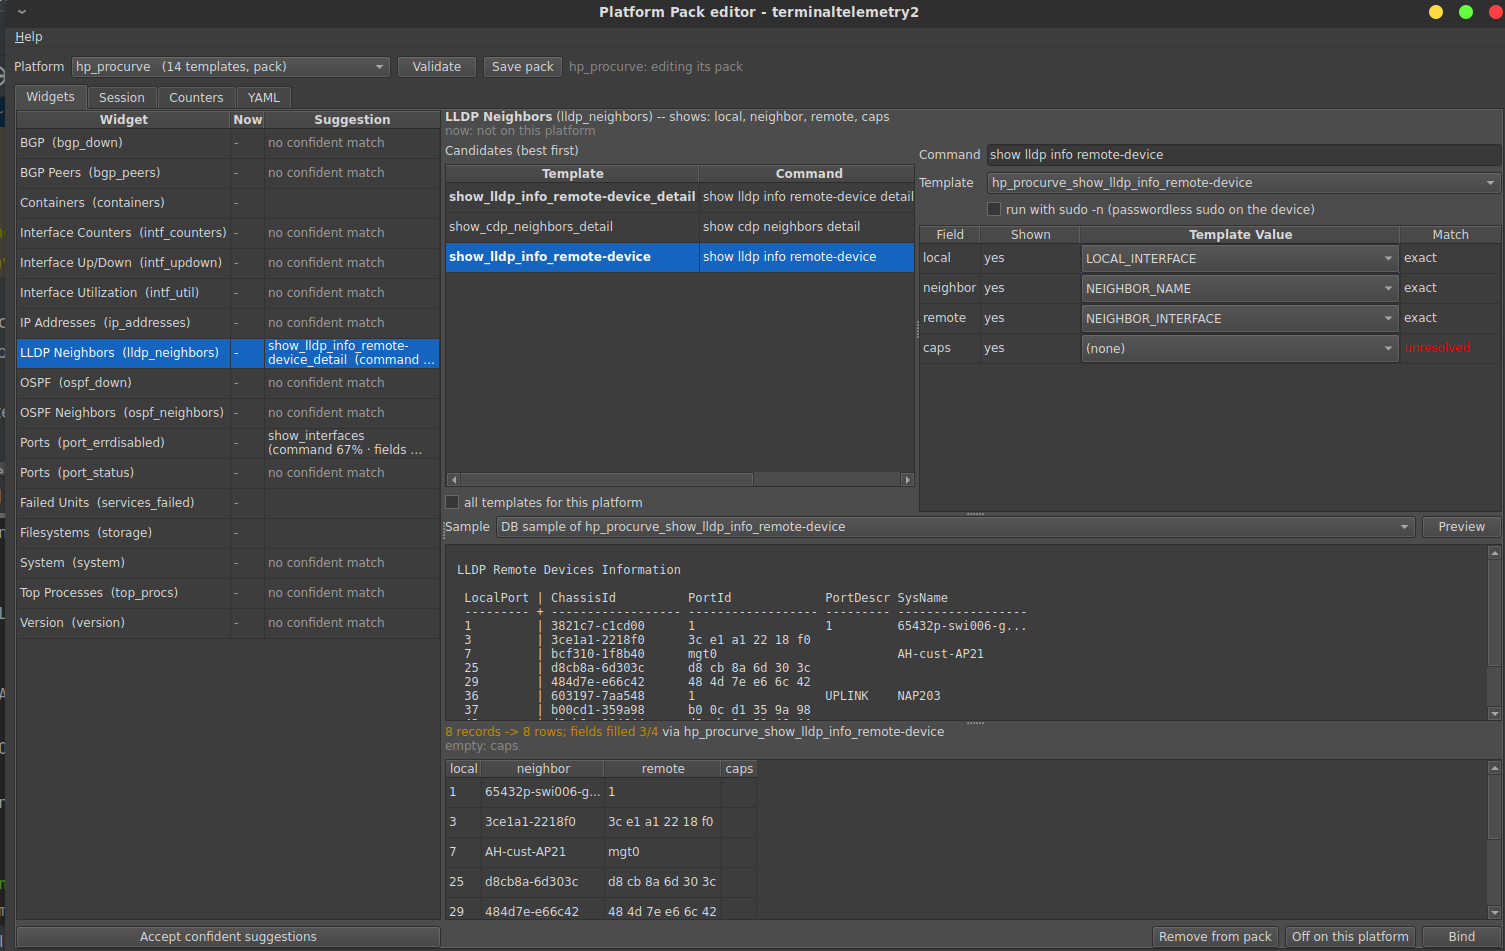
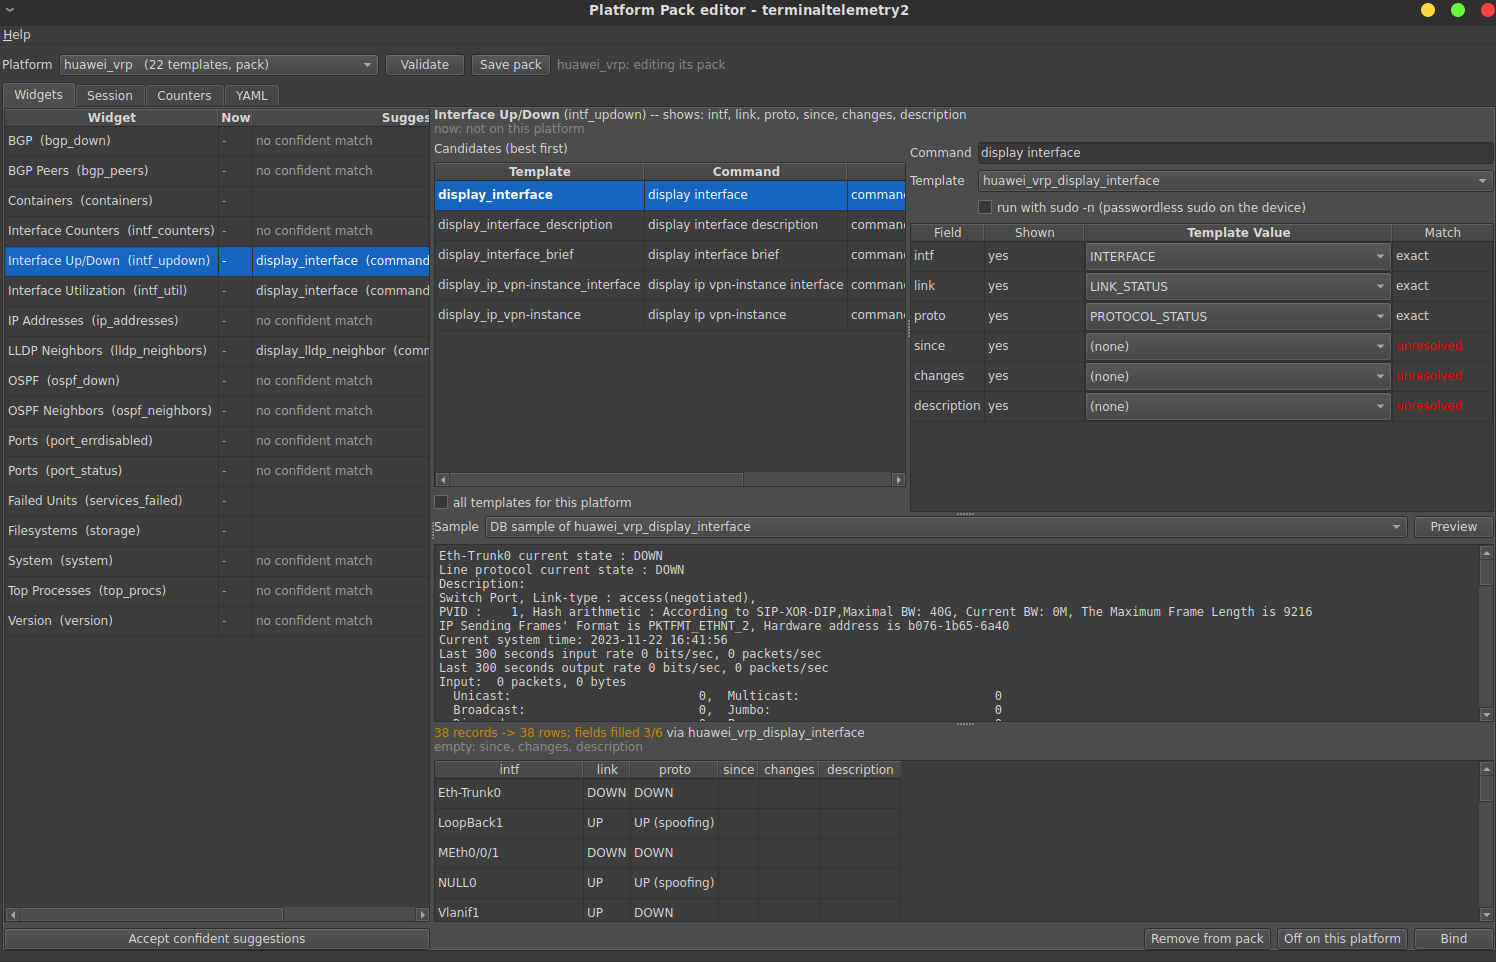
Adding a platform. Run tt2 --packs PLATFORM. For each widget, the Pack
editor suggests templates from the DB and previews the result.
Accept confident suggestions binds everything it's sure of. New windows pick
up the pack immediately.
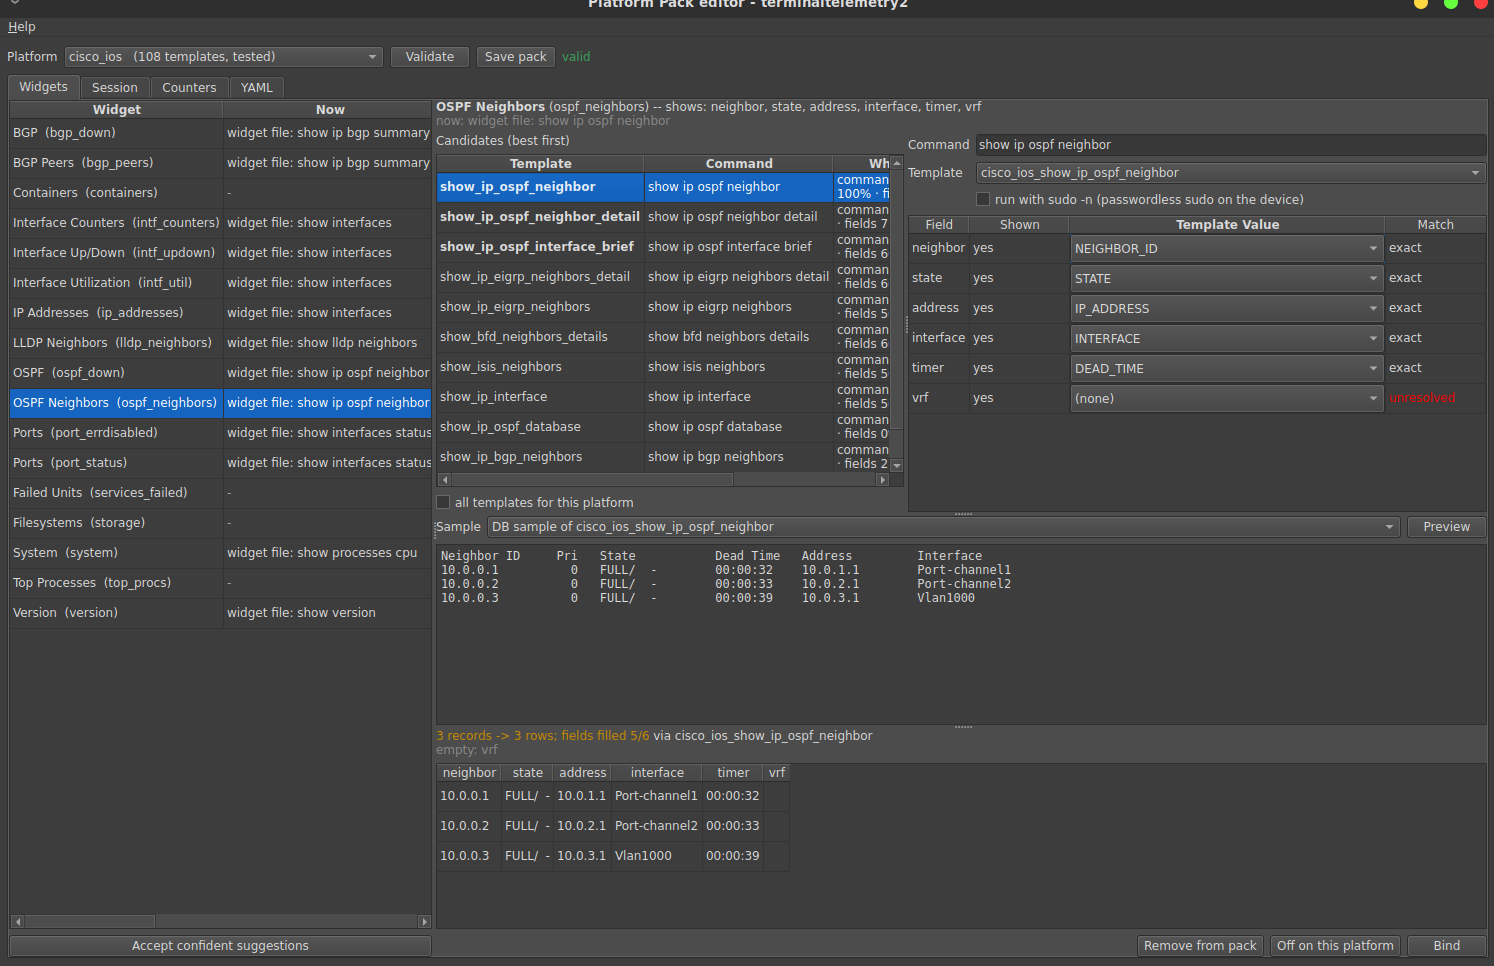
More pack editor screens
Running widgets with sudo (Linux). The Docker and FRR/vtysh widgets usually need root. Add a small user pack:
# ~/.terminaltelemetry2/platforms/linux-sudo.yaml
platform: linux
merge: true
bindings:
  containers: {sudo: true}
  bgp_peers:  {sudo: true}
  bgp_down:   {sudo: true}
Then add a NOPASSWD rule on the host, for example
netops ALL=(root) NOPASSWD: /usr/bin/docker, /usr/bin/vtysh. Without the rule
the widget fails immediately with a clear message; it never hangs on a prompt.
tt2 --check-platforms validates every pack and reports coverage.
More
- docs/WIDGETS.md: writing widgets and templates
- docs/ARCHITECTURE.md: how parsing, template resolution, packs and the SSH layer work
License
GPL-3.0-or-later. Third-party components are listed in THIRD_PARTY_NOTICES.md.
1 maintainer

Metadata
1 maintainer
Release files for terminaltelemetry2 0.1.2
For a detailed explanation of source distributions (sdists) and built distributions (wheels), please see the package formats documentation.
Built distribution (wheel)
| File | Interpreter | ABI | Platform | Reset |
|---|---|---|---|---|
| terminaltelemetry2-0.1.2-py3-none-any.whl | Python 3 | none | any | Details |
Release files / terminaltelemetry2-0.1.2-py3-none-any.whl
| Download URL | terminaltelemetry2-0.1.2-py3-none-any.whl |
|---|---|
| Size | 930.5 kB |
| Tags | Python 3 |
|
SHA-256 checksum How to use checksums |
fa87e768b6c4f7d9fd3517f1a67f575b6d7d80ea1dfbb324d147bf96e8efe3fb
|
|
BLAKE2b-256 checksum How to use checksums |
1fb937ce3d72cc870822067c26bf50e6710d59762656d673c7f2e3f05cb990b2
|
| Upload date | |
|
Uploaded using Trusted Publishing? What is trusted publishing? |
No |
| Uploaded via |
twine/7.0.0 CPython/3.10.12
|














