
termseries






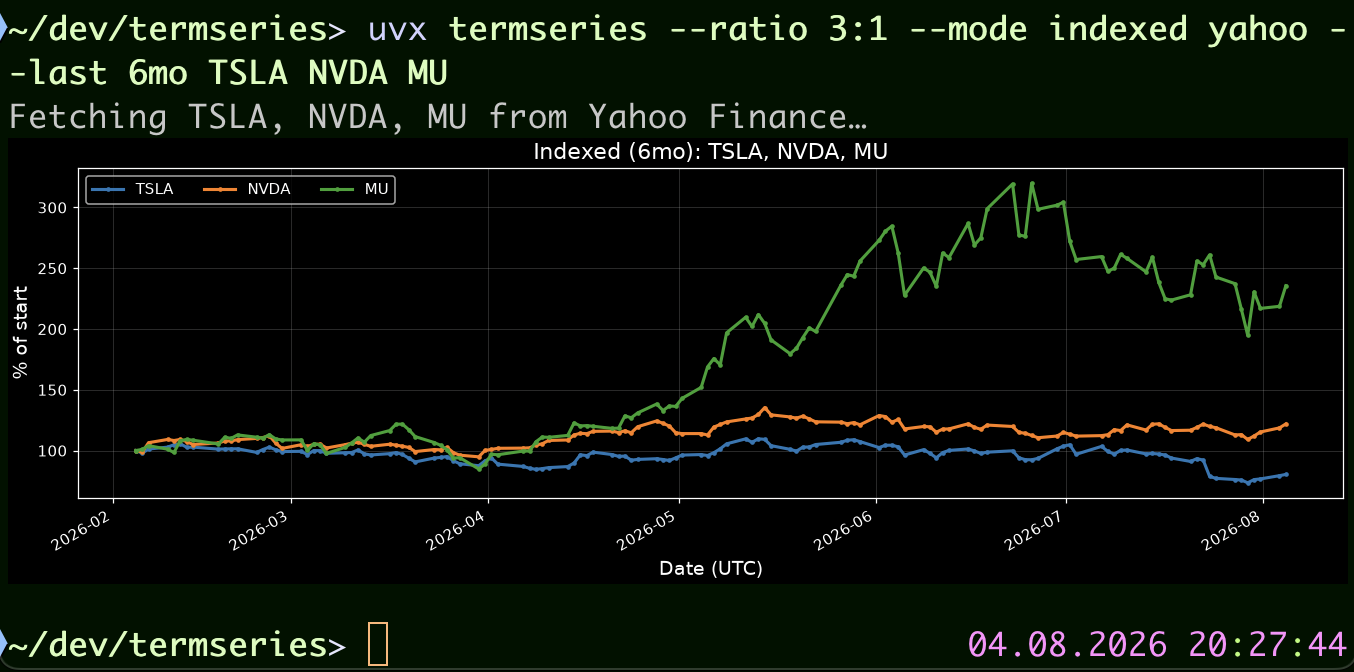
Show timeseries data in the terminal using matplotlib. Plot stock prices from Yahoo Finance, sensor data from Home Assistant, numeric fields from Obsidian daily notes, or any numeric timeseries from local CSV files. Renders high-quality PNG charts inline (Kitty, iTerm2, Sixel) or saves to file, with an optional interactive Textual TUI.
Features
Data Sources
- Fetch stock/crypto/index prices from Yahoo Finance via the
yahoosubcommand, with auto-picked intra-day intervals for short periods (e.g. 5m for 1d, 15m for 5d/7d) - Chart prediction-market prices from Polymarket via the
polymarketsubcommand, with auto-picked aggregation intervals based on period duration - Plot Home Assistant sensor history via the
hasssubcommand (REST API) - Load local CSV files (timestamp, value) via the
csvsubcommand; a headered file with multiple value columns auto-plots all of them, or select specific ones withfile.csv:col1,col2 - Plot numeric YAML-frontmatter fields from Obsidian daily notes via the
obsidiansubcommand; select fields withvault/Daily:field1,field2(mandatory -- fields are never auto-expanded) - Auto-detect and skip CSV headers, blank lines, blank values, NaN/Inf values
- Accept ISO 8601 timestamps and Unix epochs in CSV files
- Auto-detect the unit of measurement from Home Assistant entity attributes
- All timestamps are stored internally as UTC; use
--tzto display in another timezone
Chart Modes
- Absolute values (default), indexed to 100%, logarithmic scale
- Drawdown from running peak, interval-aware returns (label adapts to interval), and relative price ratio
- Cumulative running total and point-to-point delta
- Seasonal mode (
--mode seasonal) wraps a multi-cycle series into overlaid per-cycle lines (e.g. one line per year) via--cycle year|quarter|<duration>— see Seasonal Mode - Rolling windows via
--lastand fixed bounds via--from/--toacross all subcommands - Calendar-anchored to-date periods:
ytd,mtd,wtd,dtd,htd
Terminal Rendering
- Auto-detect Kitty, iTerm2, and Sixel-capable terminals for inline PNG display
- Fall back to writing a PNG file when no inline protocol is available
- Adaptive vertical calendar dividers (hours, days, months, or years), aligned to
--tz - Auto-detect dark/light terminal background for theme selection
- Force dark/light theme or inline/file output via environment variables
Interactive TUI
- Full-screen Textual TUI with dropdowns for period, aspect ratio, mode, and color cycle; "custom…" option in the Period menu for arbitrary values, and "from-to…" for an explicit date range (partial dates like
2024-05are zero-padded to a full timestamp, rounding From down to the start and To up to the end, same as the CLI's--from/--to) - Launching with
-iand--from/--toseeds that range as its own pre-selected Period entry instead of rejecting it --mode seasonalworks in the TUI too, re-wrapping data on every redraw- Live ticker/entity/file input with immediate re-render on submit
- Debounced chart re-render on terminal resize using cached data
- Auto-reload at a configurable interval (
--reload N) or toggled with Ctrl+R - Copy current plot to clipboard with Ctrl+Y
Customization
- Configurable aspect ratio (
--ratio W:Horfitfor terminal-filling) - Seven built-in color cycles (tab10, Set1, Set2, Dark2, Accent, Pastel1, tab20)
- Layer custom
.mplstyleoverrides on top of the built-in dark/light themes - Consistent font sizes across terminal widths in TUI mode
- Custom chart title (
--title) and toggleable legend (--legend/--no-legend)
Clipboard & Output
- Copy rendered plot to system clipboard (
-cor Ctrl+Y in TUI) - Clipboard warnings when running inside Docker or over SSH
- Built-in
democommand showcasing multiple chart modes
Developer Experience
- Fully typed (
py.typed, mypy-checked) - Pre-commit hooks for ruff, ruff-format, and mypy
- 430+ unit tests covering all modules, run in CI on Linux and Windows
- Docker support with Compose for containerized usage
Installation
pip install termseries
Or with uv:
uv tool install termseries
Or run it without installing, via uvx:
uvx termseries yahoo TSLA AAPL MSFT
Quick Start
# Plot stock prices (7-day default)
termseries yahoo TSLA AAPL MSFT

# Indexed comparison over 1 month
termseries --mode indexed yahoo --last 1mo TSLA AAPL MSFT

# Log scale over 5 years
termseries --mode log yahoo --last 5y AAPL MSFT GOOGL

# Drawdown chart
termseries --mode drawdown yahoo --last 1y TSLA AAPL

# Intra-day: 1-day period auto-picks 5-minute intervals
termseries yahoo TSLA --last 1d

# Explicit 1-minute interval override
termseries yahoo TSLA --interval 1m --last 1d

# Relative price ratio (exactly 2 tickers)
termseries --mode relative yahoo --last 1y AAPL MSFT

# Cumulative sum
termseries --mode cumulative csv sensor.csv --last 30d

# Point-to-point delta
termseries --mode delta yahoo TSLA --last 1mo

# Seasonal: overlay each year as its own line
termseries --mode seasonal yahoo TSLA --from 2022

# Seasonal: overlay each quarter (calendar-aligned, day-of-quarter x-axis)
termseries --mode seasonal --cycle quarter yahoo TSLA --last 2y

# Seasonal: overlay each week (Monday-Sunday x-axis)
termseries --mode seasonal --cycle 1w yahoo TSLA --last 6mo

# Custom title, no legend
termseries --title "TSLA vs AAPL" --no-legend yahoo TSLA AAPL --last 1y

# Show gaps in data (break lines where data is missing)
termseries --gaps show hass sensor.living_room_temperature --last 7d

# Connect gaps under 1 hour, break larger ones
termseries --gaps 1h csv sensor.csv --last 30d

# Step-style line (staircase effect)
termseries --line-style step-post yahoo TSLA --last 5d

# Display x-axis in your local timezone
termseries --tz local yahoo TSLA AAPL

# Display x-axis in a specific timezone
termseries --tz Europe/Berlin hass sensor.living_room_temperature --last 1d

# Copy plot to clipboard
termseries yahoo -c TSLA AAPL

# Interactive TUI
termseries -i yahoo TSLA

# --- Home Assistant sensors ---

# Plot HASS sensor data (requires HASS_SERVER and HASS_TOKEN env vars)
termseries hass sensor.living_room_temperature sensor.bedroom_temperature

# Last 3 hours of data
termseries hass sensor.living_room_temperature --last 3h

# Last 30 days with explicit unit
termseries hass sensor.living_room_temperature --last 30d --unit '°C'

# Glob pattern: plot every matching entity in one call
termseries hass "sensor.*battery_level" --last 7d

# Interactive TUI with HASS data
termseries -i hass sensor.power_consumption

# --- Polymarket markets ---

# Plot a Polymarket market's "yes" price
termseries polymarket will-bitcoin-hit-150k-in-2026

# Plot the "no" outcome instead
termseries polymarket will-bitcoin-hit-150k-in-2026 --outcome no

# Last 30 days
termseries polymarket will-bitcoin-hit-150k-in-2026 --last 30d

# --- CSV files ---

# Plot a local CSV (two columns: timestamp, value)
termseries csv /path/to/sensor.csv

# Multiple files, last 7 days, with a custom unit label
termseries csv temp.csv humidity.csv --last 7d --unit '°C'

# Headered CSV with multiple value columns: plots every column
termseries csv sensors.csv --last 7d

# Only plot specific columns from a headered CSV
termseries csv sensors.csv:temp,humidity --last 7d

# Non-standard periods work everywhere
termseries yahoo TSLA --last 14d
termseries yahoo TSLA --last 2w

# Calendar-anchored to-date periods
termseries yahoo TSLA --last ytd
termseries yahoo TSLA --last mtd
termseries hass sensor.power_consumption --last dtd

# Interactive TUI with CSV data
termseries -i csv sensor.csv

# --- Obsidian daily notes ---

# Plot numeric frontmatter fields from an Obsidian daily-notes folder
termseries obsidian ~/vault/Daily:mood,weight --last 90d
CSV File Format
The csv subcommand expects two-column CSV files (timestamp, value). Header
rows are auto-detected and skipped. Timestamps can be ISO 8601 strings or Unix
epochs. Blank lines, blank values, and NaN/Inf values are silently skipped.
Naive timestamps (without an explicit offset) are assumed to be UTC.
2024-01-01T00:00:00Z,20.5
2024-01-02T00:00:00Z,21.0
2024-01-03T00:00:00Z,22.1
A plain two-column file becomes one series labelled by its filename (without
extension). A CSV with a header row and more than one value column plots
every column by default, each labelled <stem>.<column>:
timestamp,temp,humidity
2024-01-01T00:00:00Z,20.5,50.0
2024-01-02T00:00:00Z,21.0,55.0
termseries csv sensors.csv --last 7d
Append :col1,col2 to a path to plot only specific columns instead of every
one:
termseries csv sensors.csv:temp,humidity --last 7d
The --last filters to a now-anchored time window using free-form
<number><unit> syntax (e.g. 7d, 2w, 3mo). Special values: max
(default) shows all data with the x-axis extending to now; auto auto-fits
the x-axis to the data with no empty space. The --unit option sets the
y-axis label (default: value).
For high-frequency data, --resample reduces points into fixed, UTC-aligned
buckets before rendering. Use --aggregate to select the bucket reducer
(mean by default; also median, min, max, sum, count, first, and
last). The plotted timestamp is the start of each bucket. For example:
termseries csv data/heart.csv --last 1mo --resample 1m --aggregate mean --unit bpm
--last 1m means the last minute; use --last 1mo for the last month.
The hass subcommand uses the same --last syntax and auto-detects the unit
from the entity's attributes. Entity IDs may include glob-style patterns
(* matches any run of characters, ? matches a single character),
expanded against all entities currently known to Home Assistant:
# Plot every sensor whose ID contains "battery_level"
termseries hass "sensor.*battery_level" --period 7d
Quote patterns so your shell doesn't expand them first. The match isn't
anchored to the end, so sensor.*battery_level also matches
sensor.phone_battery_level_2.
Obsidian Vault Format
The obsidian subcommand plots numeric fields tracked in the YAML
frontmatter of Obsidian daily notes -- one point per day, one curve per
field. Point it at a daily-notes folder (top-level .md files only, not
recursive) with :field1,field2 appended to select which frontmatter keys
to plot; fields are mandatory, they're never auto-expanded, since daily
notes tend to accumulate plenty of incidental numeric-looking keys
(streak counts, word counts) that would make an auto-plotted chart noisy.
---
mood: 7
weight: 72.5
---

Today was productive...
Each note's date comes from its filename (YYYY-MM-DD.md, the Obsidian
Daily Notes / Periodic Notes plugin convention) or, for notes with a
different name, a date: frontmatter key as a fallback. Notes with neither
are silently skipped, so templates and one-off notes in the same folder
don't break the scan. A field missing from some notes -- or present but
left empty (exercise-dumbbells: with nothing after the colon, the common
habit-tracker-template pattern of a key that's always there but only filled
in on days it applies) -- is skipped silently too. A field present with an
actual non-numeric value (a string, a list, etc.) raises instead, since
that's more likely a mistake worth seeing than data worth silently
dropping.
termseries obsidian ~/vault/Daily:mood,weight --last 90d
The same --last/--from/--to/--first time-range syntax as every
other subcommand applies, plus --unit to set the y-axis label. When the
same field is requested from two different directories in one command, the
second one is labelled <dirname>.<field> to disambiguate.
Fitbit JSON conversion
tools/fitbit_to_csv.py combines Fitbit JSON exports in data/ into the
standard two-column CSV consumed by termseries csv. Fitbit timestamps have no
timezone marker, so the converter interprets them as Europe/Berlin by default
and writes normalized UTC timestamps; override this with --timezone as needed.
python tools/fitbit_to_csv.py steps data data/steps.csv
python tools/fitbit_to_csv.py heart data data/heart.csv
python tools/fitbit_to_csv.py sleep data data/sleep.csv

termseries csv data/steps.csv --unit steps --last max
termseries csv data/heart.csv --unit bpm --last max
termseries --line-style step-post --gaps show csv data/sleep.csv --unit stage --last max
The sleep CSV represents detailed main-session sleep stages as a numeric step
series: wake=0, REM=1, light=2, and deep=3. The converter sorts records
and removes duplicate timestamps, and uses a temporary on-disk index so large
heart-rate exports do not need to fit in memory.
Shared Options
| Option | Description |
|---|---|
--ratio W:H |
Figure aspect ratio (default: 4:1) |
--mode |
Chart mode: absolute, indexed, log, drawdown, returns, relative, cumulative, delta, seasonal |
--cycle |
Seasonal cycle length: year, quarter, or a duration (e.g. 1w, 90d) — only valid with --mode seasonal, defaults to year (see Seasonal Mode) |
--title |
Custom chart title (default: auto-generated from mode/period/series) |
--legend / --no-legend |
Show or hide the series legend (default: shown) |
--tz TZ |
Timezone for x-axis: UTC (default), local, or IANA name (e.g. Europe/Berlin) |
--colors |
Matplotlib color cycle: tab10, Set1, Set2, Dark2, Accent, Pastel1, tab20 |
--gaps |
Gap handling: connect (default), show (break lines at gaps), or duration threshold (e.g. 1h) |
--line-style |
Line connection style: linear (default), step-pre, step-post, step-mid |
--style PATH |
Extra .mplstyle file layered on top of the base theme (see Custom Styles) |
-c / --copy |
Copy plot to system clipboard |
-i / --interactive |
Launch Textual TUI |
Time range syntax (all subcommands)
Use --last for a rolling window ending now, --from and --to for a fixed
inclusive interval, or --first for a duration beginning at the earliest
returned data point. --to defaults to now; these forms cannot be combined.
--period remains a compatibility alias for --last.
termseries yahoo TSLA --last 7d
termseries yahoo TSLA --from 2026-07-01 --to 2026-07-31
termseries csv readings.csv --from ytd
termseries csv readings.csv --first 7d
--from and --to accept ISO-8601 dates/times (such as 2026-07-01 or
2026-07-01T12:00:00Z), now, and the same relative/calendar expressions as
--last (such as 7d and ytd).
Partial dates/times are zero-padded to a full timestamp, and the direction of
padding depends on which bound you're filling in, so the range stays fully
inclusive: --from rounds down to the start of the given granularity, while
--to rounds up to its end (calendar-aware, so February gets 28 or 29 days
correctly). For example, --from 2025 --to 2026 expands to
2025-01-01T00:00:00 through 2026-12-31T23:59:59 — covering all of both
years — not just the first instant of 2026. Likewise --from 2026-05 starts
at 2026-05-01T00:00:00 and --to 2026-05 ends at 2026-05-31T23:59:59.
A fully-specified timestamp on either side is used as-is.
Warning: --first is data-anchored, not calendar-anchored. Its effective start
can change when a source adds or backfills older history, so use --from and
--to for reproducible charts. It accepts durations only (for example 7d,
2w, or 3mo).
--last accepts free-form <number><unit> values:
| Unit | Example | Meaning |
|---|---|---|
m |
30m |
minutes |
h |
6h |
hours |
d |
14d |
days |
w |
2w |
weeks |
mo |
3mo |
months (≈30 days) |
y |
1y |
years (≈365 days) |
ytd |
ytd |
year-to-date (from Jan 1st) |
mtd |
mtd |
month-to-date (from 1st of month) |
wtd |
wtd |
week-to-date (from Monday) |
dtd |
dtd |
day-to-date (from midnight) |
htd |
htd |
hour-to-date (from start of hour) |
max |
all data, x-axis extends to now | |
auto |
all data, x-axis fits to data |
Calendar boundaries for ytd/mtd/wtd/dtd/htd are computed in the
timezone set by --tz (default UTC) — e.g. --tz local --last dtd means
"since local midnight", not UTC midnight.
For Yahoo, non-native periods (e.g. 14d, 2w) are handled automatically by
overfetching the next-larger native range and trimming client-side.
Seasonal Mode
--mode seasonal wraps a multi-cycle series into overlaid per-cycle lines —
e.g. one line per year, so you can compare the same time of year across
multiple years at a glance. Use --cycle to pick the cycle length:
# One line per calendar year (default cycle)
termseries --mode seasonal yahoo TSLA --from 2022

# One line per calendar quarter (Q1/Q2/Q3/Q4 all overlay onto the same
# Jan-Mar-shaped window, so the x-axis shows a single quarter's width)
termseries --mode seasonal --cycle quarter yahoo TSLA --last 2y

# One line per calendar week, Monday-aligned
termseries --mode seasonal --cycle 1w yahoo TSLA --last 6mo

# Arbitrary duration cycles (e.g. 90-day chunks)
termseries --mode seasonal --cycle 90d yahoo TSLA --last 1y
Each output series is labeled with its cycle, e.g. TSLA (2024),
TSLA (2024 Q1), TSLA (2024-W03). The x-axis label and tick formatting
adapt to the cycle:
--cycle |
X-axis label | Tick format |
|---|---|---|
year (default) |
Month of year |
Month names (Jan, Feb, …), centered mid-month |
quarter |
Day of quarter |
Day offset within the quarter (Day 1…Day 92) |
a 7-day duration (1w/7d) |
Day of week |
Weekday names, Monday-aligned, centered on each day |
| any other duration | Day of chunk |
Day offset within the chunk |
The timezone is only shown in the x-axis label when it can actually affect
what's displayed (quarter and week cycles, which are day-or-finer
calendar-aligned); it's omitted for year (month-level display) and other
duration cycles (elapsed-time based, timezone-invariant).
If --cycle is as long as or longer than the available data, only one
chunk is produced and a warning is printed (CLI) or shown as a notification
(TUI) instead of failing. --mode seasonal works with --interactive (-i)
too, wrapping freshly fetched data on every redraw — the cycle length comes
from --cycle at launch (no in-TUI cycle selector yet).
Yahoo-specific Options
| Option | Description |
|---|---|
--last |
Rolling chart range ending now (default: 7d). Any <number><unit>, max, or auto; --period is an alias |
--from, --to |
Inclusive fixed bounds; --to defaults to now |
--first |
Data-anchored duration; may change when older history is backfilled |
--interval |
Data interval: auto (default), 1m, 5m, 15m, 30m, 60m, 90m, 1d |
When --interval auto (the default), termseries picks a sensible interval based
on the period duration:
| Period duration | Auto interval |
|---|---|
| ≤ 1 day | 5m |
| ≤ 7 days | 15m |
| > 7 days | 1d |
Polymarket-specific Options
| Option | Description |
|---|---|
--outcome |
Outcome label to chart, usually yes or no for binary markets (default: yes) |
--interval |
Aggregation interval: auto (default), max, all, 1m, 1h, 6h, 1d, 1w |
--fidelity |
Data fidelity in minutes for the Polymarket history API (default: 1) |
When --interval auto (the default), termseries picks a sensible interval based
on the period duration:
| Period duration | Auto interval |
|---|---|
| ≤ 6 hours | 1m |
| ≤ 3 days | 1h |
| ≤ 30 days | 6h |
| ≤ 180 days | 1d |
| > 180 days | 1w |
Home Assistant Setup
The hass subcommand connects to a running Home Assistant instance via the
REST API. Set these environment variables:
export HASS_SERVER=http://homeassistant.local:8123
export HASS_TOKEN=your_long_lived_access_token
Create a long-lived access token in HASS under Profile > Security > Long-Lived
Access Tokens. The unit label (y-axis) is auto-detected from the entity's
unit_of_measurement attribute; use --unit to override.
Custom Styles
Chart appearance is controlled by Matplotlib .mplstyle files. termseries
ships with two built-in themes (dark and light) that are automatically
selected based on your terminal's background color. You can override any
setting by passing an extra style file with --style:
# Use thinner lines, no markers
termseries --style my-overrides.mplstyle yahoo TSLA AAPL
The override file only needs the keys you want to change -- everything else is inherited from the base theme.
Built-in theme defaults
Both dark.mplstyle and light.mplstyle share the same layout settings
(they differ only in colors):
| Key | Default | Controls |
|---|---|---|
axes.titlesize |
14 | Chart title |
axes.labelsize |
12 | Axis labels ("Date (UTC)", "Close (USD)") |
xtick.labelsize |
10 | X-axis tick values |
ytick.labelsize |
10 | Y-axis tick values |
legend.fontsize |
10 | Legend text |
lines.linewidth |
2 | Line thickness |
lines.marker |
o | Data-point marker shape |
lines.markersize |
6 | Marker size |
grid.alpha |
0.3 | Grid transparency |
grid.linewidth |
0.5 | Grid line thickness |
figure.dpi |
200 | Output resolution |
Example override file
# my-overrides.mplstyle
axes.titlesize:   18          # bigger title
axes.labelsize:   16          # bigger axis labels
xtick.labelsize:  14          # bigger tick labels
ytick.labelsize:  14
lines.linewidth:  1.5
lines.marker:     None        # no markers, just lines
figure.dpi:       150         # lower DPI for smaller file size
grid.linestyle:   --          # dashed grid
See the full Matplotlib customization guide for all available keys.
Environment Variables
| Variable | Effect |
|---|---|
HASS_SERVER |
Home Assistant base URL (e.g. http://ha.local:8123) |
HASS_TOKEN |
Home Assistant long-lived access token |
Theme
Use --theme dark|light|auto to control the plot theme. The default is auto, which detects the terminal background.
termseries --theme dark yahoo TSLA
To persist the setting, create a termseries.env config file. Termseries searches for (first found wins):
.termseries.envin the current working directory~/.config/termseries/termseries.env
# termseries.env
THEME=dark
See termseries.env.example for a commented template.
Precedence (highest to lowest): --theme flag → config file → auto-detection.
Output
Use --output to control where the rendered PNG goes:
| Value | Behaviour |
|---|---|
(omitted) or auto |
Inline display if the terminal supports it; otherwise write an auto-named file |
inline |
Force inline display; warn and fall back to file if no protocol detected |
- |
Write raw PNG bytes to stdout (no terminal escape sequences — useful for piping) |
path/to/file.png |
Write to the named file |
termseries --output chart.png yahoo TSLA
termseries --output - yahoo TSLA | display   # pipe to ImageMagick
termseries --output inline yahoo TSLA
Use --protocol to override which inline graphics protocol is used (default: auto):
| Value | Protocol |
|---|---|
auto |
Auto-detect from terminal environment (default) |
kitty |
Kitty Terminal Graphics Protocol |
iterm2 |
iTerm2 OSC 1337 Inline Images Protocol |
sixel |
Sixel graphics |
This is especially useful inside tmux or other multiplexers where terminal detection can fail:
termseries --output inline --protocol iterm2 yahoo TSLA
Both options can be persisted in termseries.env:
# termseries.env
OUTPUT=inline
PROTOCOL=kitty
Precedence (highest to lowest): CLI flag → config file → auto-detection.
Development
git clone https://github.com/deeplook/termseries.git
cd termseries
uv sync --all-extras
uv run pre-commit install
make test
Contributing
See CONTRIBUTING.md.
License
1 maintainer

Release files for termseries 0.4.0
For a detailed explanation of source distributions (sdists) and built distributions (wheels), please see the package formats documentation.
Source distribution (sdist)
| File | Size | Uploaded | |
|---|---|---|---|
| termseries-0.4.0.tar.gz | 251.1 kB | Details |
Built distribution (wheel)
| File | Interpreter | ABI | Platform | Reset |
|---|---|---|---|---|
| termseries-0.4.0-py3-none-any.whl | Python 3 | none | any | Details |
Total release size: 320.2 kB
Release files / termseries-0.4.0.tar.gz
| Download URL | termseries-0.4.0.tar.gz |
|---|---|
| Size | 251.1 kB |
| Tags | Source |
|
SHA-256 checksum How to use checksums |
f7cf9149c8cf49b4773041455df27ac3e971f895f4612211346a3ea1d7cc1fec
|
|
BLAKE2b-256 checksum How to use checksums |
0b73ff2b6387700b78914e3d3bed0609ef7a0c78f290874e5cd2981b718fdd7f
|
| Upload date | |
|
Uploaded using Trusted Publishing? What is trusted publishing? |
Yes |
| Uploaded via |
uv/0.12.8 {"installer":{"name":"uv","version":"0.12.8","subcommand":["publish"]},"python":null,"implementation":{"name":null,"version":null},"distro":{"name":"Ubuntu","version":"24.04","id":"noble","libc":null},"system":{"name":null,"release":null},"cpu":null,"openssl_version":null,"setuptools_version":null,"rustc_version":null,"ci":true}
|
Release files / termseries-0.4.0-py3-none-any.whl
| Download URL | termseries-0.4.0-py3-none-any.whl |
|---|---|
| Size | 69.1 kB |
| Tags | Python 3 |
|
SHA-256 checksum How to use checksums |
b960724599bbb2da4b7343f01d65acdfbe4a9591c1ab1af30e3fa585cfcd430a
|
|
BLAKE2b-256 checksum How to use checksums |
fff9bdbe741f168b0b7decb17da0ed097b71e3afe8d1f1a9fc6fb3e589fd2c0e
|
| Upload date | |
|
Uploaded using Trusted Publishing? What is trusted publishing? |
Yes |
| Uploaded via |
uv/0.12.8 {"installer":{"name":"uv","version":"0.12.8","subcommand":["publish"]},"python":null,"implementation":{"name":null,"version":null},"distro":{"name":"Ubuntu","version":"24.04","id":"noble","libc":null},"system":{"name":null,"release":null},"cpu":null,"openssl_version":null,"setuptools_version":null,"rustc_version":null,"ci":true}
|














