
TikzPlot
A clean version of PltToTikz, this time as Python package. Easy to use: only replace import matplotlib.pyplot with this library.
Please report any bugs or unexpected behaviour in Issues. Examples may be found in repository under tests/ directory.
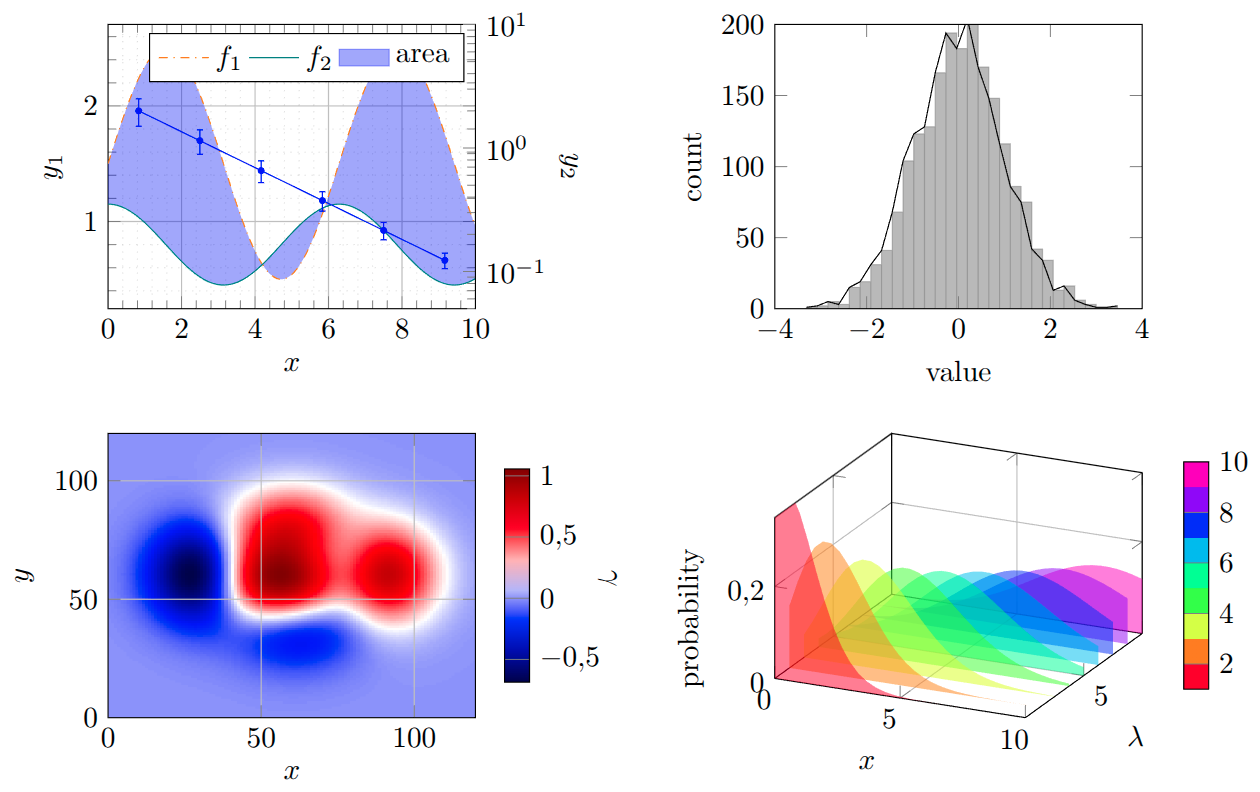
Why use pgfplots instead of matplotlib?
- Tikz/pgfplots is a LaTeX package, so it is easy to integrate into your LaTeX document, and the fonts will match your document, rescaling will not affect font sizes.
- Tikz/pgfplots graph is easy to edit, especially if only minor style changes are needed, while matplotlib requires re-running the code to generate a new graph.
- Full math mode is supported, so you can use LaTeX math in your labels, legends, etc.
Why use this package instead of other available?
- It is easy to use, with code being very similar to matplotlib and only minor changes are needed to switch from matplotlib to this package.
- It relies on frontend commands, which is less likley to change in matplotlib, so new updates do not break it.
- It generates clean and readable Tikz code, which is easy to edit and understand. Code is also efficient and does not contain unnecessary commands, which is important escpecially for large graphs.
- If you use LLMs to generate pgfplots code, you will often get code that is not compilable, since for more complex requirements, LLMs make up commands that do not exist. This package covers many use cases and generates compilable code.
Installation
PyPI: pip install tikzplot42.
Alternativley, download this package and install using: pip install [path], where [path] is the path to the directory, containing pyproject.toml.
Python usage
Instead of using import matplotlib.pyplot (as plt), use import tikzplot.plots (as plt).
LaTeX requirements
All required packages are automatically detected and can be printed at save using kwarg print_requirements=True (for standalone files, preambule is automatically added).
\usepackage{tikz},\usepackage{pgfplots},\pgfplotsset{compat=1.18}(may be lower, but compilation is not guaranteed),\usepgfplotslibrary{fillbetween}(if you use fill-between plots),\usepgfplotslibrary{groupplots}(recommended for best results, enabled by default, may be avoided by setting TikzConfig USE_GROUPPLOTS=False),\usepackage{xcolor}(recommended for best colors, works without but needs change of TikzConfig USE_XCOLOR=False),\usepgfplotslibrary{polar}required for polar axis,\usetikzlibrary{patterns.meta}for hatch patterns (available for fill_between, hist and axvspan/axhspan).
Export using plt.savefig("example_graph.tex") (recommended) or plt.show().
Then use the generated file as \input{example_graph.tex}.
Currently implemented:
Some basic plot commands are already implemented with commonly used arguments:
Plotting
plot(),scatter(),loglog(),semilogx()/semilogy(),errorbar(),stem(),fill_between(),hlines()/vlines(),hist(),bar()/barh(),bar_label(),stackplot(),step(),imshow(),text(),magnify()(used to magnify part of a plot, but Tikz cannot handlefill_betweenif this one is used, which is a long known issue),axvline()/axhline(),axvspan()/axhspan()(background span).
Figures
plt.figure()(currently only to give you figure object or to setfigsize),plt.subplot(),plt.subplots()(withsharex/shareyfully implemented, projectionpolarand3dwith basic support),set_size_inches(),delaxes().
Styles
If axes and plot have different name for command with same effect, both are implemented (e.g. plt.xlim() and ax.set_xlim()).
grid(),xlabel()/ylabel(),xlim(), ylim(),xscale("log")/yscale("log"),xticks()/yticks(),ax.set_xticklabels()/ax.set_yticklabels(),legend()(basic position control),ax.twinx(),ax.set(),ax.tick_params(),
There is a limited support for built-in styles (e.g. plt.style.use("default")), you may also define your own style using plt.style.set_profile(). Currently supported features are: color cycle (hex colors sequence), line width (in pt), grid (with matplotlib kwargs), background (latex style key=value), additional settings (raw latex code for optional arguments to axis: key=value).
Supported common **kwargs
color/c,linestyle/ls,linewidth/ls,fmt,marker,marksize/ms,alpha,label.
Colorbars
Colorbars and colormaps are implemented a bit differently than in matplotlib (simplified):
- if you use
imshow(), you may use its return inColorbar()(which you have to import asfrom tikzplot import Colorbar), - you may use
Colorbar(axis, cmap, lower, upper, ...)for manual colorbar. Additional kwargs may also be used byimshow()return, - note that only one colorbar/colormap per axis is allowed (also if you use
scatterwith colormap/colorbar).
TikzConfig
For plot configurations (default sizes, paddings, etc.), use from tikzplot import TikzConfig:
modifyParam(PARAM=value)(for runtime session setting),setPermanent(PARAM=value)(for user defined default value). Currently supported parameters are listed with their default values insrc/tikzplot/config.py.
More features coming soon...
- additional arguments support for implemented commands,
- improved 3D plots (currently only basic support: plot, errorbar, fill_between, scatter, plot_wireframe, plot_surface),
- ...
1 maintainer

Release files for tikzplot42 0.5.2
For a detailed explanation of source distributions (sdists) and built distributions (wheels), please see the package formats documentation.
Source distribution (sdist)
| File | Size | Uploaded | |
|---|---|---|---|
| tikzplot42-0.5.2.tar.gz | 115.2 kB | Details |
Built distribution (wheel)
| File | Interpreter | ABI | Platform | Reset |
|---|---|---|---|---|
| tikzplot42-0.5.2-py3-none-any.whl | Python 3 | none | any | Details |
Total release size: 215.7 kB
Release files / tikzplot42-0.5.2.tar.gz
| Download URL | tikzplot42-0.5.2.tar.gz |
|---|---|
| Size | 115.2 kB |
| Tags | Source |
|
SHA-256 checksum How to use checksums |
fe5d5e41b909898be21dd2097d7501123fbc1d3893e162ea5807e78746024ca1
|
|
BLAKE2b-256 checksum How to use checksums |
0741cd22a1288b6d83d7eb3015aeb8fa21857d4c84e8daa8649c8c786eb5a053
|
| Upload date | |
|
Uploaded using Trusted Publishing? What is trusted publishing? |
No |
| Uploaded via |
twine/7.0.0 CPython/3.13.14
|
Release files / tikzplot42-0.5.2-py3-none-any.whl
| Download URL | tikzplot42-0.5.2-py3-none-any.whl |
|---|---|
| Size | 100.5 kB |
| Tags | Python 3 |
|
SHA-256 checksum How to use checksums |
7f0028cd7969e26ab7da62853a964f8c25827d40f6c3afb96d0ef9778caacd51
|
|
BLAKE2b-256 checksum How to use checksums |
97c59687b943918ee4b2fa2024d2fcd6c72ddce8eea1c5b25c2c5a4ab6b6c09f
|
| Upload date | |
|
Uploaded using Trusted Publishing? What is trusted publishing? |
No |
| Uploaded via |
twine/7.0.0 CPython/3.13.14
|














