
time-decomp
Time series decomposition plot trend and seasonality
Plot trend and seasonality together in one chart as described at Business Days Time Series Weekly Trend and Seasonality.



Added SARIMAX keew predictions (see sarimax_test.py test_plot_keew())
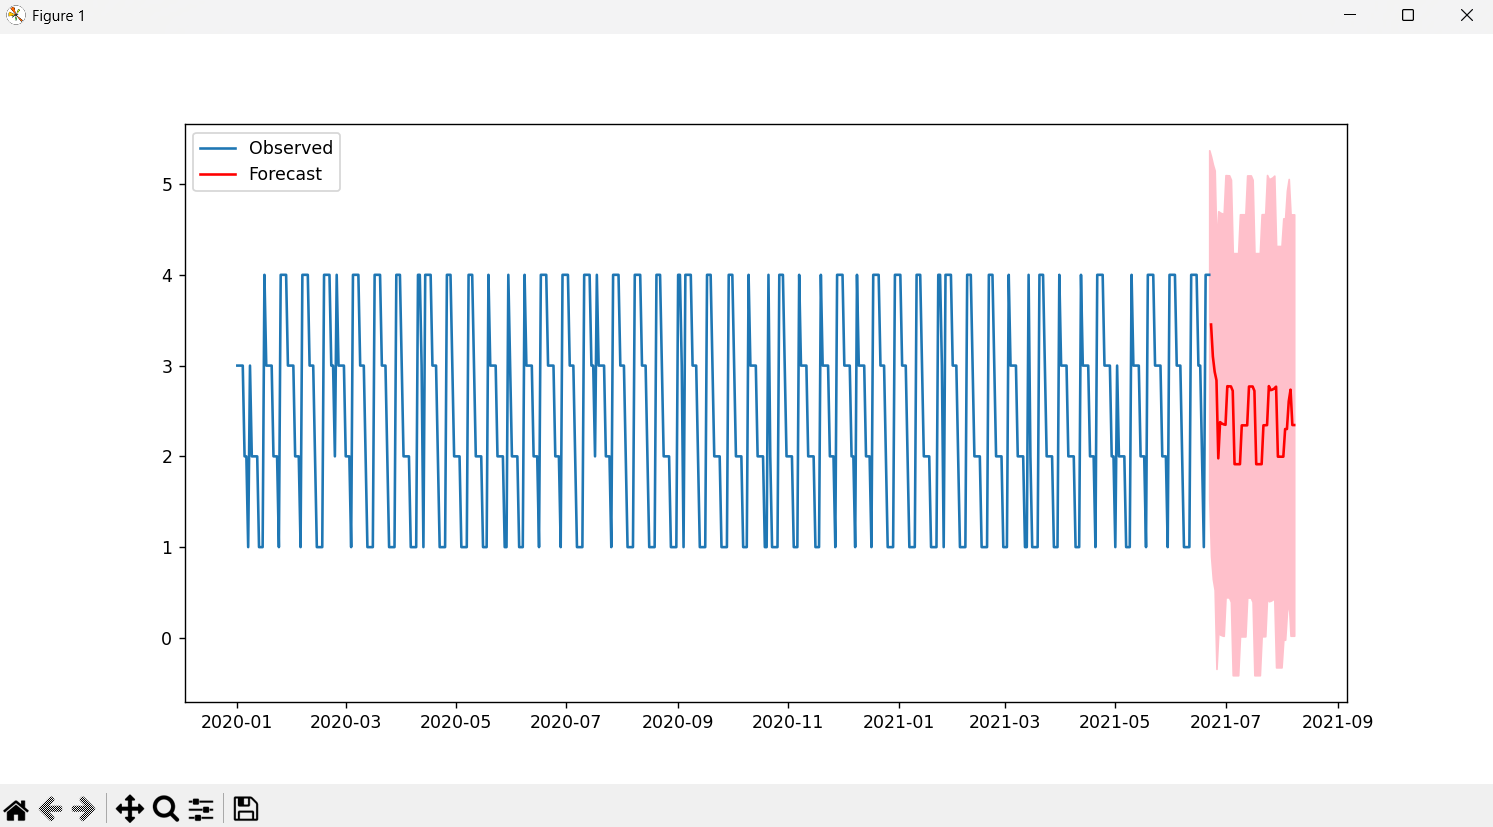
Example usage from ./Python/tests/keew_decomp_test.py
# create test
# test_decomposition.py
import unittest
import pandas as pd
import numpy as np
import matplotlib.pyplot as plt
from time_decomp.decomposition import DecompositionSingleton

class TestKeewDecomposition(unittest.TestCase):
    def setUp(self):
        self.decomp = DecompositionSingleton()

        n = 2000

        df = pd.DataFrame({'A': np.random.randint(0,100, size=(n,)), 'B': np.random.randint(0,100, size=(n,))})

        lsDays = [pd.Timestamp(2021, 1, 1)]*n
        for i in range(n):
            # construct time, where iYear-iMonth-i
            lsDays[i] = pd.Timestamp( np.random.randint(2021,2025), np.random.randint(1,13) , (i+1) % 28 + 1)

        df['Day'] = lsDays

        df['Year'] = df['Day'].dt.year
        df['Month'] = df['Day'].dt.month
        df['KeewMonth'] = df['Day'].apply(self.decomp.get_month_keew)
        df['Keew']=(df['Month']-1)*4+df['KeewMonth']

        self.decomp.df = df.groupby(['Year', 'Keew']).last().reset_index()

        self.decomp.features = ['A', 'B']
        self.decomp.decompose_params = {'model': 'additive', 'period':48, 'extrapolate_trend':'freq'}

    def test_plot_decomposition(self):

        # output df info
        print("Starting test_plot_decomposition")
        print("DataFrame Info:")
        print(self.decomp.df.info())
        print("DataFrame Head:")
        print("\n%s", self.decomp.df.head())


        self.decomp.m_decompose()
        self.decomp.plot_decomposition('A', 'Year', range(2021,2025), 'Keew', 'A keew', chart_elements=[self.decomp.ChartElement.TREND, self.decomp.ChartElement.SEASONAL])
        plt.show()
Added PLOTLY to run from IPython Notebook
from plotly.offline import iplot

decomp.m_decompose()
fig = decomp.plot_decomposition_plotly('A', 'Year', range(2021,2025), 'Keew', 'A keew', chart_elements=[ decomp.ChartElement.OBSERVED, decomp.ChartElement.SEASONAL])
iplot(fig)
Added trends analysis from EnvironmentalTrends
from time_decomp.environmentaltrends import EnvironmentalTrends

# Set pandas option to display all columns
pd.set_option('display.max_columns', None)

class TestEnvironmentalTrends(unittest.TestCase):

    def setUp(self):
        self.decomp = EnvironmentalTrends()
        self.decomp.features = ['A']
        self.decomp.trend_data_params = {'year_col':'Year', 'month_col':'Month' }
        self.decomp.trends_params = {'seasons_per_year': 12, 'trend_lengths': [1], 'end_years': [2025]}

    def test_m_trends(self):
        self.decomp.m_trends()
        # output df info
        print("Starting test_plot_decomposition")
        print("DataFrame Info:")
        print(self.decomp.t['A'].info())
        print("DataFrame Head:")
        print("\n%s", self.decomp.t['A'].head())
DataFrame Head:

%s   Frequency  SeasonsPeryear  TrendLength TrendEnd           TrendPeriod  \
0   Monthly              12            1     2025  Jul 2024 to Jun 2025

   ValueCount  Minimum  Median    Average  Maximum  YearsInPeriod  \
0        12.0      5.0    48.0  50.333333     96.0            1.0

   SeasonsInPeriod  PercentOfYears  PercentOfSeasons  KW-pValue   Seasonality  \
0             12.0           100.0             100.0   0.443263  Non-seasonal

  AppliedSeasonality  MK-S  MK-Variance  MK-pvalue  IncreasingLikelihood  \
0       Non-seasonal   8.0   212.666667   0.631222             68.438909

      TrendDirection  SenSlope  LowerSlope  UpperSlope
0  Likely increasing      16.5      -384.0       544.8
1 maintainer

Metadata
1 maintainer
Release files for time-decomp 2.0.1
For a detailed explanation of source distributions (sdists) and built distributions (wheels), please see the package formats documentation.
Source distribution (sdist)
| File | Size | Uploaded | |
|---|---|---|---|
| time_decomp-2.0.1.tar.gz | 11.4 kB | Details |
Built distribution (wheel)
| File | Interpreter | ABI | Platform | Reset |
|---|---|---|---|---|
| time_decomp-2.0.1-py2.py3-none-any.whl | Python 2, Python 3 | none | any | Details |
Total release size: 21.6 kB
Release files / time_decomp-2.0.1.tar.gz
| Download URL | time_decomp-2.0.1.tar.gz |
|---|---|
| Size | 11.4 kB |
| Tags | Source |
|
SHA-256 checksum How to use checksums |
63a3651ec5dd5732d1d9208d665cc9bb0e8f904437072abb0cac00c547630353
|
|
BLAKE2b-256 checksum How to use checksums |
23baac905c498768d0696bf9b16871fdf24c9e73eda0baf98a4e4ed3691bb985
|
| Upload date | |
|
Uploaded using Trusted Publishing? What is trusted publishing? |
Yes |
| Uploaded via |
twine/6.1.0 CPython/3.12.9
|
Provenance
Provenance describes where a file came from. On PyPI, provenance is shared via attestations, which provide a verifiable record of the build or publishing details. View details, limitations and caveats.


PyPI Publish Attestation
PyPI verified that this artifact, at this checksum, originated from the publisher listed below.
Signed by GitHub Actions, verified by PyPI on Feb 23, 2025.
Transparency logRelease files / time_decomp-2.0.1-py2.py3-none-any.whl
| Download URL | time_decomp-2.0.1-py2.py3-none-any.whl |
|---|---|
| Size | 10.2 kB |
| Tags | Python 2 Python 3 |
|
SHA-256 checksum How to use checksums |
fcd6d562a30b54a232a6fb1553fc215ef8705335f465338bb9587b45ea7e5ea3
|
|
BLAKE2b-256 checksum How to use checksums |
7c850808c5301dfd6b77bc9eeaadc8c9db02331050eee7c21cb9611c1af4d172
|
| Upload date | |
|
Uploaded using Trusted Publishing? What is trusted publishing? |
Yes |
| Uploaded via |
twine/6.1.0 CPython/3.12.9
|
Provenance
Provenance describes where a file came from. On PyPI, provenance is shared via attestations, which provide a verifiable record of the build or publishing details. View details, limitations and caveats.
PyPI Publish Attestation
PyPI verified that this artifact, at this checksum, originated from the publisher listed below.
Signed by GitHub Actions, verified by PyPI on Feb 23, 2025.
Transparency log













