
A minimal library for plotting training progress in Jupyter/Colab

Project description

Installation
pip install tinyGraphs
Options
train_losses:
(Required) List of training loss values to plot
val_losses:
(Required) List of validation loss values to plot
epoch:
(Required) Current epoch number for updating the plot
legend_loc:
Location of the legend on the plot (default: "upper right")
updating_title:
Boolean flag to indicate if the title should update with epoch progress (default: True)
legend:
Boolean flag to show/hide the legend (default: True)
x_label:
Label for the x-axis
y_label:
Label for the y-axis
title:
Main title of the plot
dark_mode:
Boolean flag to switch between light and dark themes (default: True)
Usage
train_losses, val_losses = [], []
epochs = 3

for epoch in range(epochs):
    # Training
    model.train()
    running_train_loss = 0
    for x, y in train_loader:
        x, y = x.to(device), y.to(device)
        optimizer.zero_grad()
        loss = criterion(model(x), y)
        loss.backward()
        optimizer.step()
        running_train_loss += loss.item()
    train_losses.append(running_train_loss / len(train_loader))

    # Validation
    model.eval()
    running_val_loss = 0
    with torch.no_grad():
        for x, y in val_loader:
            x, y = x.to(device), y.to(device)
            loss = criterion(model(x), y)
            running_val_loss += loss.item()
    val_losses.append(running_val_loss / len(val_loader))

    # Plot using tinyGraphs
    plot(train_losses, val_losses, epoch, legend_loc = "upper right", updating_title = False, legend = True, x_label = "x title", y_label = "y title", title = "title", dark_mode = False)
Other Usage Options
plot(train_losses, val_losses, epoch, legend_loc = "upper right", updating_title = False, legend = True, x_label = "Epoch", y_label = "Loss", title = "Loss Graph", dark_mode = True)
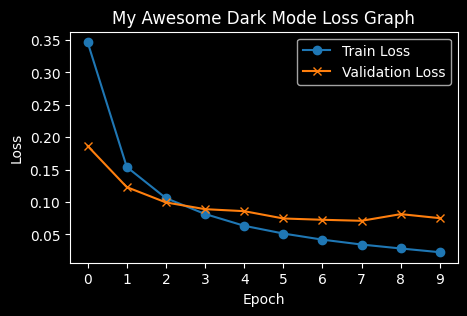
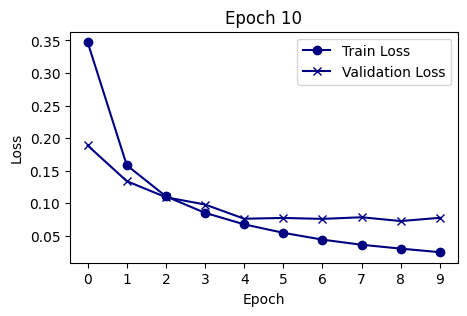
plot(train_losses, val_losses, epoch, color_scheme = 'jet')
Release history Release notifications | RSS feed


Download files
Download the file for your platform. If you're not sure which to choose, learn more about installing packages.
Source Distribution
Built Distribution
Filter files by name, interpreter, ABI, and platform.
If you're not sure about the file name format, learn more about wheel file names.
Copy a direct link to the current filters
File details
Details for the file tinygraphs-1.1.tar.gz.
File metadata
- Download URL: tinygraphs-1.1.tar.gz
- Upload date:
- Size: 3.5 kB
- Tags: Source
- Uploaded using Trusted Publishing? No
- Uploaded via: twine/6.0.1 CPython/3.11.9
File hashes
| Algorithm | Hash digest | |
|---|---|---|
| SHA256 |
50e36c8e403fbb6be77ac44d8a8e04f822da6285c2dbdf3644294ae000ba1480
|
|
| MD5 |
41c9dabc2a14069085b84a14ac4bc74a
|
|
| BLAKE2b-256 |
b9fd20b7edd5801a28e939b3f514b8c7fc26890abdc932673c3062137de2762d
|
File details
Details for the file tinygraphs-1.1-py3-none-any.whl.
File metadata
- Download URL: tinygraphs-1.1-py3-none-any.whl
- Upload date:
- Size: 4.3 kB
- Tags: Python 3
- Uploaded using Trusted Publishing? No
- Uploaded via: twine/6.0.1 CPython/3.11.9
File hashes
| Algorithm | Hash digest | |
|---|---|---|
| SHA256 |
42148446678a73c88e66243e87acdae9e96008ace50fc2a6d278706deff4c714
|
|
| MD5 |
4a1194a992cf93271d79bfe42a66cdc0
|
|
| BLAKE2b-256 |
ab79ba74614aa1e09a19aed2fef2066b0bf212862e861931223c330d480e61b6
|






