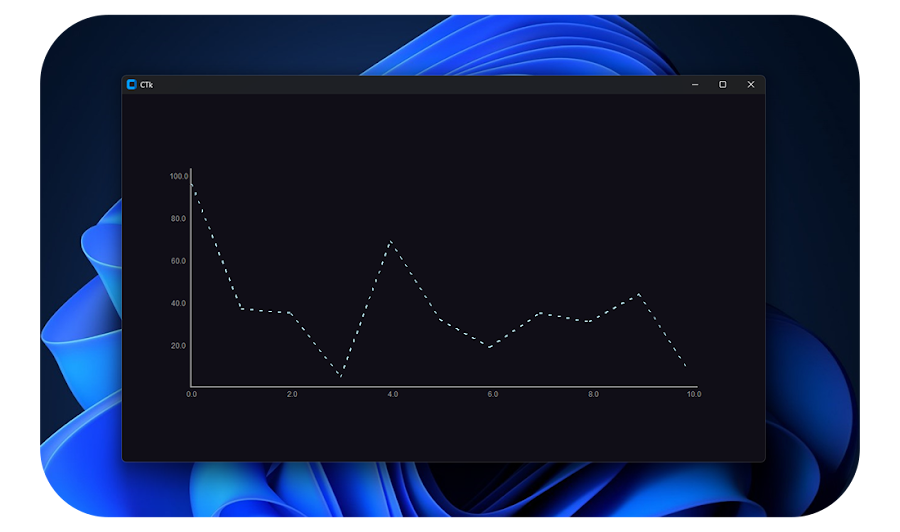
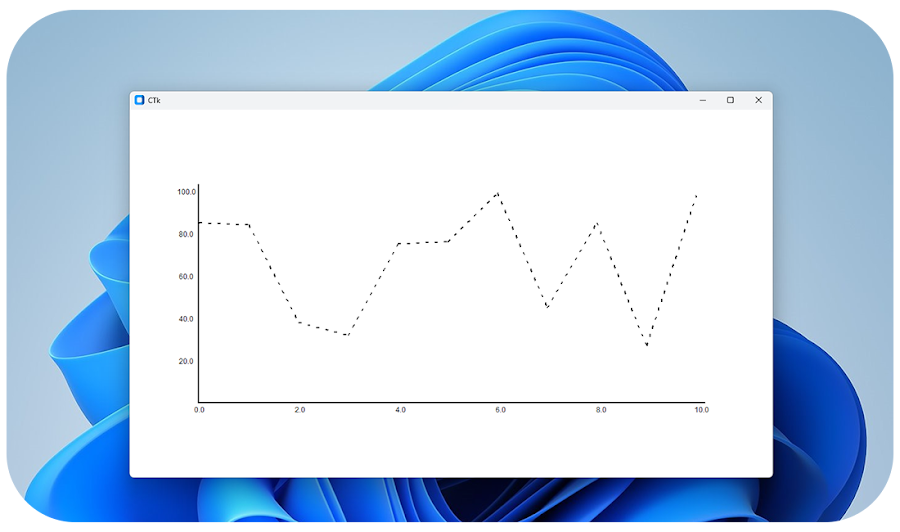
tkchart Library is a Python library that simplifies the process of creating line charts in tkinter and customtkinter GUI applications.


Project description
Contributing to tkchart
Whats New ?
Read Me


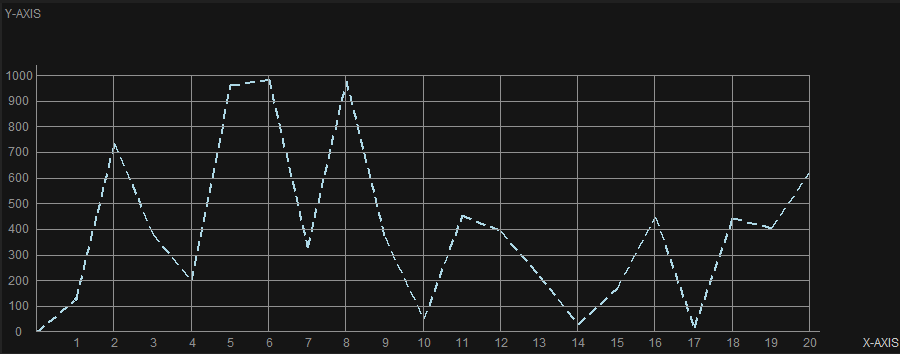
Examples
tkchart - 1.4.0
You need to install & import package first
-
installation
-
pip install tkchart
-
-
importing
-
import tkchart
-
objects
- LineChart
- Line
To display data using LineChart you need to do 3 main tasks
- Creating a LineChart
- Creating a Line
- Display of data
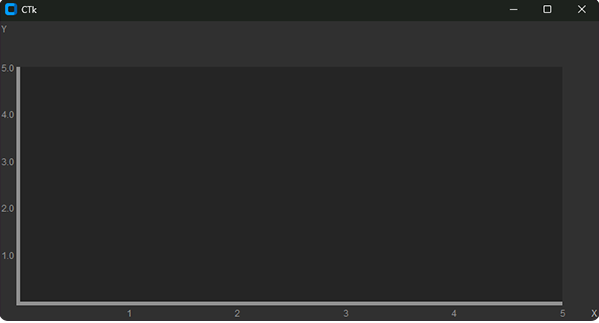
1 . Creating a LineChart
linechart = tkchart.LineChart()
-
Attributes & Types & Values
Master Configuration
- master :
tkinter | customtkinter (Frame | Canvas | Tk)
Dimensions
- width :
int - height :
int - axis_size :
int - x_space :
int - y_space :
int - line_width :
int | str- "auto"
- 10
- pointer_size :
int
Value Configuration
- x_axis_section_count :
int - y_axis_section_count :
int - x_axis_label_count :
int - y_axis_label_count :
int - x_axis_display_values_indices :
tuple[int, ...] - x_axis_data :
any - y_axis_data :
any - x_axis_values :
tuple(any, ...)- ("2020 Year", "2021 Year", "2022 Year", "2023 Year", "2024 Year")
- (0.1, 0.2, 0.3, 0.4, 0.5)
- y_axis_values :
tuple(int | float, int | float)- (0 ,1000)
- (-1000, 1000)
- y_axis_precision :
int - pointing_values_precision :
int y_axis_max_value: Deprecated
Color Configuration
- bg_color :
str - fg_color :
str - axis_color :
str - x_axis_font_color :
str- "#ffffff"
- "white"
- y_axis_font_color :
str - x_axis_data_font_color :
str - y_axis_data_font_color :
str - y_axis_section_color :
str - x_axis_section_color :
str - pointer_color :
str section_color: Deprecated
Font Configuration
- data_font_style :
tuple[str, int, str]- ("arial", 10, "bold")
- ("arial", 20, "normal")
- axis_font_style :
tuple
Style Configuration
- x_axis_data_position :
str- "top"
- "side"
- y_axis_data_position :
str - x_axis_section_style :
str- "normal"
- "dashed"
- y_axis_section_style :
str - x_axis_section_style_type :
tuple(int, int)- (50, 10)
- (10, 10)
- y_axis_section_style_type :
tuple(int, int)
Data Retrieval Configuration
- pointing_callback_function :
function- function_name(*args)
- function_name(x ,y)
- pointer_state :
str- "enabled"
- "disabled"
- pointer_lock :
str- "enabled"
- "disabled"
Recent Changes
-
y_axis_max_value :Deprecatedint | float-
replaced with y_axis_values :
tuple(int | float, int | float)The y_axis_values parameter is a tuple where the value at index 0 represents the starting value of the Y-axis, and the value at index 1 represents the ending value of the Y-axis.
-
-
section_color :Deprecatedstr- replaced with x_axis_section_color :
str - replaced with y_axis_section_color :
str
- replaced with x_axis_section_color :
- master :
-
Methods
-
configure :
use to change LineChart attributesSupport parameters
- width
- height
- axis_size
- x_space
- y_space
- line_width
- pointer_size
- x_axis_section_count
- y_axis_section_count
- x_axis_label_count
- y_axis_label_count
- x_axis_display_values_indices
- x_axis_data
- y_axis_data
- x_axis_values
- y_axis_values
- y_axis_precision
- pointing_values_precision
- bg_color
- fg_color
- axis_color
- x_axis_font_color
- y_axis_font_color
- x_axis_data_font_color
- y_axis_data_font_color
- y_axis_section_color
- x_axis_section_color
- pointer_color
- data_font_style
- axis_font_style
- x_axis_data_position
- y_axis_data_position
- x_axis_section_style
- y_axis_section_style
- x_axis_section_style_type
- y_axis_section_style_type
- pointing_callback_function
- pointer_state
- pointer_lock
y_axis_max_value: Removedsection_color: Removed
-
show_data :
use to display dataSupport parameters
- data :
tuple - line :
tkchart.Line
- data :
-
place :
use to place LineChartSupport parameters
- x
- y
- rely
- relx
- anchor
-
pack :
use to pack LineChartSupport parameters
- pady
- padx
- before
- after
- side
- anchor
-
grid :
use to grid LineChartSupport parameters
- column
- columnspan
- padx
- pady
- row
- rowspan
- sticky
-
place_forget :
use to place forget the chart -
pack_forget :
use to pack forget the chart -
grid_forget :
use to grid forget the chart -
place_back :
use to place chart in the old location after place forget -
pack_back :
use to pack chart in the old location after pack forget -
grid_back :
use to grid chart in the old location after grid forget -
hide_all :
use to hide all the linesSupport parameters
- state :
bool
- state :
-
hide :
use to hide a specific lineSupport parameters
- line :
tkchart.Line - state :
bool
- line :
-
reset :
use to reset chart
-
linechart = tkchart.LineChart(master=root,
                            width=800,
                            height=400,
                            axis_size=5
                        )
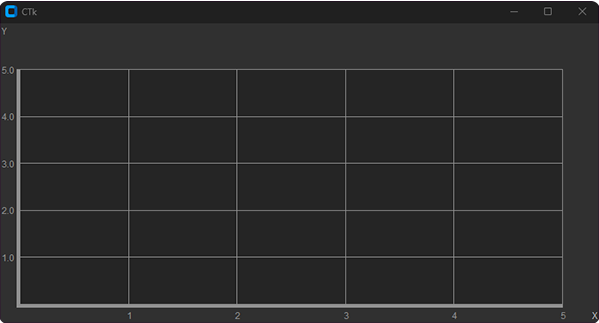
linechart = tkchart.LineChart(master=root,
                            width=800,
                            height=400,
                            axis_size=5,

                            y_axis_section_count=5,
                            x_axis_section_count=5,
                            y_axis_label_count=5,
                        )
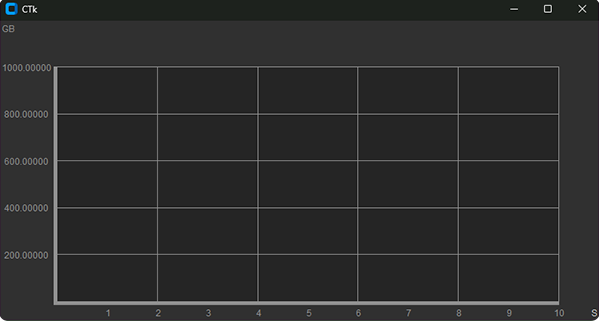
linechart = tkchart.LineChart(master=root,
width=800,
height=400,
axis_size=5,
y_axis_section_count=5,
x_axis_section_count=5,
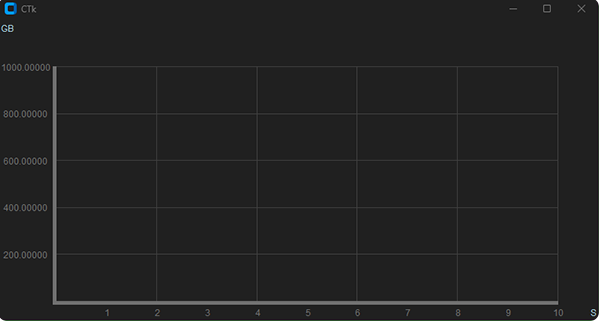
y_axis_label_count=5,
x_axis_label_count=10,
y_axis_data="GB",
x_axis_data="S",
x_axis_values=(1, 2, 3, 4, 5, 6, 7, 8, 9, 10),
y_axis__max_value=(0, 1000),
y_axis_precision=5
)
linechart = tkchart.LineChart(master=root,
width=800,
height=400,
axis_size=5,
y_axis_section_count=5,
x_axis_section_count=5,
y_axis_label_count=5,
x_axis_label_count=10,
y_axis_data="GB",
x_axis_data="S",
x_axis_values=(1, 2, 3, 4, 5, 6, 7, 8, 9, 10),
y_axis__max_value=(0, 1000),
y_axis_precision=5
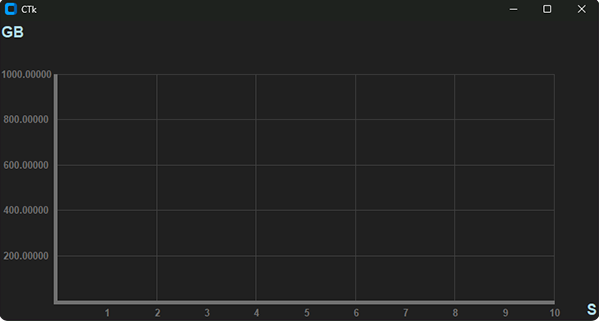
x_axis_section_color="#404040",
y_axis_section_color="#404040",
x_axis_font_color="#707070",
y_axis_font_color="#707070",
x_axis_data_font_color="lightblue",
y_axis_data_font_color="lightblue",
bg_color="#202020",
fg_color="#202020",
axis_color="#707070"
)
linechart = tkchart.LineChart(master=root,
width=800,
height=400,
axis_size=5,
y_axis_section_count=5,
x_axis_section_count=5,
y_axis_label_count=5,
x_axis_label_count=10,
y_axis_data="GB",
x_axis_data="S",
x_axis_values=(1, 2, 3, 4, 5, 6, 7, 8, 9, 10),
y_axis__max_value=(0, 1000),
y_axis_precision=5
x_axis_section_color="#404040",
y_axis_section_color="#404040",
x_axis_font_color="#707070",
y_axis_font_color="#707070",
x_axis_data_font_color="lightblue",
y_axis_data_font_color="lightblue",
bg_color="#202020",
fg_color="#202020",
axis_color="#707070"
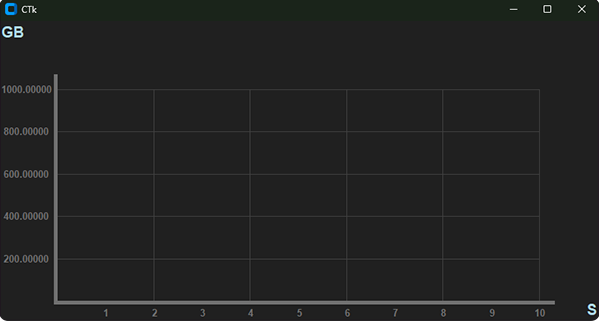
data_font_style=("Arial", 15, "bold"),
axis_font_style=("Arial", 10, "bold")
)
linechart = tkchart.LineChart(master=root,
                            width=800,
                            height=400,
                            axis_size=5,

                            y_axis_section_count=5,
                            x_axis_section_count=5,
                            y_axis_label_count=5,
                            x_axis_label_count=10,

                            y_axis_data="GB",
                            x_axis_data="S",
                            x_axis_values=(1, 2, 3, 4, 5, 6, 7, 8, 9, 10),
                            y_axis__max_value=(0, 1000),
                            y_axis_precision=5

                            x_axis_section_color="#404040",
                            y_axis_section_color="#404040",
                            x_axis_font_color="#707070",
                            y_axis_font_color="#707070",
                            x_axis_data_font_color="lightblue",
                            y_axis_data_font_color="lightblue",
                            bg_color="#202020",
                            fg_color="#202020",
                            axis_color="#707070"

                            data_font_style=("Arial", 15, "bold"),
                            axis_font_style=("Arial", 10, "bold"),

                            x_space=20,
                            y_space=20
                        )
linechart = tkchart.LineChart(master=root,
width=800,
height=400,
axis_size=5,
y_axis_section_count=5,
x_axis_section_count=5,
y_axis_label_count=5,
x_axis_label_count=10,
y_axis_data="GB",
x_axis_data="S",
x_axis_values=(1, 2, 3, 4, 5, 6, 7, 8, 9, 10),
y_axis__max_value=(0, 1000),
y_axis_precision=5
x_axis_section_color="#404040",
y_axis_section_color="#404040",
x_axis_font_color="#707070",
y_axis_font_color="#707070",
x_axis_data_font_color="lightblue",
y_axis_data_font_color="lightblue",
bg_color="#202020",
fg_color="#202020",
axis_color="#707070"
data_font_style=("Arial", 15, "bold"),
axis_font_style=("Arial", 10, "bold"),
x_space=20,
y_space=20,
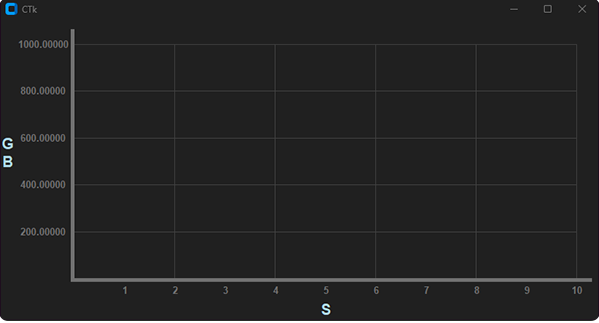
x_axis_data_position="side",
y_axis_data_position="side"
)
linechart.pack()
2 . Creating a Line
line = tkchart.Line()
-
Attributes & Types & Values
- master :
tkchart.LineChart - color :
str- "white"
- "#10f0f0"
- size :
int - style :
str- "normal"
- "dashed"
- "dotted"
- style_type :
tuple(int, int)- (5,10)
- (10,5)
- point_highlight:
str- "disabled"
- "enabled"
- point_highlight_size:
int - point_highlight_color:
str
- master :
-
Methods
-
configure :
Support parametersuse to change Line attributes- size
- color
- style
- style_type
- point_highlight
- point_highlight_size
- point_highlight_color
-
line = tkchart.Line(master=linechart,
                color="lightblue",
                size=2,
                style="dashed",
                style_type=(4,10))

3 . Display of Data
import customtkinter
import tkchart
import random

root = customtkinter.CTk()

linechart = tkchart.LineChart(master=root,
                            width=800,
                            height=400,
                            axis_size=5,

                            y_axis_section_count=5,
                            x_axis_section_count=5,
                            y_axis_label_count=5,
                            x_axis_label_count=10,

                            y_axis_data="GB",
                            x_axis_data="S",
                            x_axis_values=(1, 2, 3, 4, 5, 6, 7, 8, 9, 10),
                            y_axis_values=(0, 1000),
                            y_axis_precision=5,

                            x_axis_section_color="#404040",
                            y_axis_section_color="#404040",
                            x_axis_font_color="#707070",
                            y_axis_font_color="#707070",
                            x_axis_data_font_color="lightblue",
                            y_axis_data_font_color="lightblue",
                            bg_color="#202020",
                            fg_color="#202020",
                            axis_color="#707070",

                            data_font_style=("Arial", 15, "bold"),
                            axis_font_style=("Arial", 10, "bold"),

                            x_space=20,
                            y_space=20,

                            x_axis_data_position="side",
                            y_axis_data_position="side"
                        )
linechart.pack()


line = tkchart.Line(master=linechart,
                    color="lightblue",
                    size=2,
                    style="dashed",
                    style_type=(4, 10))

data = [0, 100, 200, 300, 400, 500, 600, 700, 800, 900, 1000]
def loop():
    linechart.show_data(data=tuple([random.choice(data)]), line=line)
    root.after(250, loop)
loop()

root.mainloop()
https://github.com/Thisal-D/tkchart/assets/93121062/ec29a3f4-7eba-40c5-9f5c-cc7071ff40ff
Examples
go to PyPi
-
PyPi.org : tkchart
go to GitHub
-
GitHub.com : tkchart
Whats New ?
Go to top
Contributing to tkchart
Thank you for considering contributing to tkchart! Please follow these guidelines to contribute effectively.
Getting Started
- Fork the repository.
- Clone your forked repository:
git clone https://github.com/Thisal-D/tkchart.git - Create a new branch for your changes:
git checkout -b feature-branch
Making Changes
- Make your changes and ensure they follow the project's coding standards.
- Test your changes locally.
- Commit your changes:
git commit -m "Brief description of your changes"
Submitting Changes
- Push your changes to your forked repository:
git push origin feature-branch - Create a pull request on the main repository.
Code of Conduct
Please adhere to the Code of Conduct to maintain a respectful and inclusive community.
Issues and Discussions
If you encounter issues or have questions, please check the issue tracker or start a discussion in the GitHub Discussions section.
License
By contributing, you agree that your contributions will be licensed under the project's LICENSE.
Thank you for your contribution!
Contributing to tkchart
Go to top
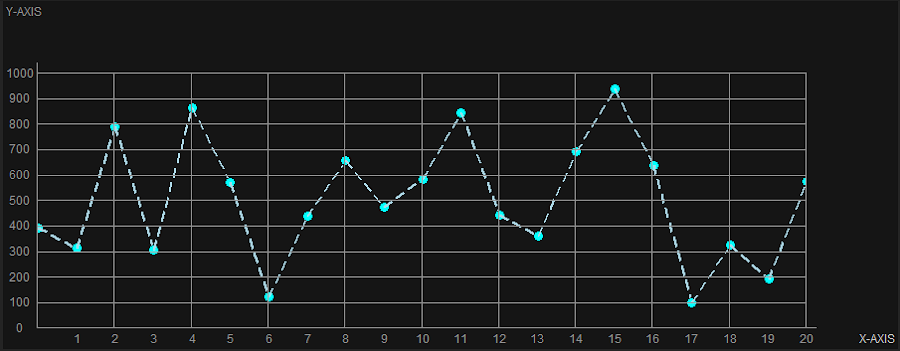
Whats New
Added new parameters to Line object
Try on : Tests/Main - Test.py
- point_highlight:
str - point_highlight_size:
int - point_highlight_color:
str
:: before
:: after
- point_highlight = "enabled"
- point_highlight_size = 10
- point_highlight_color = "#00FFFF"
Release history Release notifications | RSS feed


Download files
Download the file for your platform. If you're not sure which to choose, learn more about installing packages.
Source Distribution
Built Distribution
Filter files by name, interpreter, ABI, and platform.
If you're not sure about the file name format, learn more about wheel file names.
Copy a direct link to the current filters
File details
Details for the file tkchart-1.4.0.tar.gz.
File metadata
- Download URL: tkchart-1.4.0.tar.gz
- Upload date:
- Size: 23.5 kB
- Tags: Source
- Uploaded using Trusted Publishing? No
- Uploaded via: twine/5.0.0 CPython/3.12.1
File hashes
| Algorithm | Hash digest | |
|---|---|---|
| SHA256 |
6d7014402f46b2e85bbaa6a238563ff837bb03ce50d80a182e57b93b8a795841
|
|
| MD5 |
02a017ae48a57b0984d73aea93959214
|
|
| BLAKE2b-256 |
c6ae95e71b6496e5db9afba5d8d692169db8b5efd33c86c6bc4d8b971b6f7be3
|
File details
Details for the file tkchart-1.4.0-py3-none-any.whl.
File metadata
- Download URL: tkchart-1.4.0-py3-none-any.whl
- Upload date:
- Size: 19.1 kB
- Tags: Python 3
- Uploaded using Trusted Publishing? No
- Uploaded via: twine/5.0.0 CPython/3.12.1
File hashes
| Algorithm | Hash digest | |
|---|---|---|
| SHA256 |
e8b94b0e3928c5474840c8a734fb0596073b94b53082f046f4787f5b7200154a
|
|
| MD5 |
f73c2c363ba561028978e08925a37619
|
|
| BLAKE2b-256 |
75d9d55e52fccb3d71c427f3e751e0646ee18376c3c3bd89b33f0a8d2f123c81
|


