GUI to plot the results of a topas simulation
Project description
topasgraphsim
Am interface to automatically plot and interpret the results of TOPAS simulations
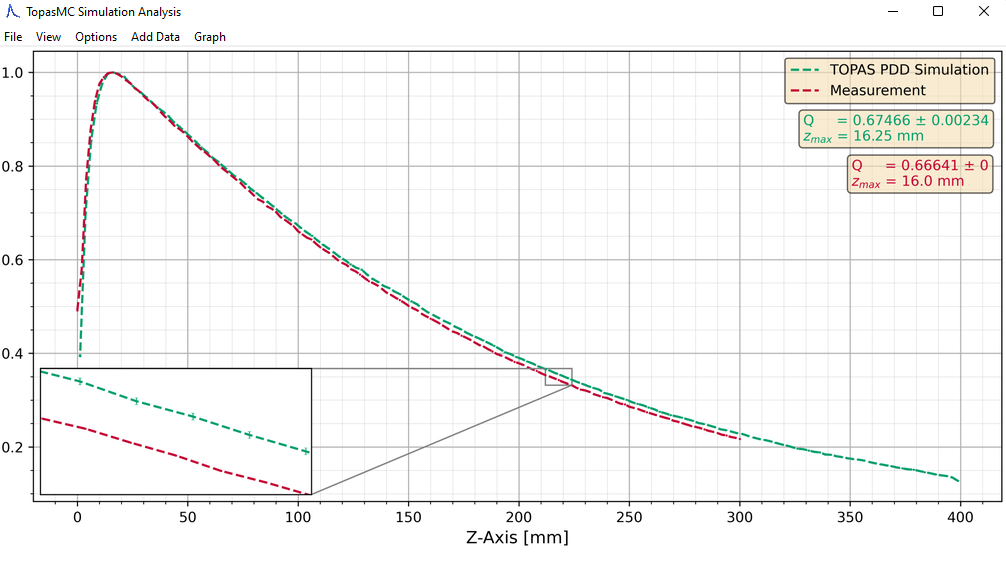
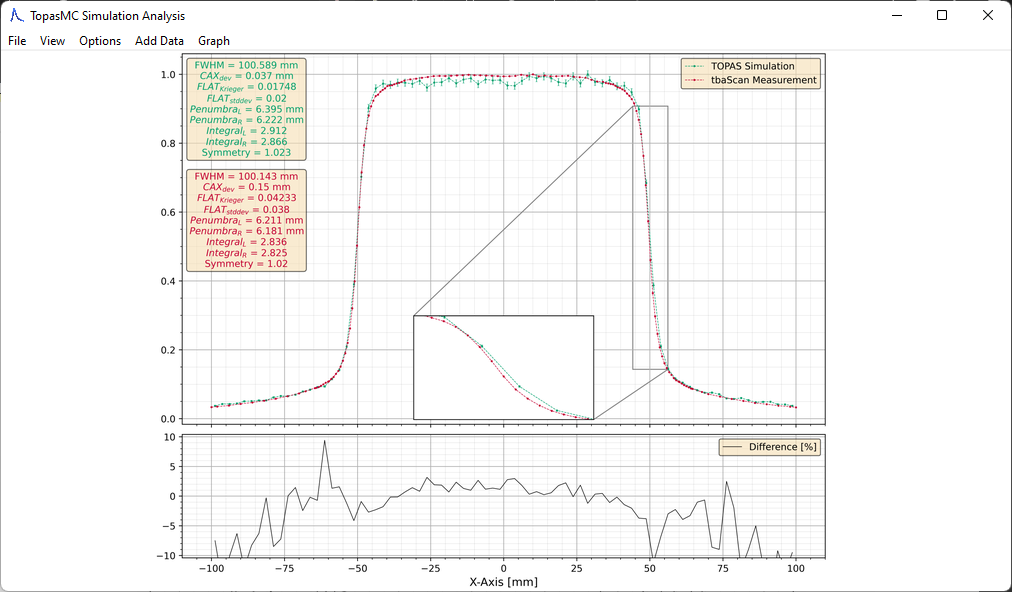
This GUI can visualize and analyze percentage depth dose (pdd) and dose profiles (dp) simulations from TOPAS. Depth dose measurements are assumed to be in the z-direction, dose profiles in the x- or y-directions. Data read-in is handled by topas2numpy.
Features
- Reproducible graphing and analysis of TOPAS simulation for medical physics
- Simultaneous plotting and parameter calculation for up to 5 datasets
- Graph adjustment options
- Normalization (On/Off)
- Error bars (On/Off)
- Difference plot between two datasets
- Graph order and colors
- Marker size
- Line width
- Zoom-in window
- Half view of dose profiles
- Center axis deviation correction
- Import of EGS simulation results
- Import of custom measurements (as numpy .txt files)
- Import of PTW tbaScan (MEPHYSTO mc2) measurements
- Easy to use keyboard shortcuts (see manual below)
- German and english language support
- Dark mode
Screenshots
Manual
Most customization options are available via the menubar, however the workflow can be sped up greatly by using the included keyboard and mouse shortcuts documented below.
Loading and saving data
| Keyboard Shortcut | Associated Function |
|---|---|
| Ctrl + O | Open a TOPAS simulation file [*.csv *.bin] |
| Ctrl + P | Open a PTW tbaScan file [*.mcc] |
| Ctrl + T | Open a PDD measurement file [*.txt] |
| Ctrl + D | Open a DP measurement file [*.txt] |
| Ctrl + S | Save the current graph [*.png *.jpg] |
| Ctrl + Z | Remove the last imported dataset |
| Escape | Close the current project |
Adjusting the Graph Style
| Mouse/Keyboard Shortcut | Associated Function |
|---|---|
| Ctrl + ↑ ↓ | Increase/decrease the marker size |
| Ctrl + ← → | Increase/decrease the line width |
| Scrollwheel | Increase/decrease the X-axis limits |
| Ctrl + + - | Increase/decrease the error plot limits |
| Double Left Click on Graph | Change zoom window location |
Adjusting the Graph Legend
| Mouse/Keyboard Shortcut | Associated Function |
|---|---|
| Hover over Graph Name + ↑ ↓ | Change the graph order |
| Left Click on Graph Name | Rename the selected graph |
| Right Click on Graph Name | Change color of the selected graph |
Installation
Install using pip:
$ pip install topasgraphsim
Then, start the GUI by running:
$ python -m topasgraphsim
Or, if your Python is added to $PATH, simply run:
$ topasgraphsim
Parameters
Depending on the imported measurement, the following parameters can be calculated:
| Measurement type | Parameters | |||||
|---|---|---|---|---|---|---|
| Depth dose | Q-Factor | zmax | ||||
| Dose profile | FWHM | CAXdev | FLATKrieger | FLATstddev | Penumbra (L&R) | Integral (L&R) |
-
Q-Factor : Radiation Quality Factor
-
zmax : Depth at Maximum
-
FWHM : Full-Width at Half-Maximum
-
CAXdev : Centre Axis Deviation
-
FLATKrieger : Flatness of Dose Plateau (Definition by Krieger)
-
FLATstddev : Flatness of Dose Plateau (Standard Deviation)
-
Penumbra (L&R) : Width of Left and Right Penumbra
-
Integral (L&R) : Integral below Left and Right Penumbra
Dependencies
Built using the beautiful Azure-ttk theme by @rdbende. Requires python3, numpy, scipy, matplotlib, Pillow, python-opencv, pynput, topas2numpy and tkinter.
Note: Linux users need to have python3-tk installed. If it isnt installed yet, use:
sudo apt-get install python3-tk
Project details
Release history Release notifications | RSS feed
Download files
Download the file for your platform. If you're not sure which to choose, learn more about installing packages.
Source Distribution
Built Distribution
Hashes for topasgraphsim-15.0.4-py3-none-any.whl
| Algorithm | Hash digest | |
|---|---|---|
| SHA256 | adc619495450936ab6214faf1ade8a92f4cda41a78f24e8b196ca33acf3d9da0 |
|
| MD5 | dff10afff8e3b21b3ff9efa1d853311e |
|
| BLAKE2b-256 | 714eca1b2f9e03bdffa5d7d4f9e84a2d77e5e8d906b40d96ea3636f7b0953fbc |


