
TraceML: Lightweight ML Profiler

Project description
TraceML
Always-on, live observability and failure attribution for distributed PyTorch training (Alpha)





TraceML is a lightweight runtime observability tool for distributed PyTorch training.
It makes training behavior visible while it runs using semantic, step-level signals that are typically missing from infrastructure metrics and too expensive to keep enabled with full profilers.
Status: Alpha
Current focus: single-node DDP stability, signal accuracy, and overhead optimization (Python/GIL behavior, communication paths, synchronization strategy, and UI/collector performance).
Multi-node distributed training (DDP/FSDP) is planned.
Why TraceML
Training deep learning models often becomes a black box once you scale beyond toy workloads.
Common pain points:
- Slow / unstable steps without knowing whether the bottleneck is dataloader, compute, communication, or optimizer
- CUDA OOM errors with limited attribution to the responsible layer
- Layer-level opacity: unclear memory and compute hotspots
- Heavy profilers that are too intrusive to keep enabled during real training
TraceML is designed to be always-on, giving you actionable attribution during long-running jobs.
What TraceML Shows (Core Signals)
TraceML focuses on the signals you actually debug with:
Step-aware signals (synchronized across ranks)
For each training step (in single-node DDP):
- Dataloader fetch time
- Training step time (GPU-aware via CUDA events)
- Step GPU memory (allocated + peak)
Across ranks, TraceML reports:
- Median rank (typical behavior)
- Worst rank (straggler / bottleneck)
This makes it easy to catch cases like “8 GPUs slower than 1” as it happens, and understand whether you’re bottlenecked by input pipeline, compute, or rank-level stragglers.
Failure attribution
- OOM attribution (Deep-Dive mode): surface the layer most likely responsible during forward/backward
What TraceML Is Not
TraceML is not an auto-tuner or a profiler replacement.
- It does not automatically optimize your batch size
- It does not always “find a problem”
- It does not replace Nsight or PyTorch Profiler
Instead, TraceML answers a more basic question:
“Which part of my training step is responsible for what I’m seeing — or is everything behaving normally?”
If your run is healthy, TraceML will tell you that explicitly.
Views
TraceML supports two ways to consume runtime signals:
- 🖥️ Terminal dashboard — live updates in your console
- 🌐 Web dashboard — local browser at
http://localhost:8765
Note: Notebook is temporarily disabled in alpha
Tracking Profiles
TraceML provides two tracking profiles so you can choose the right trade-off between insight and overhead.
ESSENTIAL mode (always-on runtime signals)
Designed for day-to-day training and long-running jobs.
Tracks:
- Dataloader fetch time
- Training step time (GPU-aware)
- Step-level GPU memory (allocated and peak)
- System metrics (CPU, RAM, GPU)
- Basic failure signals
This mode is intended to run continuously during real training.
DEEP-DIVE mode (diagnostic)
Designed for performance pathology debugging and OOM investigations.
Includes everything in ESSENTIAL, plus:
- Per-layer memory (parameters, activations, gradients)
- Per-layer forward and backward compute time
- OOM layer attribution (forward/backward)
Installation
pip install traceml-ai
For development:
git clone https://github.com/traceopt-ai/traceml.git
cd traceml
pip install -e '.[dev]'
Requirements: Python 3.9–3.13, PyTorch 1.12+
Platform support: macOS (Intel/ARM), Linux
Training support: Single GPU and single-node DDP (alpha)
Quick Start
1) Step-level tracking (required)
TraceML computes step timing / memory only inside a trace_step() scope.
from traceml.decorators import trace_step

for batch in dataloader:
    with trace_step(model):
        outputs = model(batch["x"])
        loss = criterion(outputs, batch["y"])
        loss.backward()
        optimizer.step()
        optimizer.zero_grad(set_to_none=True)
Without trace_step():
- Step timing is not computed
- Step memory is not recorded
- Live dashboards will not update
2) Optional: Time specific code regions
Use @trace_time to time specific functions.
This works in all modes and is designed to have low overhead.
from traceml.decorators import trace_time

@trace_time("backward", use_gpu=True)
def backward_pass(loss):
    loss.backward()
Notes:
use_gpu=Trueuses CUDA events (correct for async GPU work)use_gpu=Falseuses CPU wall-clock time
Deprecation (Breaking change)
@trace_timestepis deprecated — use@trace_timeinstead
3) Deep-Dive: model registration (only for Deep-Dive)
from traceml.decorators import trace_model_instance

trace_model_instance(model)
Enables forward/backward hooks required for:
- per-layer memory and timing (layerwise worst across ranks)
- OOM layer attribution (experimental, work-in-progress)
Running TraceML
traceml run train.py --nproc-per-node=2
You’ll see a live terminal dashboard tracking:
- System resources (CPU, RAM, GPU)
- Dataloader fetch time, step time, step GPU memory
- (Deep-Dive only) per-layer memory + compute time
Tip: for DDP, run TraceML on rank 0 and collect rank signals via the TraceML runtime.
Web Dashboard
traceml run train.py --nproc-per-node=2 --mode=dashboard
Opens http://localhost:8765 with interactive charts and real-time updates.
Roadmap
TraceML prioritizes clear attribution and low overhead over exhaustive tracing.
Near-term:
- Optimize single-node DDP: reduce overhead, improve rank synchronization accuracy, improve comm + GIL behavior
- Broaden workload coverage: validated examples + benchmarks for representative workloads:
- CV (e.g., ResNet / ViT)
- NLP / LLM fine-tuning (e.g., BERT / small decoder models)
- Diffusion / vision-language (as time permits)
- Documentation improvements: clearer docs + examples (targeting beta)
Next:
- Multi-node distributed support (DDP → FSDP)
- Integrations: PyTorch Lightning / Hugging Face Accelerate (as optional wrappers)
- Advanced diagnostics: leak detection, regression attribution, and automated “why is my step slower?” summaries
Contributing
Contributions are welcome.
- ⭐ Star the repo
- 🐛 Report bugs via GitHub Issues
- 💡 Request features / workloads you want supported
- 🔧 Submit PRs (small focused PRs are ideal)
If you hit an issue, please open a GitHub Issue with:
- minimal repro script
- hardware + CUDA + PyTorch versions
- whether you used ESSENTIAL or DEEP-DIVE
- single GPU vs DDP
We’ll try to respond and resolve quickly.
Community & Support
- 📧 Email: abhinav@traceopt.ai
- 🐙 LinkedIn: Abhinav Srivastav
- 📋 User Survey: Help shape the roadmap (2 minutes) https://forms.gle/KwPSLaPmJnJjoVXSA
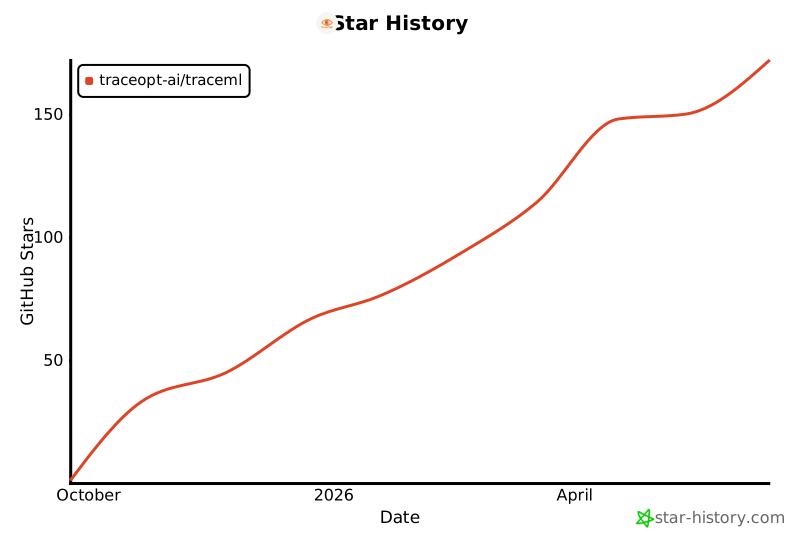
- Stars help the project grow and makes it easier for other to find our work.🌟
 ---
---
License
TraceML is released under the MIT License with Commons Clause.
Summary:
- ✅ Free for personal use
- ✅ Free for research and academic use
- ✅ Free for internal company use
- ❌ Not allowed for resale or SaaS products
See LICENSE for full details.
For commercial licensing, contact: abhinav@traceopt.ai
Citation
If TraceML helps your research, please cite:
@software{traceml2024,
  author = {TraceOpt AI},
  title = {TraceML: Real-time Training Observability for PyTorch},
  year = {2024},
  url = {https://github.com/traceopt-ai/traceml}
}
TraceML — Stop guessing. Start attributing.
Made with ❤️ by TraceOpt AI
Release history Release notifications | RSS feed


Download files
Download the file for your platform. If you're not sure which to choose, learn more about installing packages.
Source Distribution
Built Distribution
Filter files by name, interpreter, ABI, and platform.
If you're not sure about the file name format, learn more about wheel file names.
Copy a direct link to the current filters
File details
Details for the file traceml_ai-0.2.0a0.tar.gz.
File metadata
- Download URL: traceml_ai-0.2.0a0.tar.gz
- Upload date:
- Size: 104.3 kB
- Tags: Source
- Uploaded using Trusted Publishing? No
- Uploaded via: twine/6.2.0 CPython/3.9.23
File hashes
| Algorithm | Hash digest | |
|---|---|---|
| SHA256 |
f0fa5983e0ad3a831dbe51cf9c8a269c245d52c97b0a4f6f59a660e2b8ed8666
|
|
| MD5 |
cc50781a8957bc1c7ee853d9277c2c4e
|
|
| BLAKE2b-256 |
47d2bd6b4187cac0ec6d7f2efb4bd5424ed29aee84ea9ccfdd19d9e86631fad5
|
File details
Details for the file traceml_ai-0.2.0a0-py3-none-any.whl.
File metadata
- Download URL: traceml_ai-0.2.0a0-py3-none-any.whl
- Upload date:
- Size: 142.5 kB
- Tags: Python 3
- Uploaded using Trusted Publishing? No
- Uploaded via: twine/6.2.0 CPython/3.9.23
File hashes
| Algorithm | Hash digest | |
|---|---|---|
| SHA256 |
5e90fb3cebaa34ce9a552a1d52a5a1a9750509b2bf7f315e11c8df5b78b259b5
|
|
| MD5 |
71c21cc332068b57c71b3ec2a416b03d
|
|
| BLAKE2b-256 |
ce316def01a1fedc597eb3fc8769aa4f9b28dcdc861e629c8ff6be4fd086e7fe
|






