Terminal-based dashboard for TrackIO experiment tracking

Project description
TrackIO View
Terminal-based dashboard for TrackIO experiment tracking. Monitor your machine learning experiments directly from the command line with beautiful, real-time visualizations and GPU monitoring.
Background
TrackIO View was originally developed as an enhancement to the main TrackIO project. Following feedback from the TrackIO maintainers who appreciated the functionality but felt it was out of scope for the core lightweight tracking library, this has been extracted into a standalone package:
"This is very cool @mcgrof but is a bit out of scope and will be hard for us to maintain. Trackio is designed to be pretty lightweight and extensible so I'd recommend instead creating a separate trackio-view pypi package which we could link to from our documentation."
This allows TrackIO to remain focused on its core mission while providing users with a powerful, optional terminal-based monitoring tool. The original implementation can be found in the TrackIO repository on branch 20250921-trackio-view.
Features
- 📊 Real-time Metrics Display: Monitor training progress with live-updating terminal dashboard
- 📈 ASCII Graphs: Beautiful gradient-colored graphs for loss, accuracy, and custom metrics
- 🖥️ GPU Monitoring: Comprehensive GPU hardware monitoring (NVIDIA, AMD, Intel)
- 🔍 Interactive Zoom: Zoom in/out to examine different portions of training history
- 🎨 Color-Coded Feedback: Intuitive color gradients for quick performance assessment
- 🌐 Remote-Friendly: Perfect for monitoring training on remote servers via SSH
- ⚡ Lightweight: Minimal resource usage compared to web dashboards
- 🔧 Flexible: Works with or without the
richlibrary for enhanced visuals
Installation
pip install trackio-view
For enhanced terminal graphics (recommended):
pip install trackio-view[rich]
For NVIDIA GPU monitoring support:
pip install trackio-view[nvidia]
Install all optional dependencies:
pip install trackio-view[all]
Quick Start
Monitor Training Metrics
Start your training with TrackIO:
import trackio

trackio.init(project="my-experiment")

for epoch in range(num_epochs):
    for batch in dataloader:
        loss = train_step(batch)
        trackio.log({"loss": loss, "epoch": epoch})

trackio.finish()
In another terminal, launch the dashboard:
trackio-view --project my-experiment
Monitor GPU Hardware
# Real-time GPU monitoring
trackio-view --gpu

# Quick GPU status check
trackio-view --gpu --once
View Logged GPU Metrics
If you logged GPU metrics during training:
trackio.init(project="my-training", log_gpu=True)
View them later:
# Display GPU database metrics once
trackio-view --gpu-db --project my-training --once

# Live monitoring of GPU database
trackio-view --gpu-db --project my-training
Usage
Command Line Options
trackio-view [OPTIONS]

Options:
  -p, --project TEXT     Project name to monitor
  -i, --interval INT     Update interval in seconds (default: 2)
  --once                 Display once and exit (no live monitoring)
  --gpu                  Show live GPU hardware metrics
  --gpu-db               Show GPU metrics from database (requires --project)
  -z, --zoom {0,1,2,3,4} Initial zoom level (0=all, 1=500, 2=200, 3=100, 4=50)
  --list                 List all available TrackIO projects
  --delete PROJECT       Delete a TrackIO project by name
  --force                Force deletion without confirmation (use with --delete)
  -h, --help            Show help message
Interactive Controls (Live Mode)
- Press
+: Zoom in (show fewer, more recent iterations) - Press
-: Zoom out (show more training history) - Press
q: Quit - Number keys (0-9): Switch between GPUs (in GPU mode)
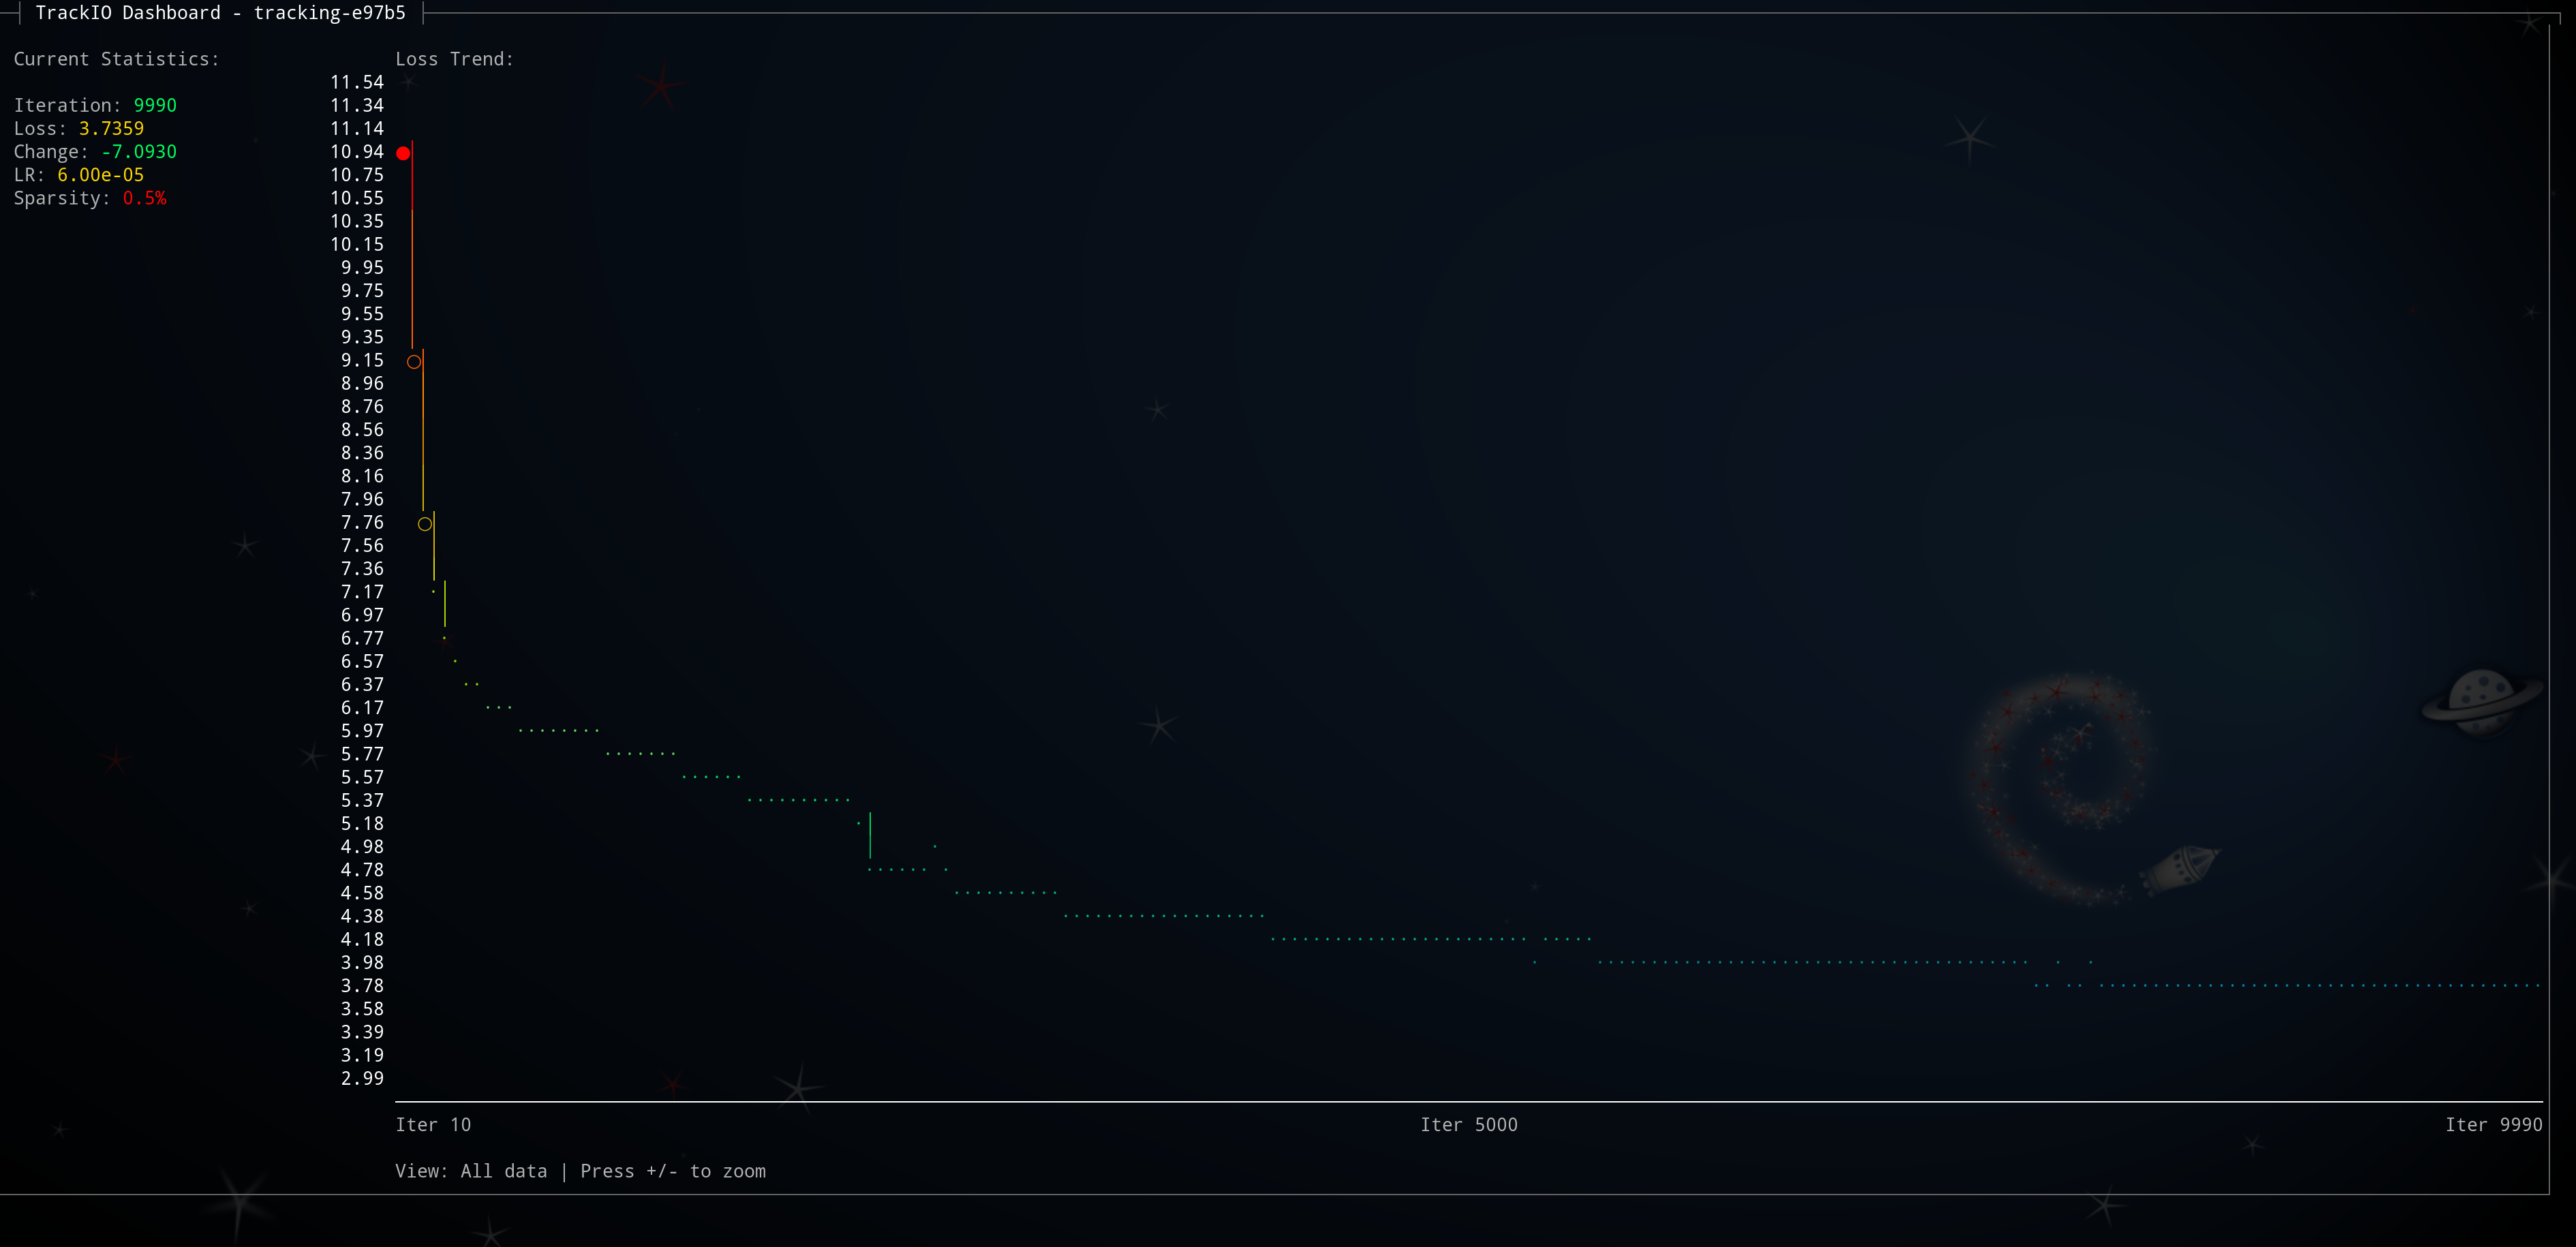
Zoom Visualization
The interactive zoom feature lets you explore different time scales of your training. Press + to zoom in (see fewer, more recent iterations) and - to zoom out (see more history).
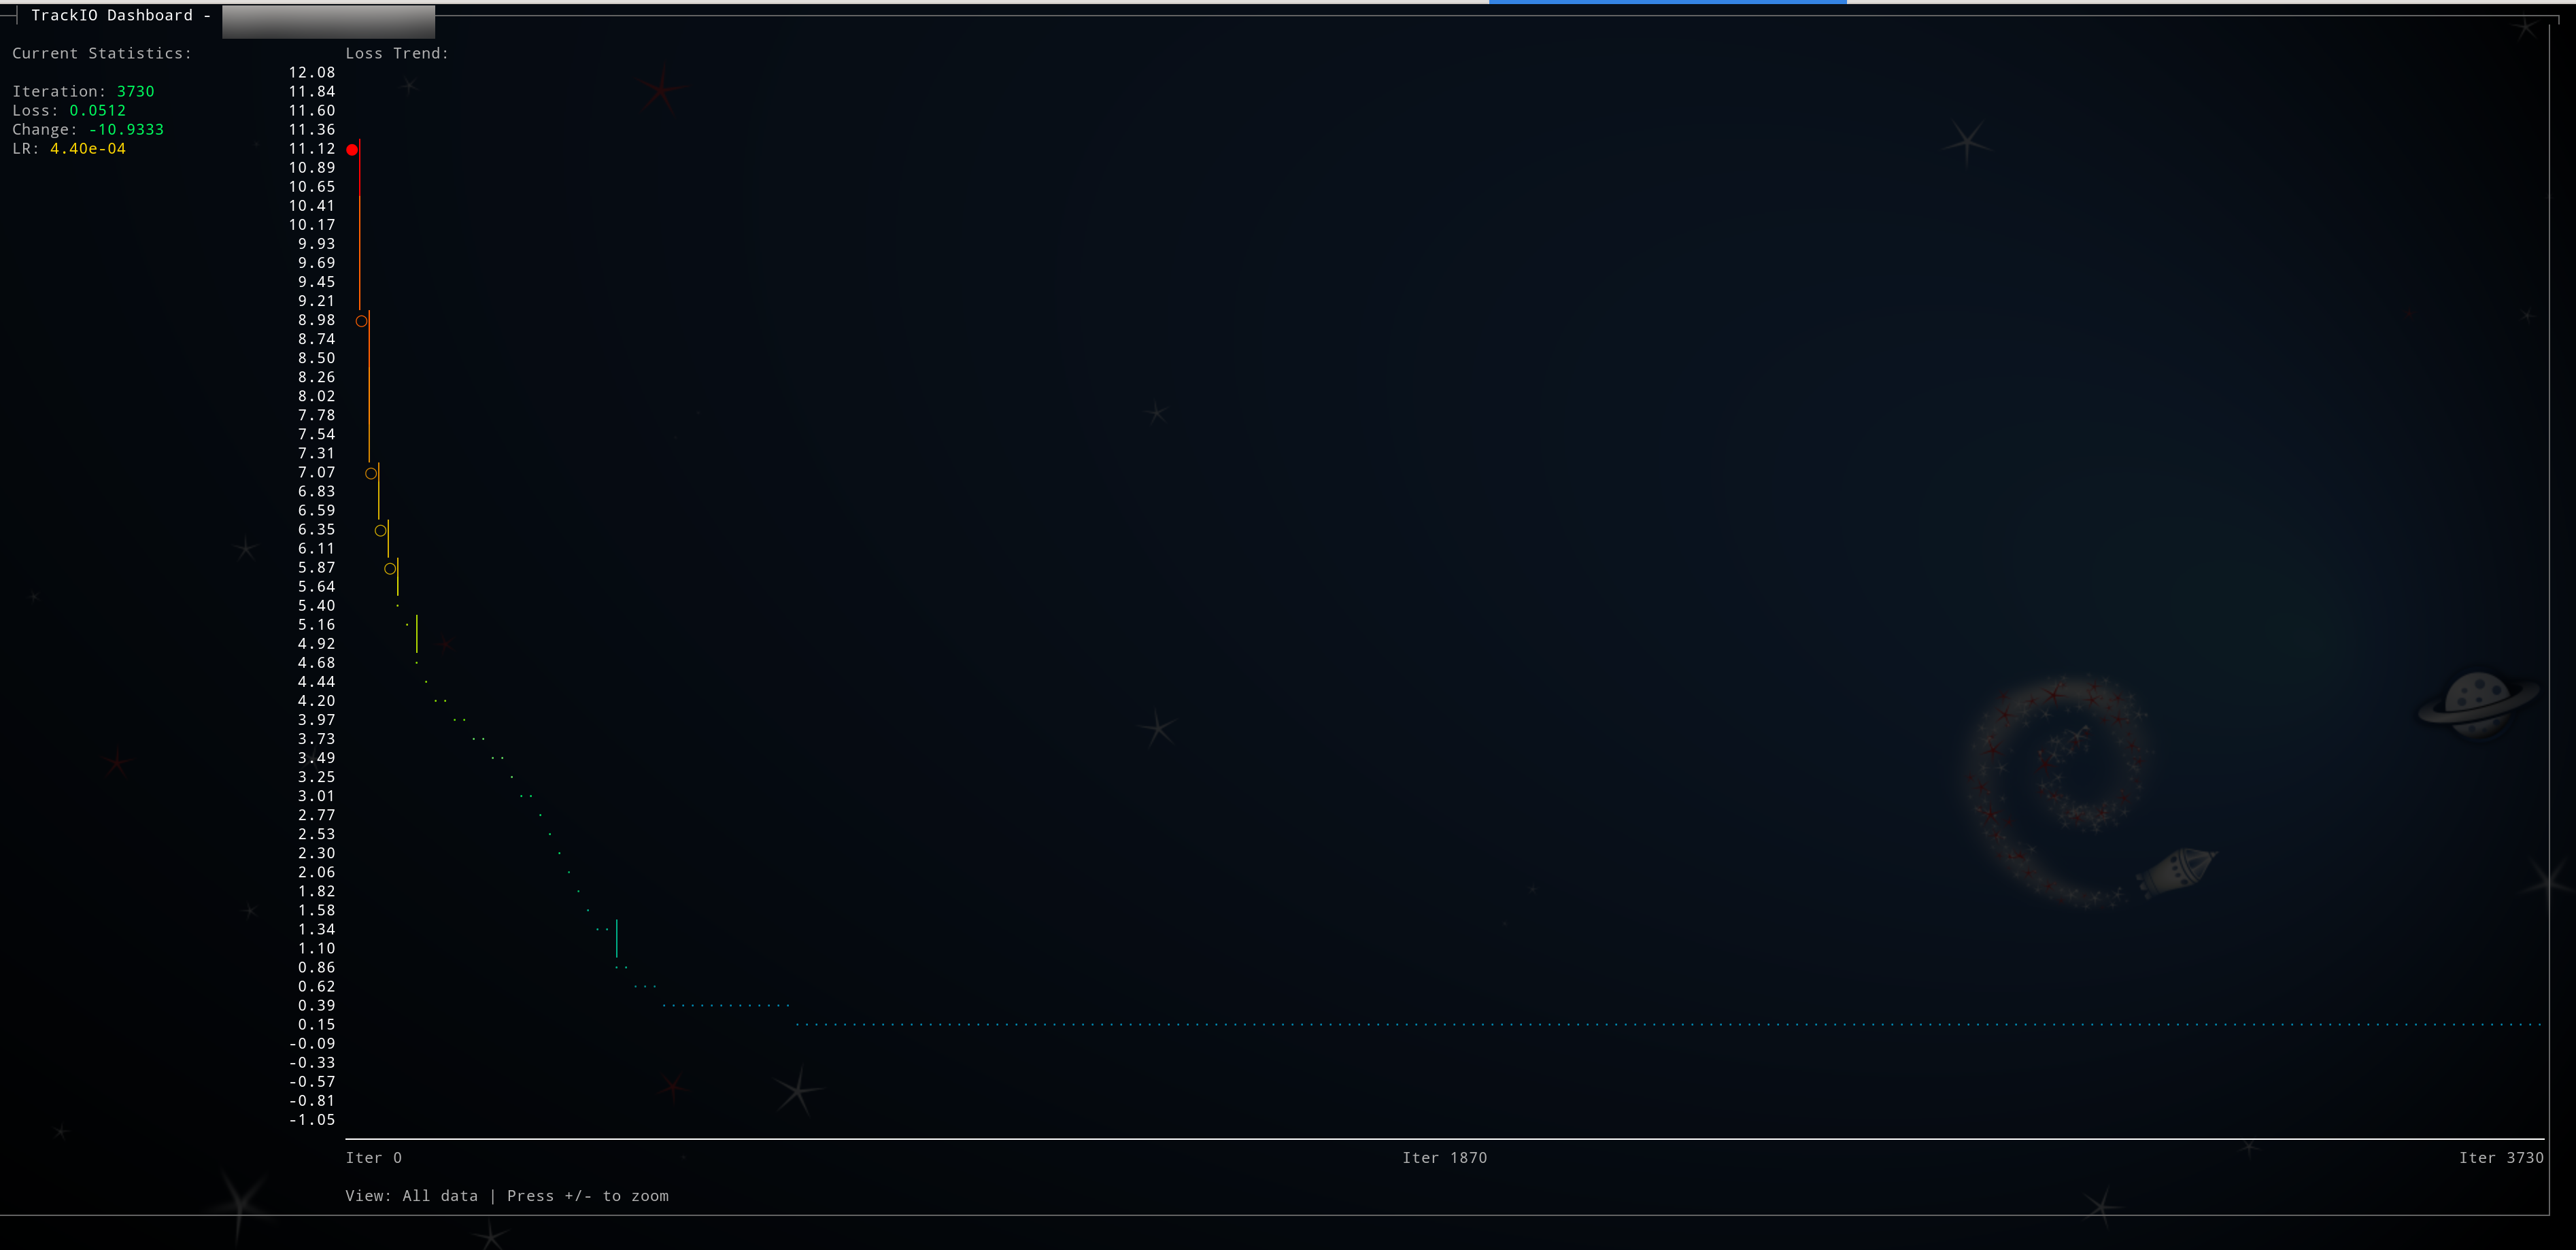
Real-World Example: Progressive Zoom Levels
Each level numerically represents zooming in by pressing +:
Level 1 - Initial View (500 iterations):
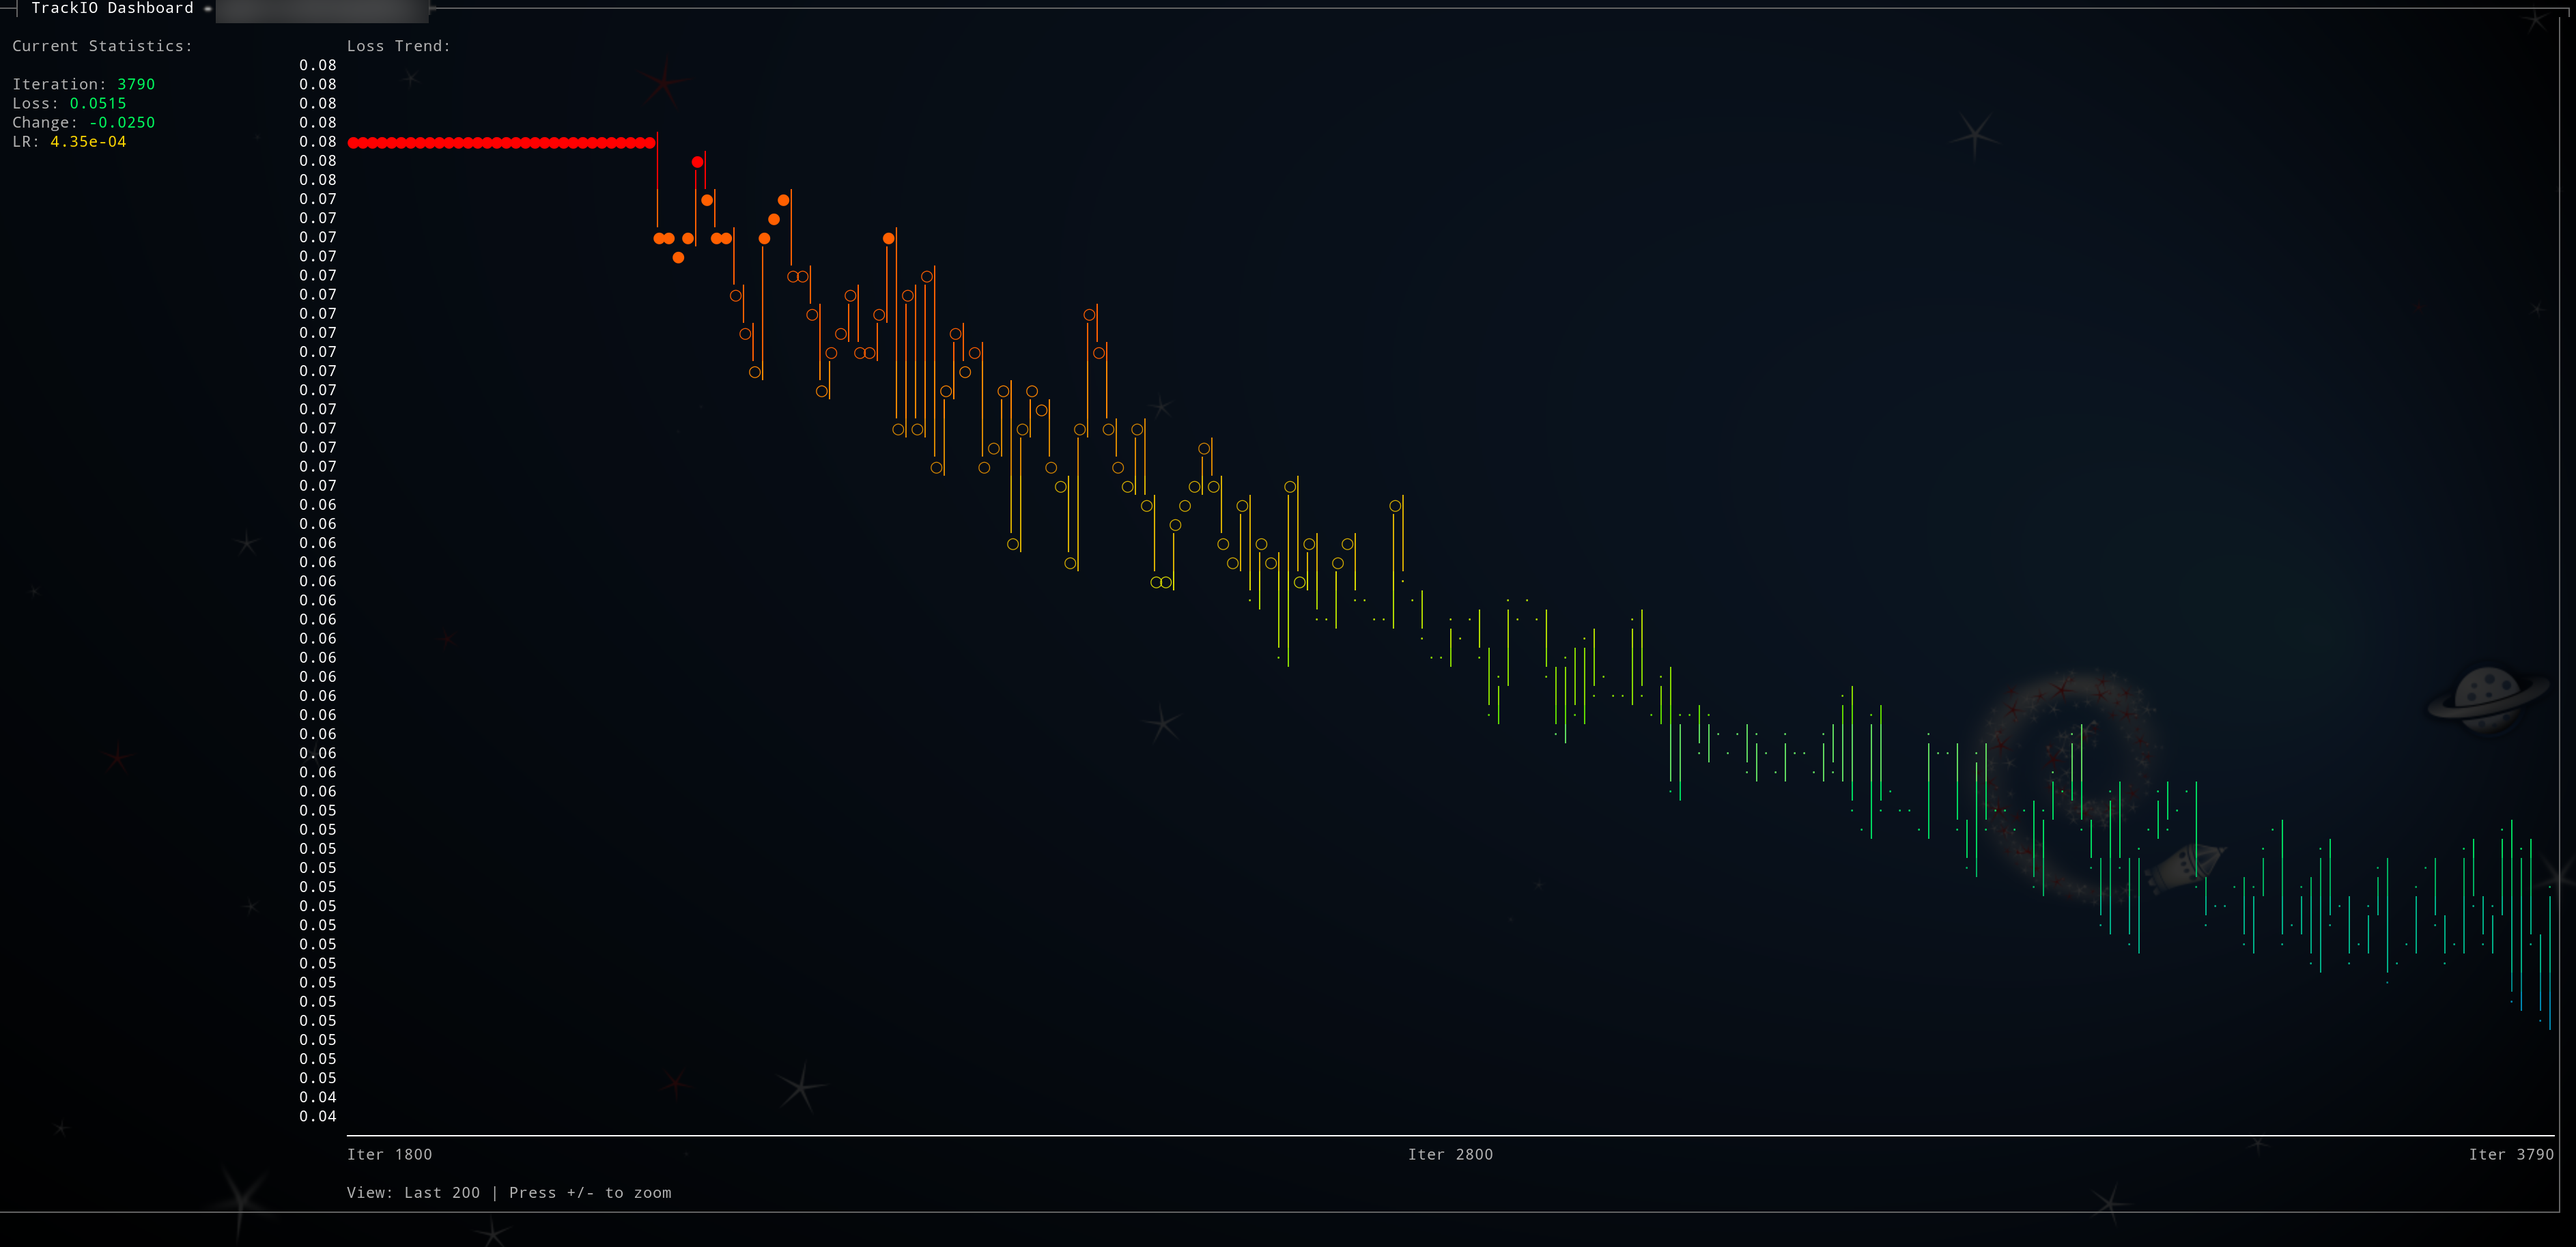
Level 2 - Zoomed In (200 iterations):
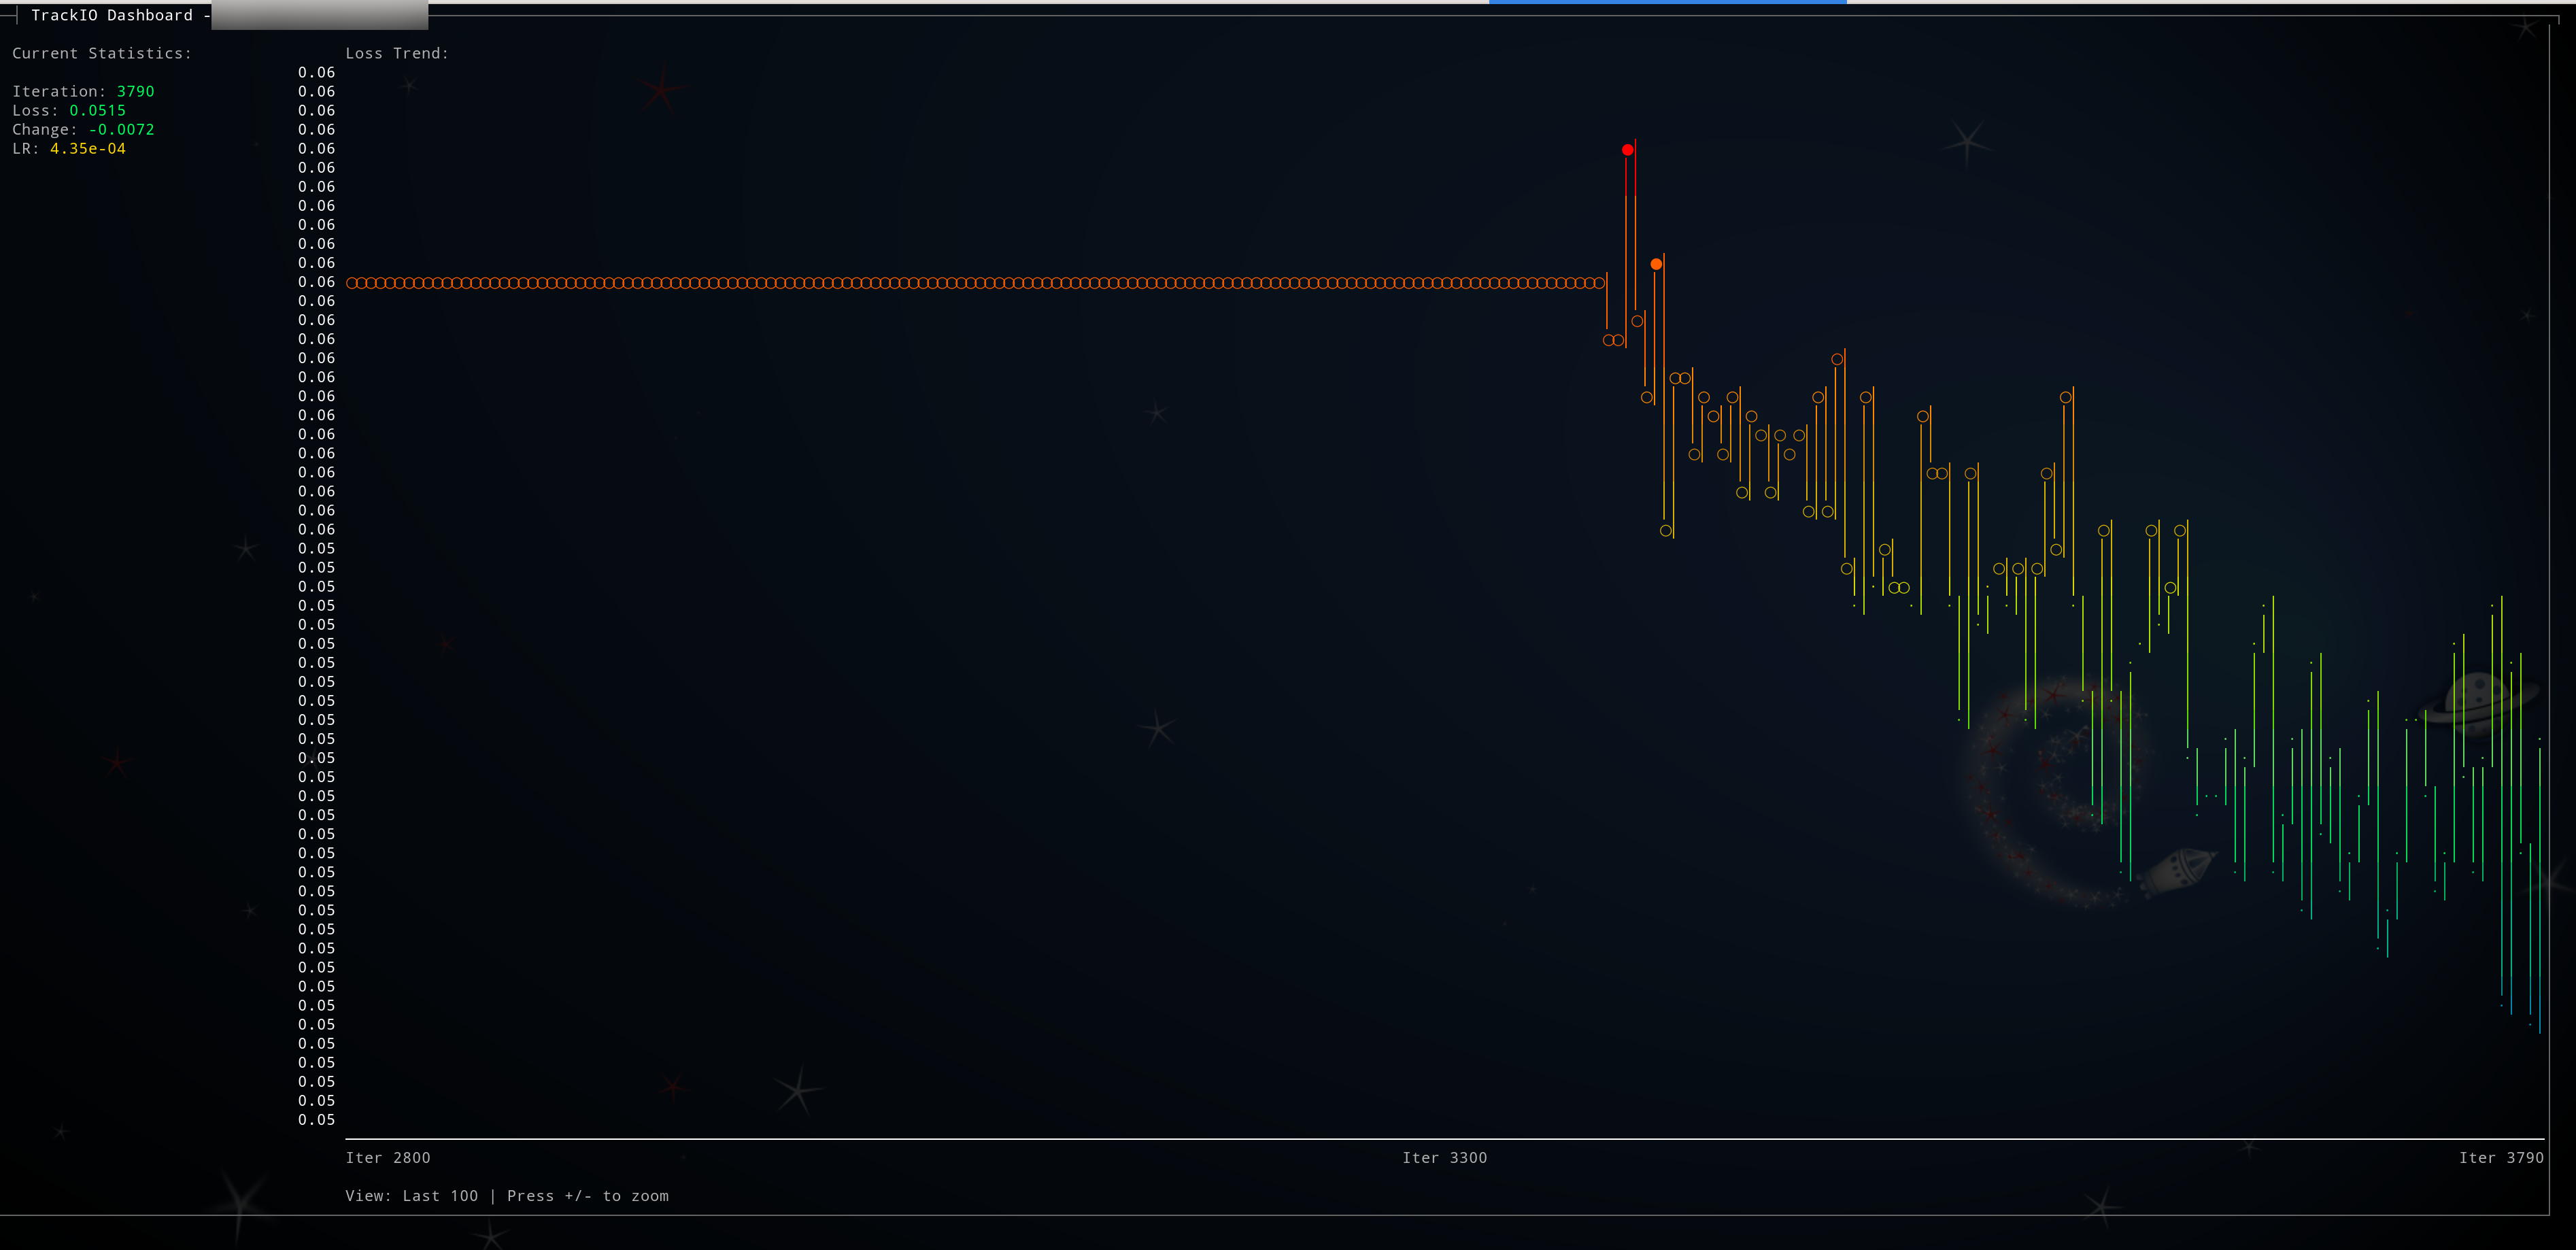
Level 3 - Maximum Detail (100 iterations):
This feature is perfect for:
- Getting an overview of entire training runs (zoom out)
- Examining recent training dynamics in detail (zoom in)
- Identifying patterns at different time scales
- Monitoring convergence behavior and spotting anomalies
Examples
# Monitor specific project
trackio-view --project my-model-training

# Quick snapshot without live updates
trackio-view --once

# Start with zoom on last 200 iterations
trackio-view --zoom 2

# Slower updates (every 5 seconds)
trackio-view --interval 5

# Monitor GPU while training
trackio-view --gpu

# View historical GPU data from training
trackio-view --gpu-db --project my-training --once

# List all available projects
trackio-view --list

# Delete a project (with confirmation)
trackio-view --delete my-old-project

# Delete a project without confirmation
trackio-view --delete my-old-project --force
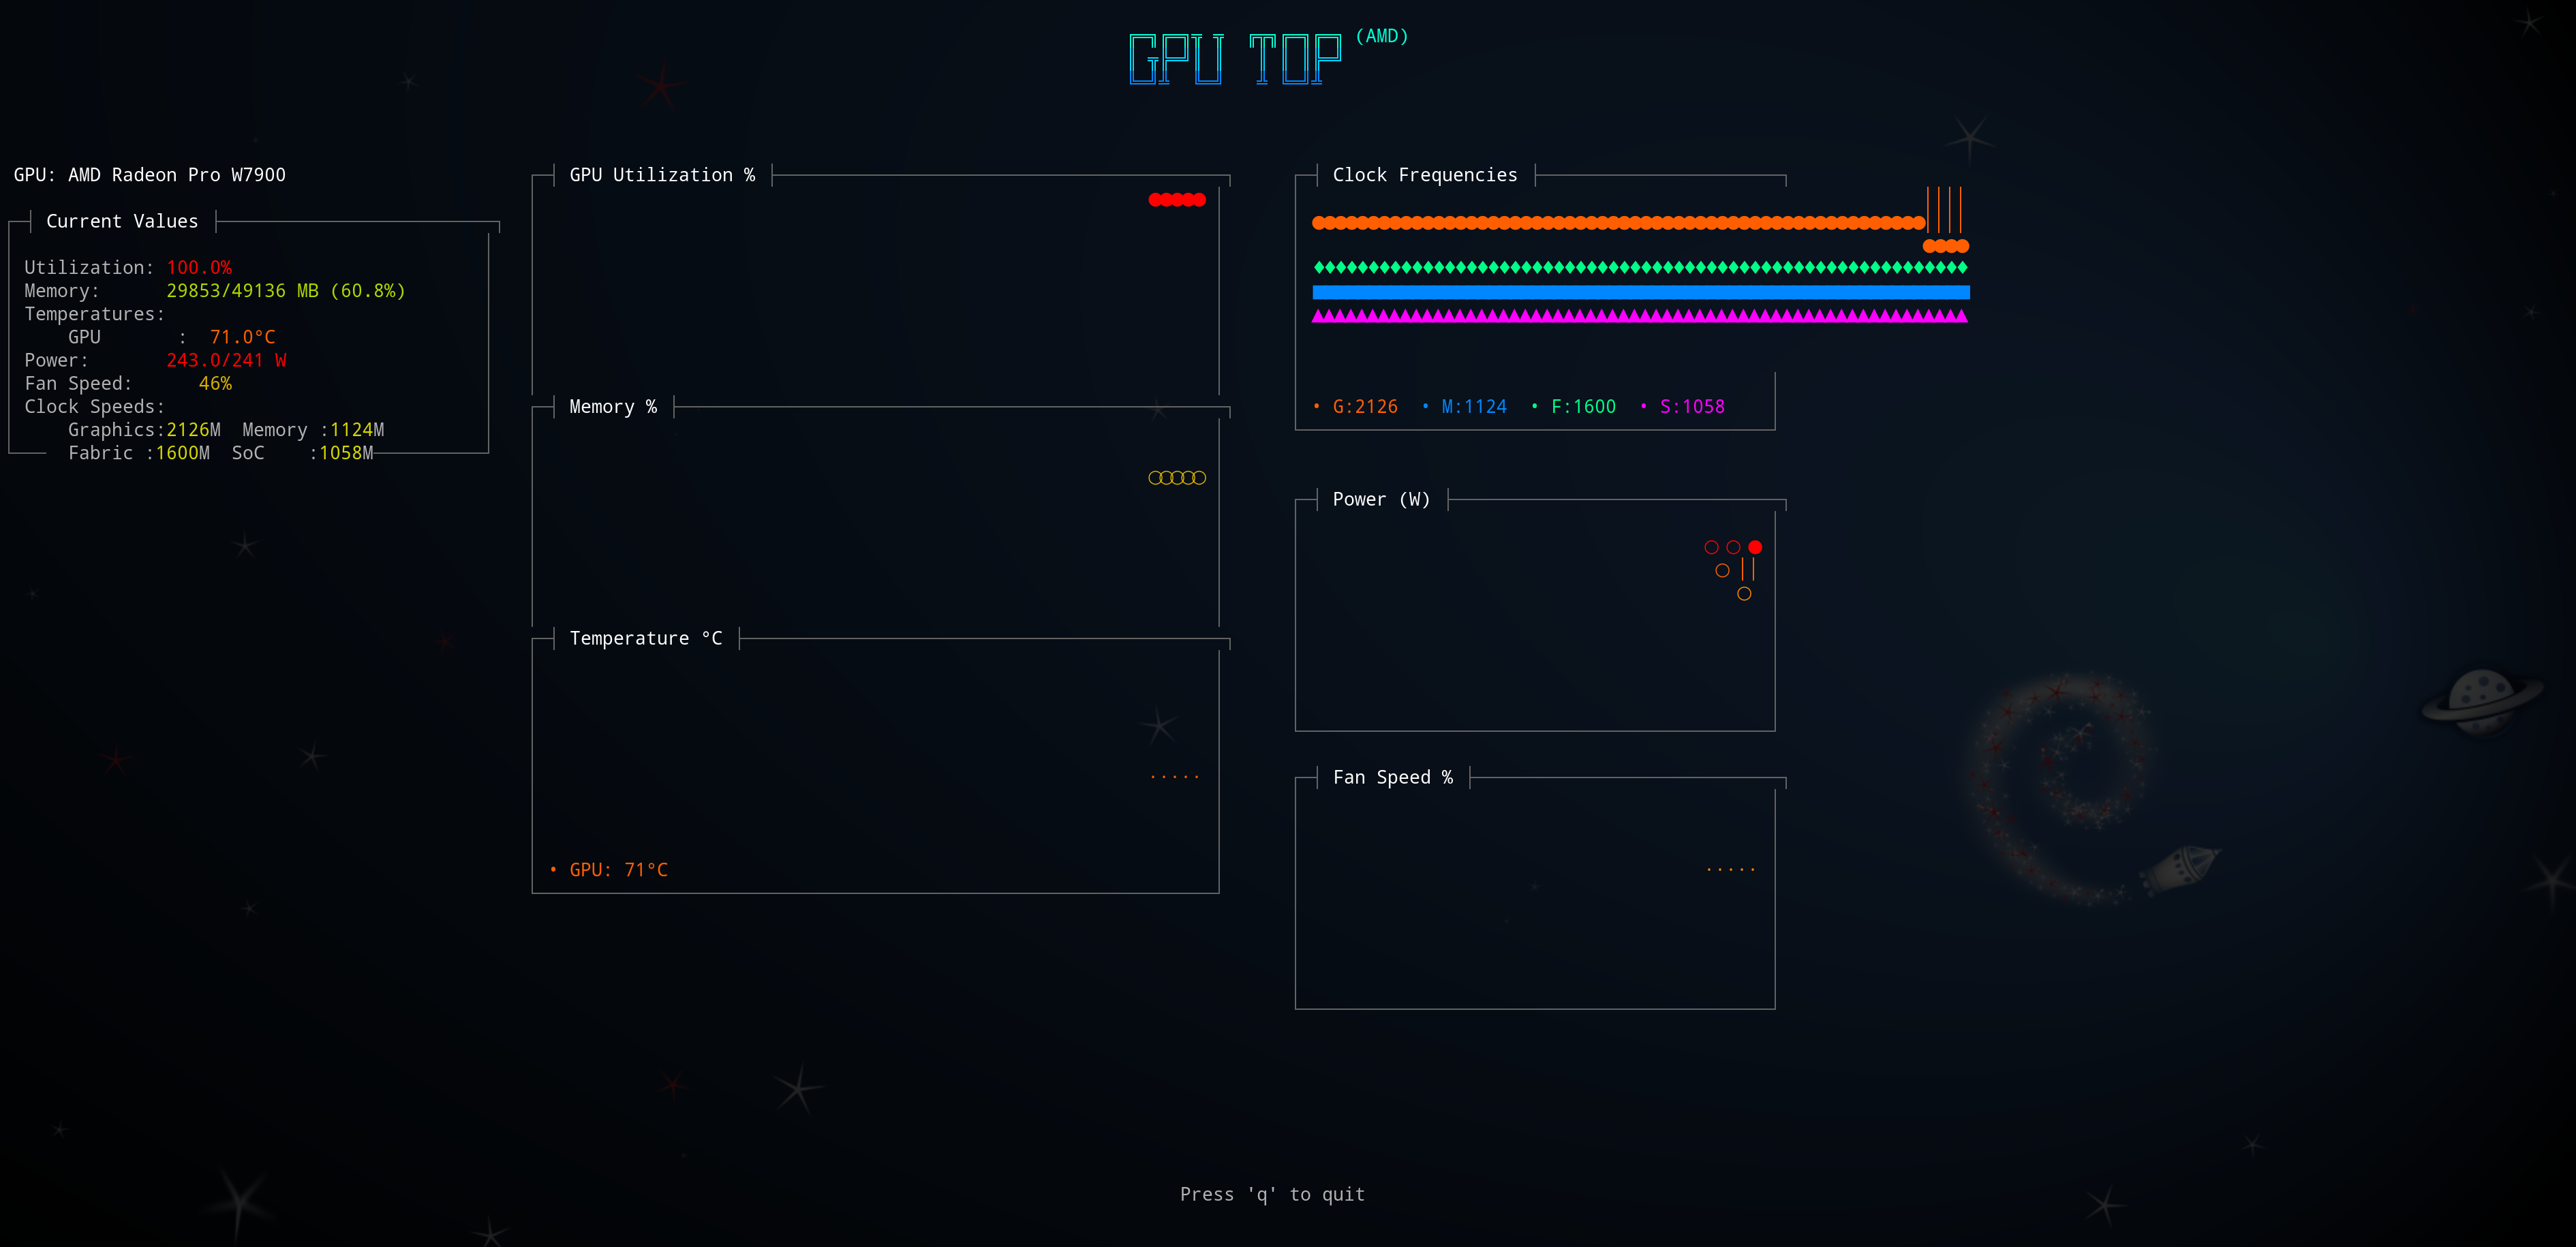
GPU Monitoring
TrackIO View includes comprehensive GPU monitoring inspired by gputop.
Supported GPUs
NVIDIA GPUs
- Desktop: RTX 30/40 series, GTX 10/16 series, Quadro
- Datacenter: A100, V100, A10G, T4
- Embedded: Jetson TX2, Xavier, Orin, Nano
AMD GPUs
- Workstation: Radeon Pro W7900, W6800, W5700
- Consumer: RX 6000/7000 series, RX 500/Vega series
- Datacenter: MI100, MI250, MI300 series
Intel GPUs
- Arc series discrete GPUs
- Integrated: Iris Xe, UHD Graphics
GPU Metrics
- GPU utilization percentage
- Memory usage (GB and percentage)
- Temperature (multiple sensors)
- Power consumption
- Clock frequencies (graphics, memory, fabric, SoC)
- Fan speed and RPM
- Performance states
Use Cases
Remote Training Monitoring
# SSH into remote server
ssh user@gpu-server

# Monitor training progress
trackio-view --project remote-training

# Or run in screen/tmux for persistent monitoring
screen -S training-monitor
trackio-view --project my-training
Quick Status Checks
# Get training snapshot
trackio-view --once

# Pipe to file
trackio-view --once > metrics.txt

# Extract specific metrics
trackio-view --once | grep "Latest Loss:"
Automation and Scripting
# Check if training converged
change=$(trackio-view --once --zoom 3 | grep "Loss Change:" | awk '{print $3}')
if (( $(echo "$change < 0.001 && $change > -0.001" | bc -l) )); then
  echo "Training has converged"
fi

# Log progress periodically
while true; do
  trackio-view --once >> training_log.txt
  sleep 3600
done
Architecture
TrackIO View is designed as a lightweight, standalone package that depends on TrackIO for data access:
- trackio_view.view: Main viewer module with terminal UI
- trackio_view.gpu_monitor: Cross-platform GPU monitoring backend
- trackio_view.gpu_dashboard: Simplified GPU dashboard
- trackio_view.gpu_dashboard_gputop: Full gputop-style monitoring
The package uses:
- ANSI escape codes for terminal control and colors
- Gradient color schemes for visual feedback
- Deque-based data structures for efficient graph rendering
- Platform-specific GPU interfaces (NVML, sysfs, DRM)
Requirements
- Python 3.8+
- trackio >= 0.1.0
- Optional:
richfor enhanced terminal graphics - Optional:
nvidia-ml-pyfor NVIDIA GPU monitoring
Development
# Clone the repository
git clone https://github.com/mcgrof/trackio-view.git
cd trackio-view

# Install in development mode
pip install -e .[dev]

# Run tests
pytest

# Format code
ruff check --fix --select I && ruff format
Troubleshooting
No data found
Ensure:
- TrackIO logging is enabled in your training script
- Data is in the expected location (
~/.cache/huggingface/trackio/) - Correct project name is specified
Colors not displaying
Try:
- Using a modern terminal (iTerm2, Windows Terminal, etc.)
- Setting
TERM=xterm-256color - Installing the
richlibrary
GPU monitoring not working
Check:
- GPU drivers are installed
- For NVIDIA: Install
nvidia-ml-pypackage - For AMD: sysfs hwmon interfaces are accessible
- Run with
--onceto see detailed error messages
Contributing
Contributions are welcome! Please feel free to submit a Pull Request.
License
MIT - See LICENSE file for details
Credits
- Inspired by gputop for terminal-based GPU monitoring
- Built on top of TrackIO for experiment tracking
Links
Release history Release notifications | RSS feed


Download files
Download the file for your platform. If you're not sure which to choose, learn more about installing packages.
Source Distribution
Built Distribution
Filter files by name, interpreter, ABI, and platform.
If you're not sure about the file name format, learn more about wheel file names.
Copy a direct link to the current filters
File details
Details for the file trackio_view-0.1.2.tar.gz.
File metadata
- Download URL: trackio_view-0.1.2.tar.gz
- Upload date:
- Size: 2.9 MB
- Tags: Source
- Uploaded using Trusted Publishing? No
- Uploaded via: twine/6.2.0 CPython/3.13.7
File hashes
| Algorithm | Hash digest | |
|---|---|---|
| SHA256 |
9c10b3b065e285f501520563e41068215ca4c083831ed74a4d0e3276406db56b
|
|
| MD5 |
2e23d0511236ee0535e279fa4d2ad4d5
|
|
| BLAKE2b-256 |
b5a17465bc01ee89528552f768ca26ec13a8cb89ce97358580336cccdab30b75
|
File details
Details for the file trackio_view-0.1.2-py3-none-any.whl.
File metadata
- Download URL: trackio_view-0.1.2-py3-none-any.whl
- Upload date:
- Size: 39.5 kB
- Tags: Python 3
- Uploaded using Trusted Publishing? No
- Uploaded via: twine/6.2.0 CPython/3.13.7
File hashes
| Algorithm | Hash digest | |
|---|---|---|
| SHA256 |
2dfba0643c3f1ddb8d7991c90ac5969c712a07ff537bb69c748387ab0265c901
|
|
| MD5 |
0a364e31f73ed7649e4afbfc5205af72
|
|
| BLAKE2b-256 |
07d5837924843b6aa7d2e1e4f7269c99ef2d4a3a75ed18a1da6231ed3b497c9f
|


