
volcano-pygmt



A Python package for plotting volcano maps using PyGMT. Generate scientific-quality maps with terrain relief, contours, seismic station markers, scale bars, north arrows, and country-level locator insets.
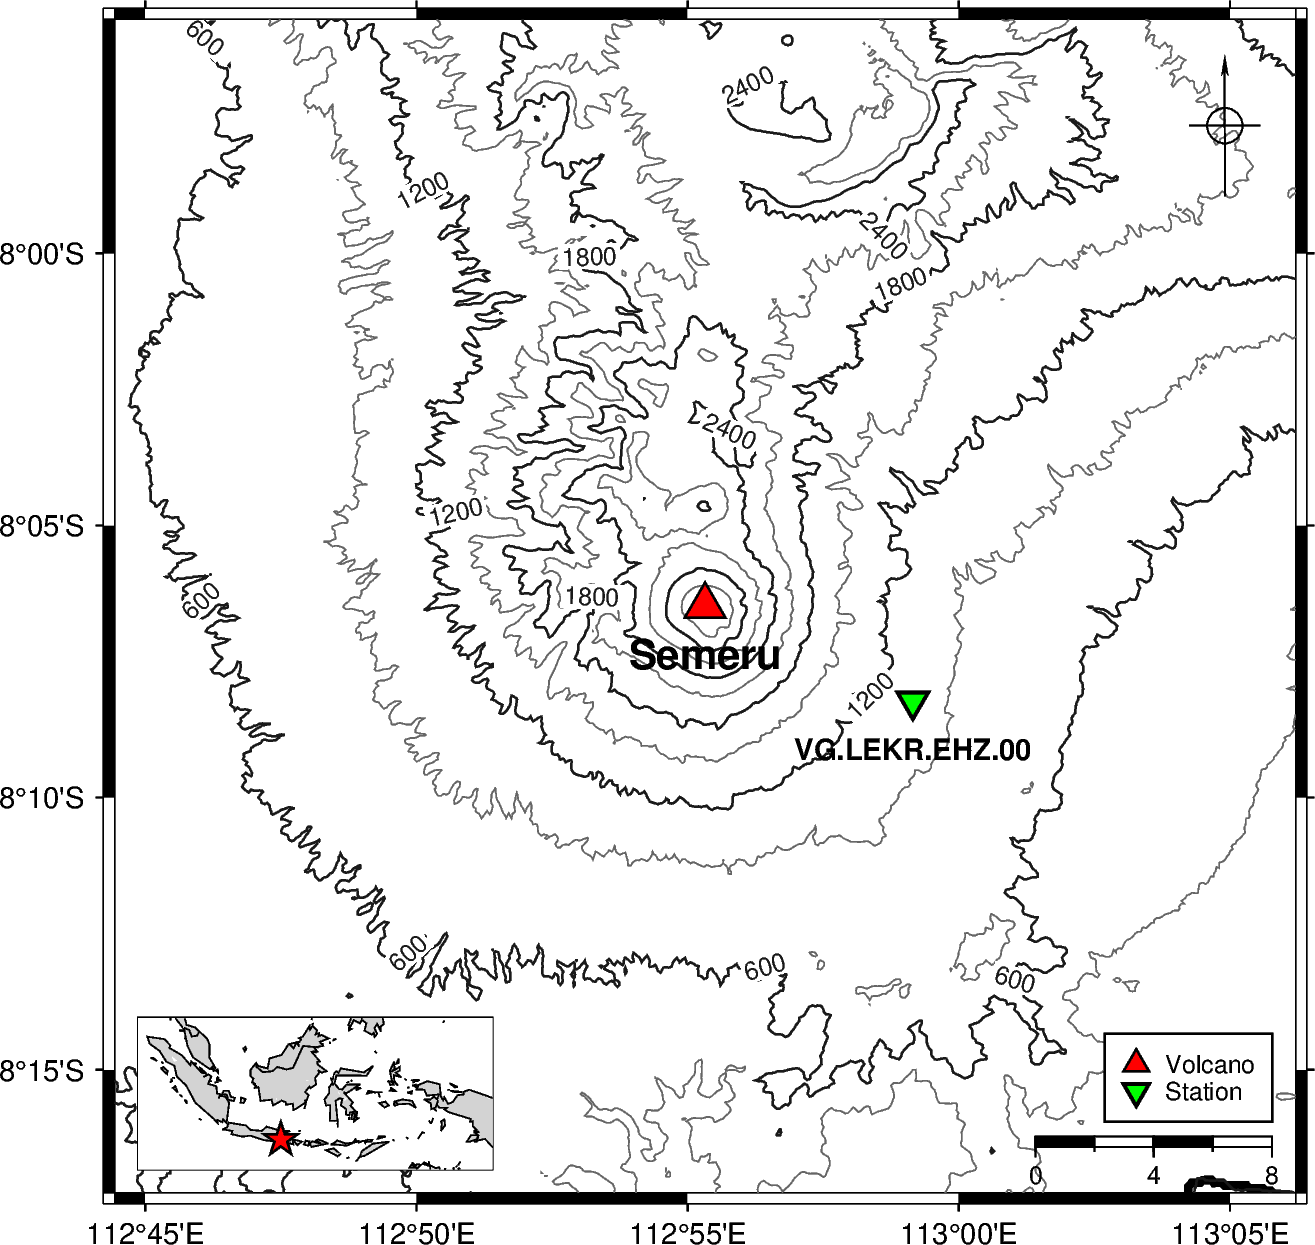
Semeru · East Java, Indonesia Contour interval 300 m · padding 20 km |
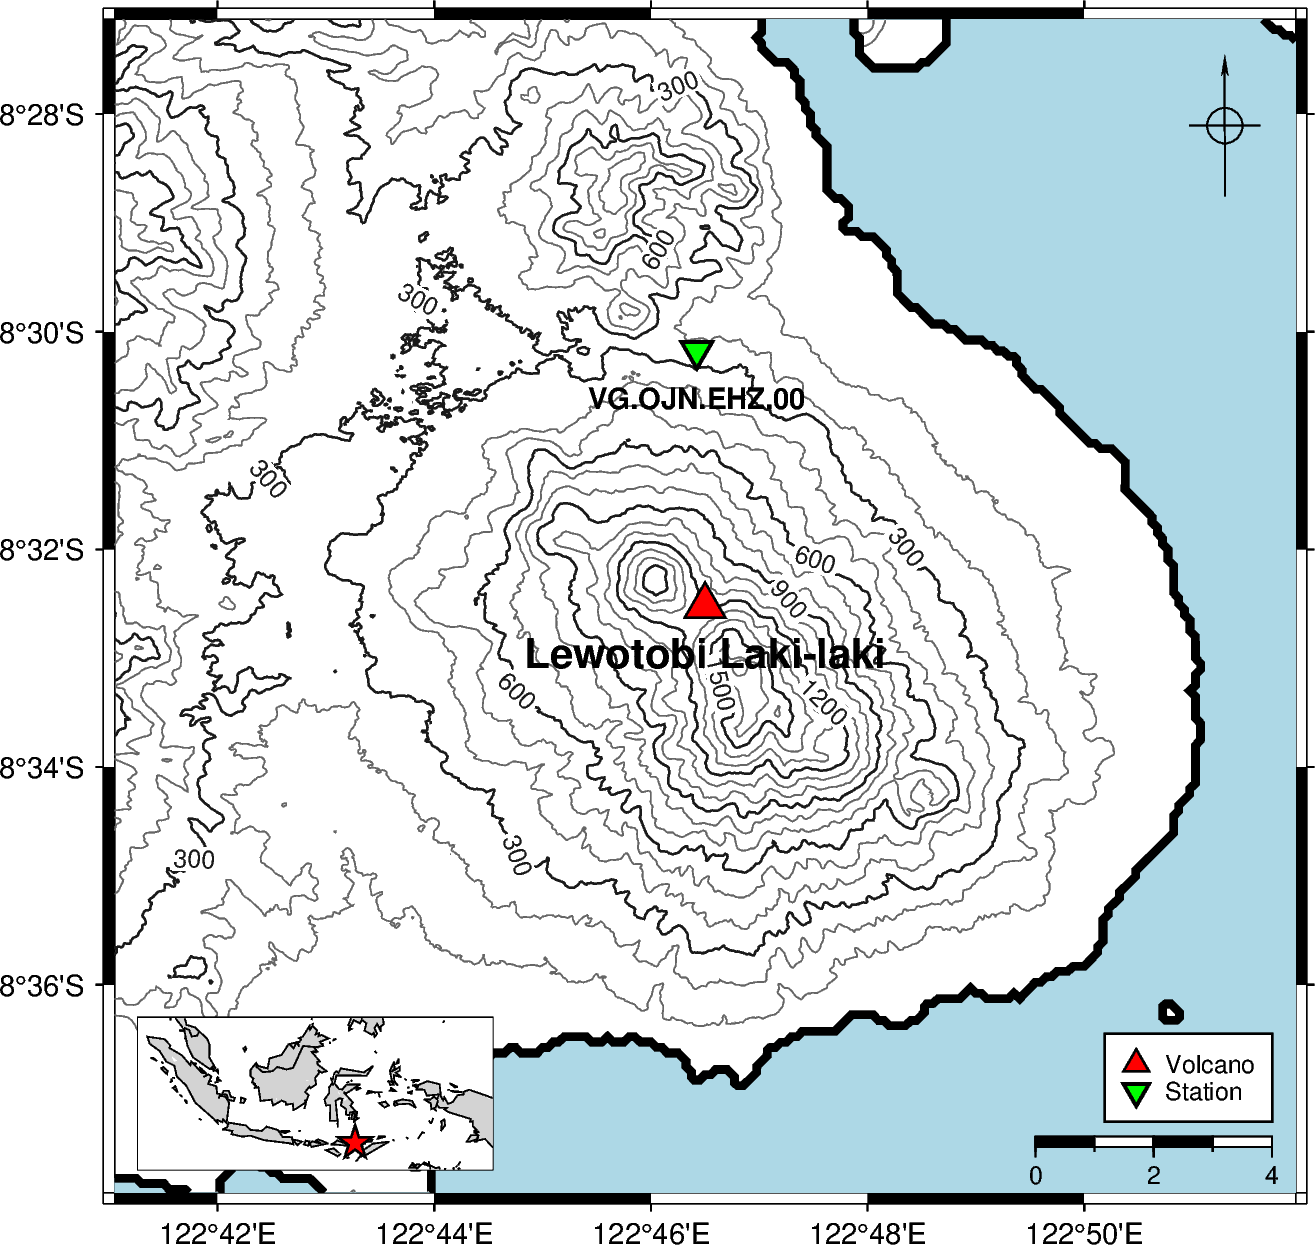
Lewotobi Laki-laki · East Nusa Tenggara, Indonesia Contour interval 300 m · padding 10 km |
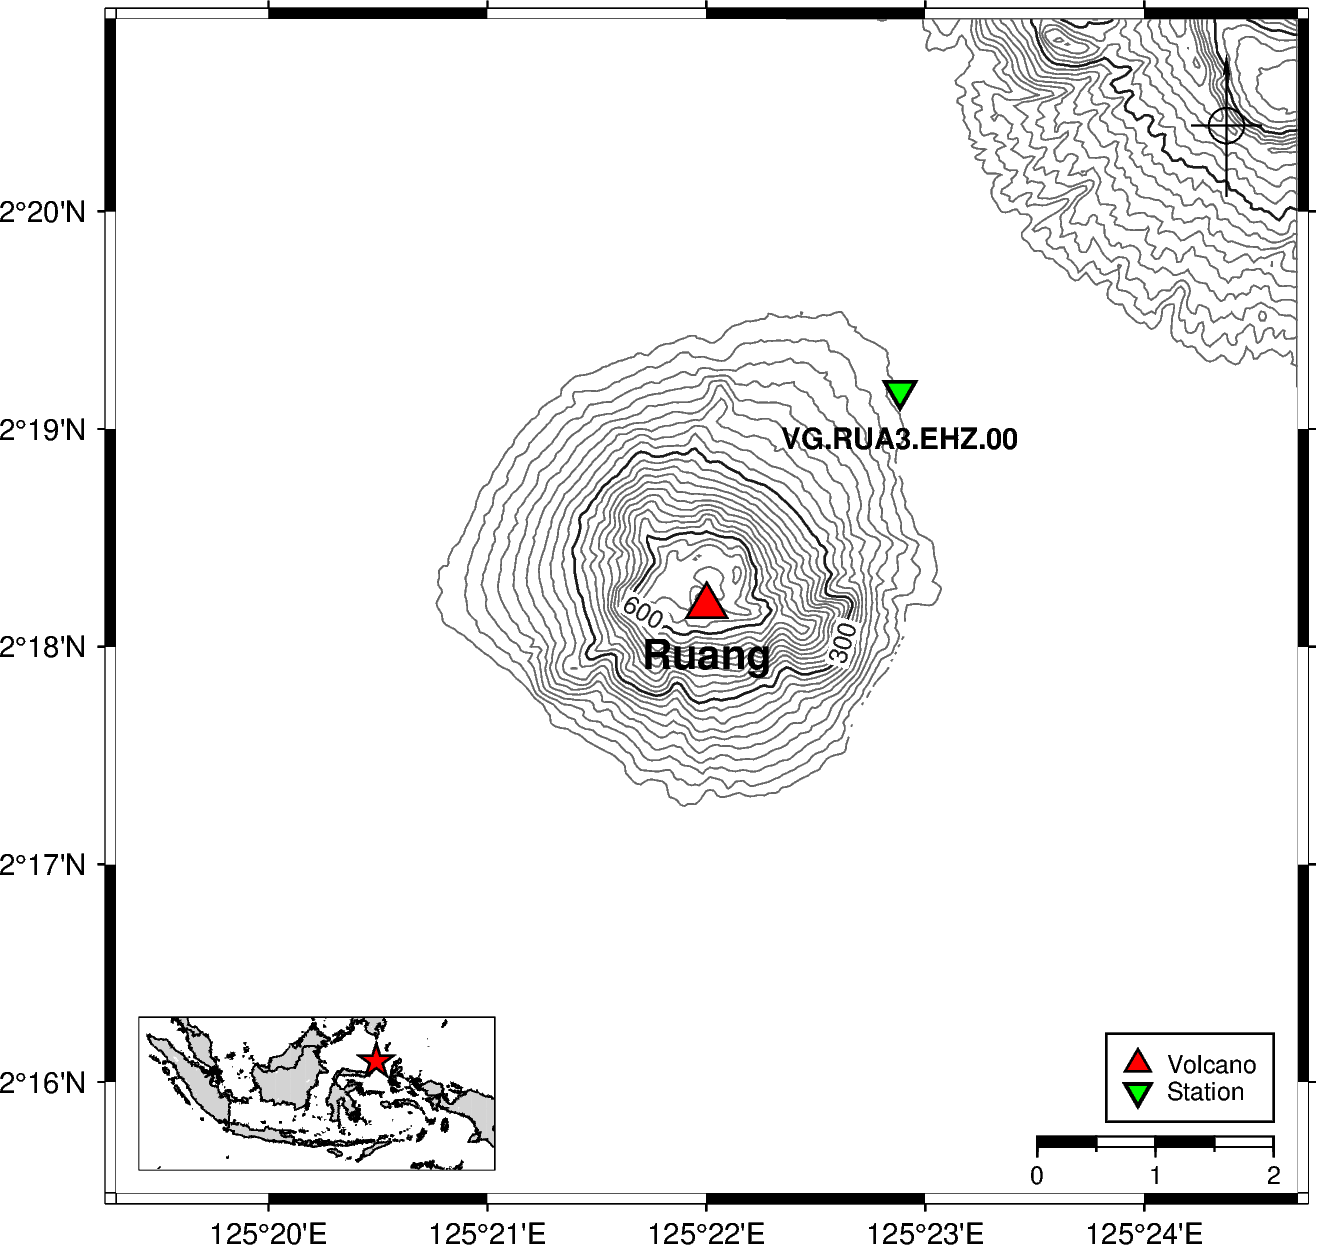
Ruang · North Sulawesi, Indonesia Contour interval 200 m · padding 5 km |
Table of Contents
Requirements
- Python
>=3.12 - uv — Python package manager (installation guide)
- GMT (Generic Mapping Tools) — required by PyGMT (download, troubleshooting)
Configuration
[!IMPORTANT]
GMT_LIBRARY_PATHmust be set in your environment beforepygmtis imported. Importing PyGMT without it will raise a library-not-found error.
If PyGMT cannot find the GMT shared library at import time, set GMT_LIBRARY_PATH to the directory that contains the GMT shared library (gmt_c.dll on Windows, libgmt.dylib on macOS, libgmt.so on Linux).
1. Copy the example file
cp .env.example .env
Open .env in any text editor. It will look like this:
GMT_LIBRARY_PATH=
Fill in the path to the directory containing the GMT shared library:
GMT_LIBRARY_PATH=C:/Program Files/GMT6/bin
2. Edit .env and set the path
GMT_LIBRARY_PATH=/path/to/gmt/lib
Platform examples:
| Platform | Typical value |
|---|---|
| Windows | C:/Program Files/GMT6/bin |
| macOS (Homebrew) | /opt/homebrew/lib |
| Linux | /usr/lib/x86_64-linux-gnu |
Tip: Run
gmt --versionin your terminal to confirm GMT is installed, then locate the library withfind / -name "libgmt*" 2>/dev/null(Linux/macOS) orwhere gmt(Windows). The library lives in the same directory as (or adjacent to) thegmtexecutable.
3. How it works
The package calls load_config() automatically on import, which reads .env and injects GMT_LIBRARY_PATH into the process environment before PyGMT is imported. You do not need to set the variable globally in your shell — the .env file is enough.
If you need to load the configuration manually (e.g. in a standalone script that imports PyGMT directly), call load_config() before any PyGMT import:
from volcano_pygmt.config import load_config

load_config()  # reads .env and sets GMT_LIBRARY_PATH

import pygmt  # now safe to import
Installation
From PyPI
pip install volcano-pygmt
From source
- Clone the repository:
git clone https://github.com/martanto/volcano-pygmt.git
cd volcano-pygmt
- Install dependencies with
uv:
uv sync
This installs all runtime dependencies (pygmt, rioxarray, loguru, dotenv) and dev tools (ruff, ty, pytest, etc.).
Quick Start
from volcano_pygmt import plot

maps = [
    {
        "padding_km": 20,
        "volcano": {"lon": 112.922, "lat": -8.108, "elev": 3672, "name": "Semeru"},
        "stations": {
            "VG.LEKR.EHZ.00": {"lat": -8.137244444, "lon": 112.9858444},
        },
        "contour": True,
        "contour_interval": 300.0,
        "contour_annotation": 600.0,
        "colorbar": True,
    },
]

files = plot(maps)
print(files)  # [PosixPath('.../output/semeru.png')]
Output PNG files are saved to ./output/<volcano-name-slug>.png.
See main.py for a more complete example with multiple volcanoes and local DEM files.
Examples
Multiple volcanoes in a batch
The following example (from main.py) plots three Indonesian volcanoes — Semeru, Lewotobi Laki-laki, and Ruang — each with one seismic station and contour lines. Semeru and Lewotobi use local DEM files; Ruang falls back to SRTM data:
from volcano_pygmt import plot

maps = [
    {
        "volcano": {"lon": 112.922, "lat": -8.108, "elev": 3672, "name": "Semeru"},
        "stations": {
            "VG.LEKR.EHZ.00": {"lat": -8.137244444, "lon": 112.9858444},
        },
        "dem_files": [
            "DEMNAS_1608-12_v1.0.tif",
            "DEMNAS_1608-21_v1.0.tif",
            "DEMNAS_1607-42_v1.0.tif",
            "DEMNAS_1607-44_v1.0.tif",
            "DEMNAS_1607-53_v1.0.tif",
        ],
        "padding_km": 20,
        "color_relief": False,
        "contour": True,
        "contour_interval": 300.0,
        "contour_annotation": 600.0,
        "colorbar": True,
    },
    {
        "volcano": {
            "lon": 122.775,
            "lat": -8.542,
            "elev": 3672,
            "name": "Lewotobi Laki-laki",
        },
        "stations": {
            "VG.OJN.EHZ.00": {"lat": -8.502944444, "lon": 122.7737222},
        },
        "dem_files": [
            "DEMNAS_2207-33_v1.0.tif",
            "DEMNAS_2207-34_v1.0.tif",
            "DEMNAS_2207-61_v1.0.tif",
            "DEMNAS_2207-62_v1.0.tif",
        ],
        "padding_km": 10,
        "color_relief": False,
        "contour": True,
        "contour_interval": 100.0,
        "contour_annotation": 300.0,
        "colorbar": True,
    },
    {
        "volcano": {"lon": 125.3667, "lat": 2.3031, "elev": 703, "name": "Ruang"},
        "stations": {
            "VG.RUA3.EHZ.00": {"lat": 2.3196, "lon": 125.3814},
        },
        "padding_km": 5,
        "color_relief": False,
        "contour": True,
        "contour_interval": 200.0,
        "contour_annotation": 200.0,
        "colorbar": True,
    },
]

plot(maps, "png")
Run it with:
uv run main.py
Single volcano with color relief and hillshade
from volcano_pygmt.plot import create_figure

volcano = {"lon": 107.65, "lat": -6.9, "name": "Tangkuban Parahu"}

fig = create_figure(
    volcano,
    padding_km=10.0,
    hillshade=True,
    contour=True,
    contour_interval=100.0,
    color_relief=True,
    colorbar=True,
    relief_cmap="gmt/haxby",
)

fig.savefig("tangkuban-parahu.png")
API Reference
plot(maps, file_type, water_color)
Batch-render a list of volcano map specs and save each as a file to ./output/<slug>.<file_type>.
Parameters:
| Parameter | Type | Default | Description |
|---|---|---|---|
maps |
list[dict] |
required | List of map specification dicts (see keys below) |
file_type |
str |
"png" |
Output file format: "png" or "pdf" |
water_color |
str |
"lightblue" |
Default water fill colour for all maps using DEM files (overridden per-map by "water_color" key) |
Returns: list[pathlib.Path] — absolute paths to the saved files, in input order.
Map spec keys:
| Key | Type | Default | Description |
|---|---|---|---|
volcano |
dict |
required | Volcano info — must include "lon" (float), "lat" (float), "name" (str) |
padding_km |
float |
required | Half-extent of the map around the volcano centre in kilometres |
stations |
dict | None |
None |
Station codes mapped to {"lon": float, "lat": float}; omit or set None to skip |
dem_files |
list[str] | None |
None |
Local GeoTIFF DEM file paths; falls back to SRTM download when None |
country |
str |
"Indonesia" |
Country name for the locator inset (must be in COUNTRY_REGIONS) |
hillshade |
bool |
False |
Render a grayscale shaded-relief layer |
contour |
bool |
False |
Draw elevation contour lines |
contour_interval |
float |
100.0 |
Spacing between contour lines in metres |
contour_annotation |
float | None |
None |
Contour label interval in metres; defaults to 5 × contour_interval when None |
color_relief |
bool |
False |
Render a colour-filled elevation image |
colorbar |
bool |
False |
Add an elevation colorbar (requires color_relief=True) |
relief_cmap |
str |
"gmt/haxby" |
GMT colormap for colour relief — any valid GMT CPT name (e.g. "geo", "topo", "dem1", "gray") |
show_title |
bool |
False |
Display the volcano name as the map title |
water_color |
str |
"lightblue" |
Fill colour for water areas when dem_files is set — "white", "blue", "lightblue", or "lightgray" |
create_figure(volcano, stations, padding_km, ...)
Create and return a fully composed pygmt.Figure for a single volcano. Includes coastlines, optional terrain relief, volcano and station symbols, a legend, a scale bar, a north-arrow rose, and a country-level locator inset.
Parameters:
| Parameter | Type | Default | Description |
|---|---|---|---|
volcano |
dict |
required | Must include "lon" (float), "lat" (float), "name" (str) |
stations |
dict | None |
None |
Station codes mapped to {"lon": float, "lat": float}; omit or set None to skip |
padding_km |
float |
5.0 |
Half-extent of the map around the volcano centre in kilometres |
country |
str |
"Indonesia" |
Country name for the locator inset |
dem_files |
list[str] | None |
None |
Local GeoTIFF DEM file paths; falls back to SRTM download when None |
hillshade |
bool |
False |
Render a grayscale shaded-relief layer |
contour |
bool |
False |
Draw elevation contour lines |
contour_interval |
float |
100.0 |
Spacing between contour lines in metres |
contour_annotation |
float | None |
None |
Contour label interval in metres; defaults to 5 × contour_interval when None |
color_relief |
bool |
False |
Render a colour-filled elevation image |
colorbar |
bool |
False |
Add an elevation colorbar (requires color_relief=True) |
relief_cmap |
str |
"gmt/haxby" |
GMT colormap for colour relief |
show_title |
bool |
True |
Display the volcano name as the map title |
water_color |
str |
"lightblue" |
Fill colour for water areas when dem_files is set — "white", "blue", "lightblue", or "lightgray" |
Returns: pygmt.Figure — fully rendered figure ready to save or display.
add_relief(fig, region, projection, ...)
Download SRTM 3-arc-second earth relief for region and composite one or more terrain layers onto fig.
Parameters:
| Parameter | Type | Default | Description |
|---|---|---|---|
fig |
pygmt.Figure |
required | The PyGMT figure to draw on |
region |
list[float] |
required | Map extent as [lon_min, lon_max, lat_min, lat_max] in decimal degrees |
projection |
str |
required | PyGMT/GMT projection string, e.g. "M10c" |
hillshade |
bool |
False |
Render a grayscale shaded-relief layer (radiance 315°/45°, exponential normalisation) |
contour |
bool |
False |
Draw elevation contour lines |
contour_interval |
float |
100.0 |
Spacing between contour lines in metres |
contour_annotation |
float | None |
None |
Contour label interval in metres; defaults to 5 × contour_interval when None |
color_relief |
bool |
False |
Render a colour-filled elevation image using relief_cmap |
colorbar |
bool |
False |
Add an elevation colorbar labelled in metres (requires color_relief=True) |
relief_cmap |
str |
"gmt/haxby" |
GMT colormap name for the colour-relief image |
Returns: pygmt.Figure — the same fig with the requested layers added in-place.
plot_from_dem(fig, dem_files, projection, ...)
Load one or more local GeoTIFF DEM files and composite hillshade, color relief, and/or contours onto fig.
Parameters:
| Parameter | Type | Default | Description |
|---|---|---|---|
fig |
pygmt.Figure |
required | The PyGMT figure to draw on |
dem_files |
str | list[str] |
required | Path or list of paths to GeoTIFF DEM files; multiple files are merged before plotting |
projection |
str |
required | PyGMT/GMT projection string, e.g. "M10c" |
region |
list[float] | None |
None |
Map extent as [lon_min, lon_max, lat_min, lat_max]; uses full DEM extent when None |
hillshade |
bool |
False |
Render a grayscale shaded-relief layer |
contour |
bool |
False |
Draw elevation contour lines |
contour_interval |
float |
100.0 |
Spacing between contour lines in metres |
contour_annotation |
float | None |
None |
Contour label interval in metres; defaults to 5 × contour_interval when None |
color_relief |
bool |
False |
Render a colour-filled elevation image |
colorbar |
bool |
False |
Add a colorbar showing the elevation scale |
relief_cmap |
str |
"gmt/haxby" |
GMT colormap name for the colour-relief image |
water_color |
str |
"lightblue" |
Fill colour for sea/water areas — "white", "blue", "lightblue", or "lightgray" |
Returns: pygmt.Figure — the same fig with the requested layers added in-place.
add_inset(fig, volcano, country)
Add a country-level locator inset to the bottom-left corner of fig, with a red star marking the volcano position.
Parameters:
| Parameter | Type | Default | Description |
|---|---|---|---|
fig |
pygmt.Figure |
required | The PyGMT figure to add the inset to |
volcano |
dict |
required | Must include "lon" (float) and "lat" (float) |
country |
str |
"Indonesia" |
Country name to look up in COUNTRY_REGIONS for the inset extent |
Returns: pygmt.Figure — the same fig with the inset added in-place.
Raises: ValueError — if country is not a key in COUNTRY_REGIONS.
Development
# Run tests
uv run pytest

# Lint
uv run ruff check src/

# Auto-fix lint issues
uv run ruff check --fix src/

# Type check
uv run ty check

# Start Jupyter notebook
uv run jupyter notebook
License
MIT — see LICENSE for details.
1 maintainer

Metadata
1 maintainer
Release files for volcano-pygmt 0.3.0
For a detailed explanation of source distributions (sdists) and built distributions (wheels), please see the package formats documentation.
Source distribution (sdist)
| File | Size | Uploaded | |
|---|---|---|---|
| volcano_pygmt-0.3.0.tar.gz | 16.4 kB | Details |
Built distribution (wheel)
| File | Interpreter | ABI | Platform | Reset |
|---|---|---|---|---|
| volcano_pygmt-0.3.0-py3-none-any.whl | Python 3 | none | any | Details |
Total release size: 36.6 kB
Release files / volcano_pygmt-0.3.0.tar.gz
| Download URL | volcano_pygmt-0.3.0.tar.gz |
|---|---|
| Size | 16.4 kB |
| Tags | Source |
|
SHA-256 checksum How to use checksums |
7024e62cdefbe8ce33631b3969e5567c5bd3b4fe5506ac833593a20c4be5120e
|
|
BLAKE2b-256 checksum How to use checksums |
03e8b3456cc15acaf48ab9d111e3dc275e5d5ce0642eddb01c10cb1d0467cc88
|
| Upload date | |
|
Uploaded using Trusted Publishing? What is trusted publishing? |
No |
| Uploaded via |
uv/0.9.22 {"installer":{"name":"uv","version":"0.9.22","subcommand":["publish"]},"python":null,"implementation":{"name":null,"version":null},"distro":null,"system":{"name":null,"release":null},"cpu":null,"openssl_version":null,"setuptools_version":null,"rustc_version":null,"ci":null}
|
Release files / volcano_pygmt-0.3.0-py3-none-any.whl
| Download URL | volcano_pygmt-0.3.0-py3-none-any.whl |
|---|---|
| Size | 20.2 kB |
| Tags | Python 3 |
|
SHA-256 checksum How to use checksums |
b0ac88fedbc0d11d83bb32d4a65cd969355472450b0f0ddc13691a87aacedb0f
|
|
BLAKE2b-256 checksum How to use checksums |
b700af293558a94b0f8804410598fc5fa54705d7453c7f17040fb6722e0300de
|
| Upload date | |
|
Uploaded using Trusted Publishing? What is trusted publishing? |
No |
| Uploaded via |
uv/0.9.22 {"installer":{"name":"uv","version":"0.9.22","subcommand":["publish"]},"python":null,"implementation":{"name":null,"version":null},"distro":null,"system":{"name":null,"release":null},"cpu":null,"openssl_version":null,"setuptools_version":null,"rustc_version":null,"ci":null}
|














