Webviz plugins for ERT
Project description
Web based visualization for ERT
What is Webviz-ert
Webviz-ert is a visualization tool for ERT based on dash and webviz-config.
Download project
The code is hosted on GitHub: https://github.com/equinor/webviz-ert
# From the downloaded project's root folder - to install
pip install .
Running tests
Make sure that you have a browser and driver available for running the tests, e.g. chrome / chromium and the chrome driver, which should be installed / downloaded as binaries and made available in the path.
# From the downloaded project's root folder - to run tests
pip install -r test_requirements.txt
cd tests
pytest
Run Webviz-ert
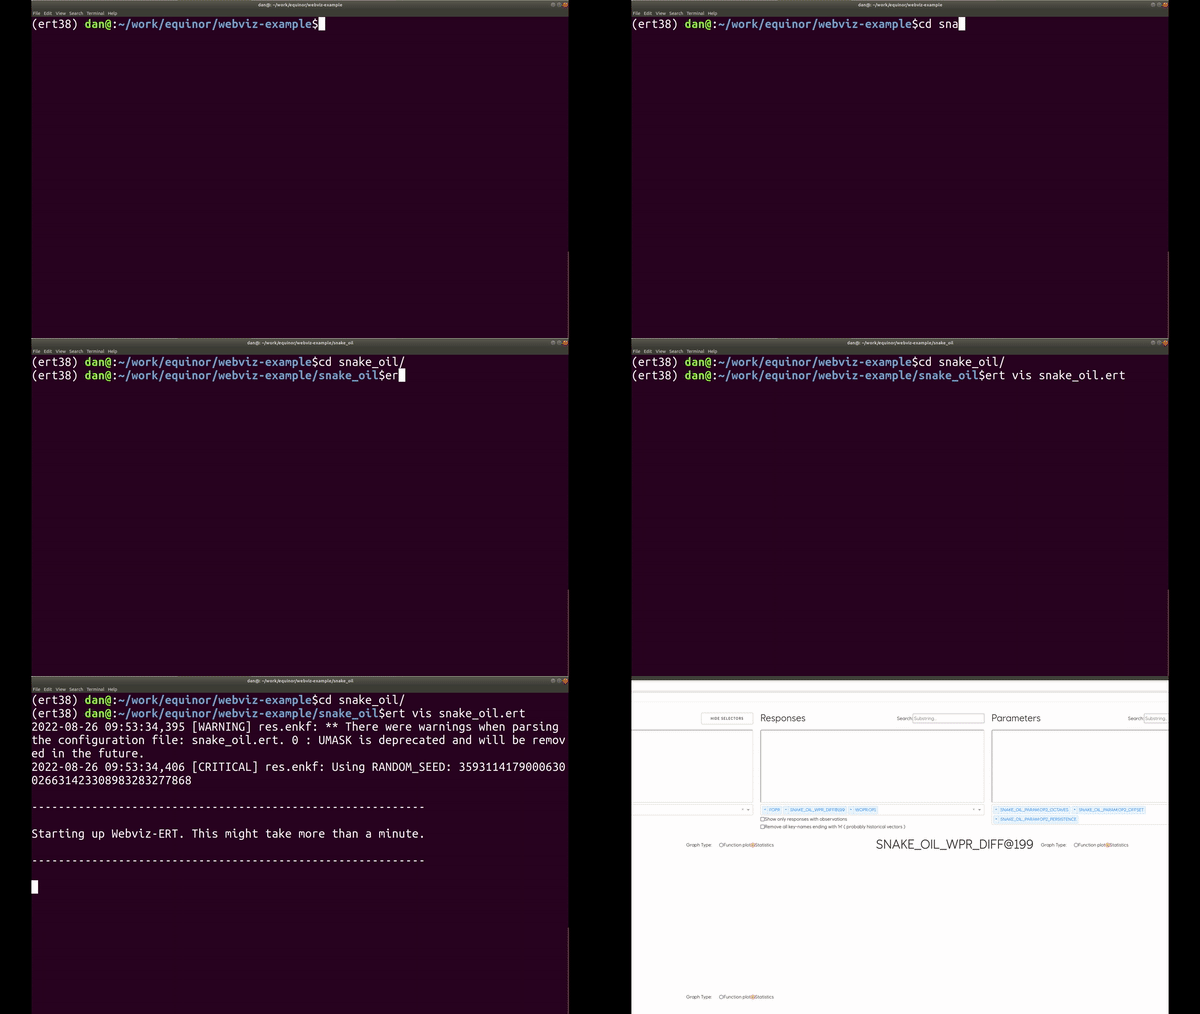
Webviz-ert connects automatically to a storage server running in ERT. Here are a few steps to get an example version of webviz-ert running.
# Run simulations in ert - <ert-root-folder>/test-data/local/poly_example/
ert ensemble_smoother --target-case smoother poly.ert

# After simulation has finished, start webviz-ert from the same location with
ert vis

# Alternatively, you might have to supply the config file if you're using the
# classic ert storage solution:
ert vis poly.ert
Example
Start up
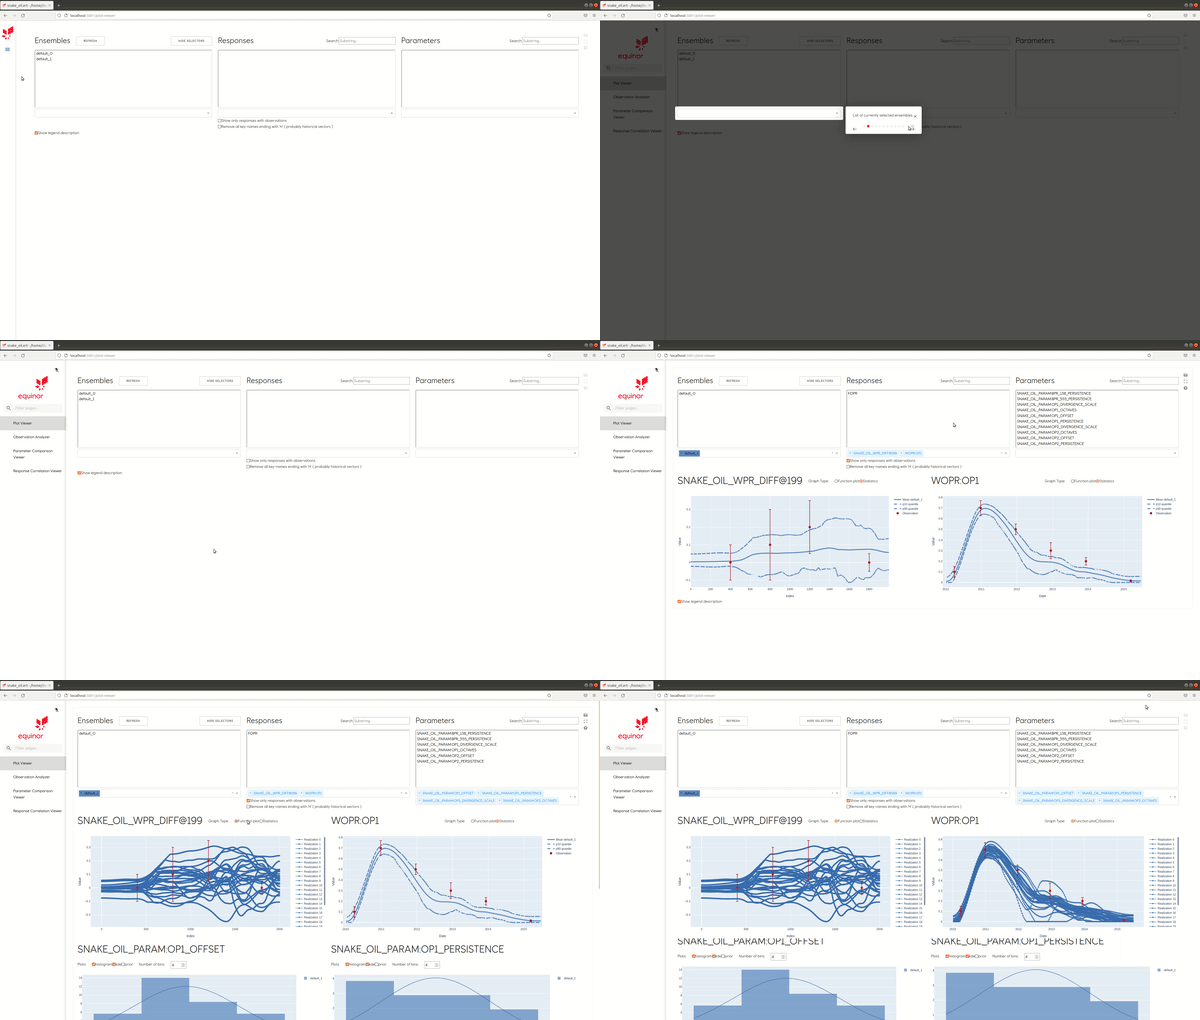
Plot viewer
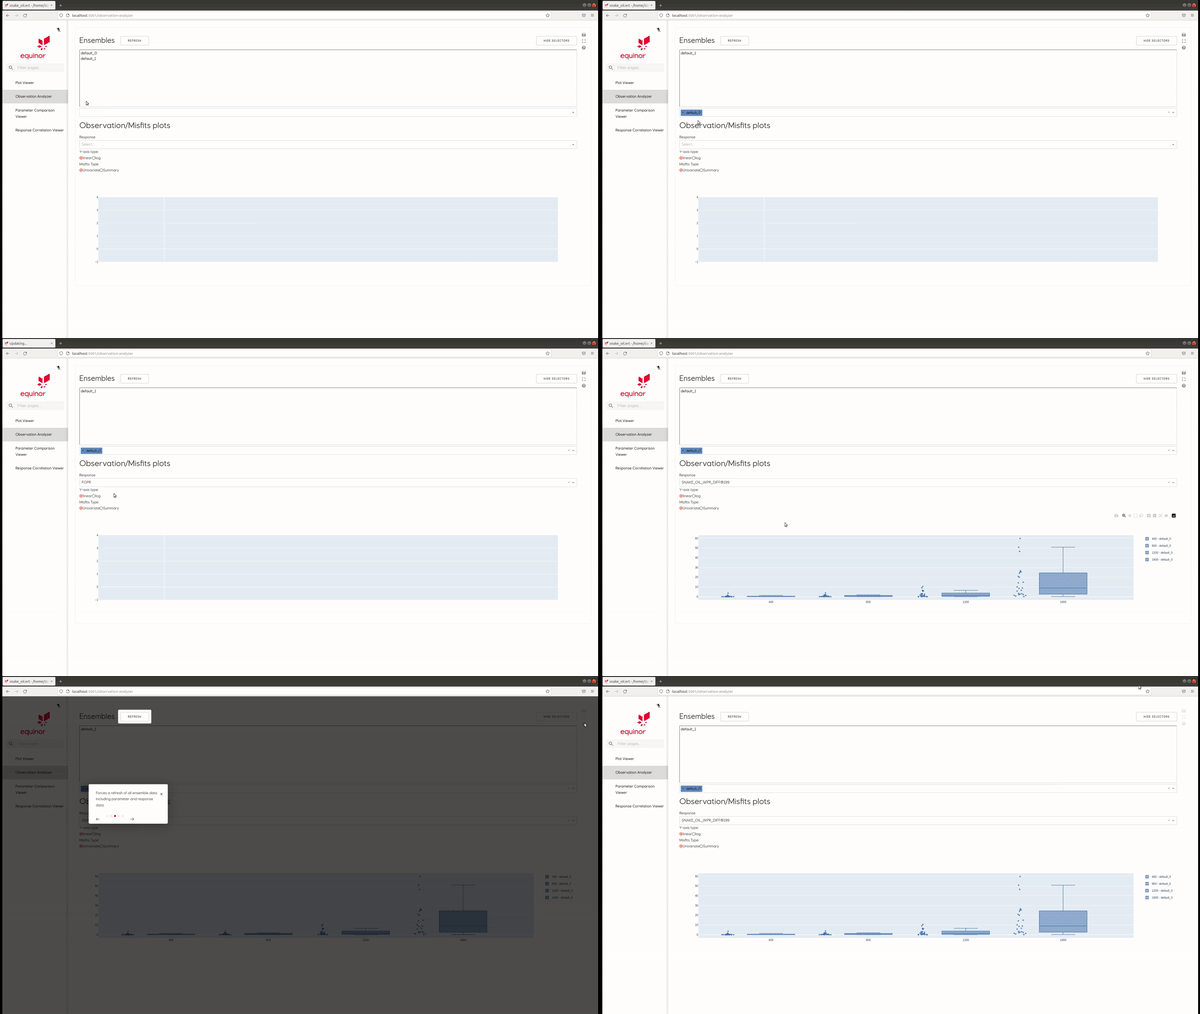
Observation Analyzer
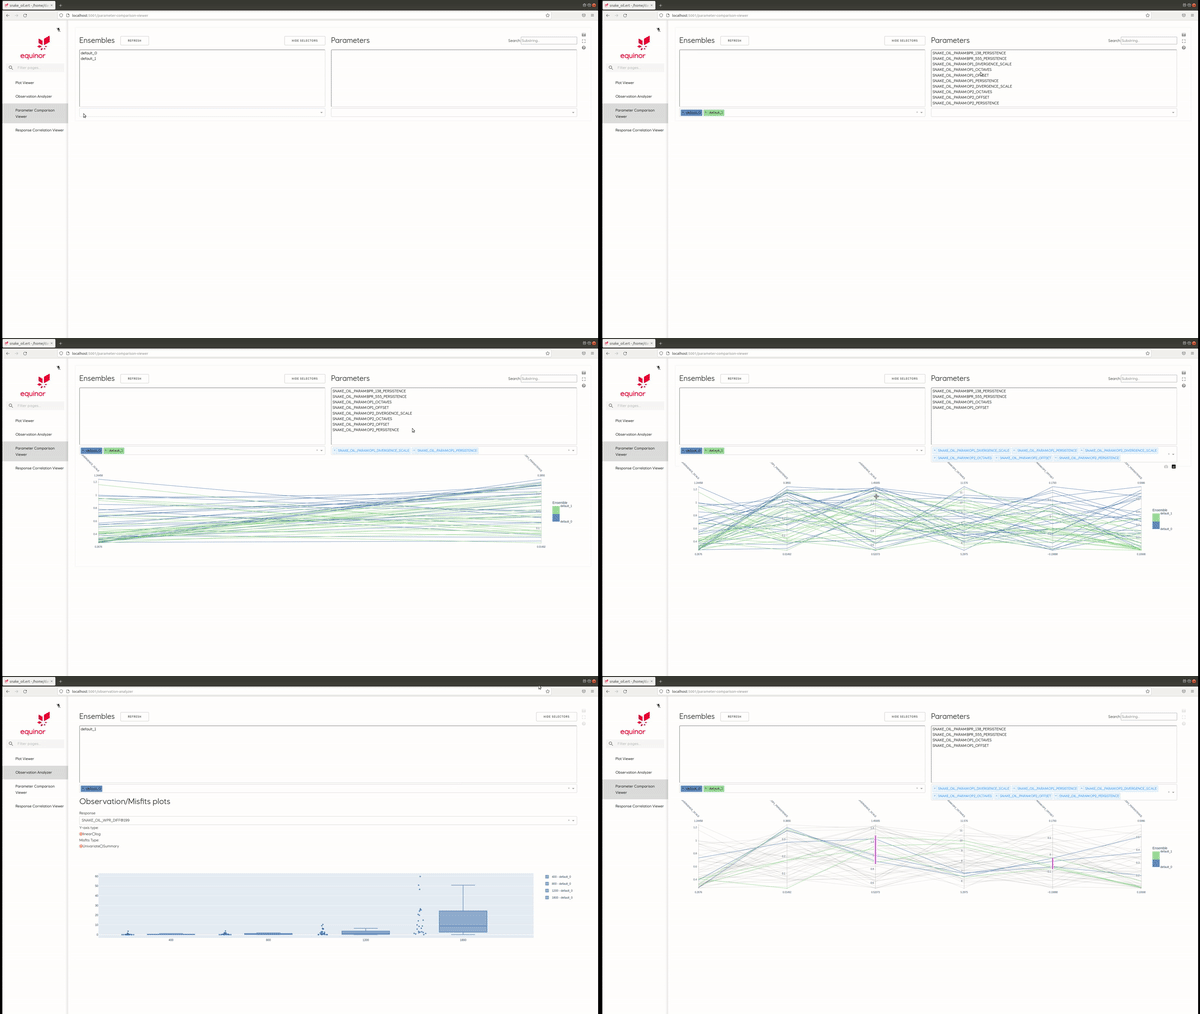
Parameter comparison
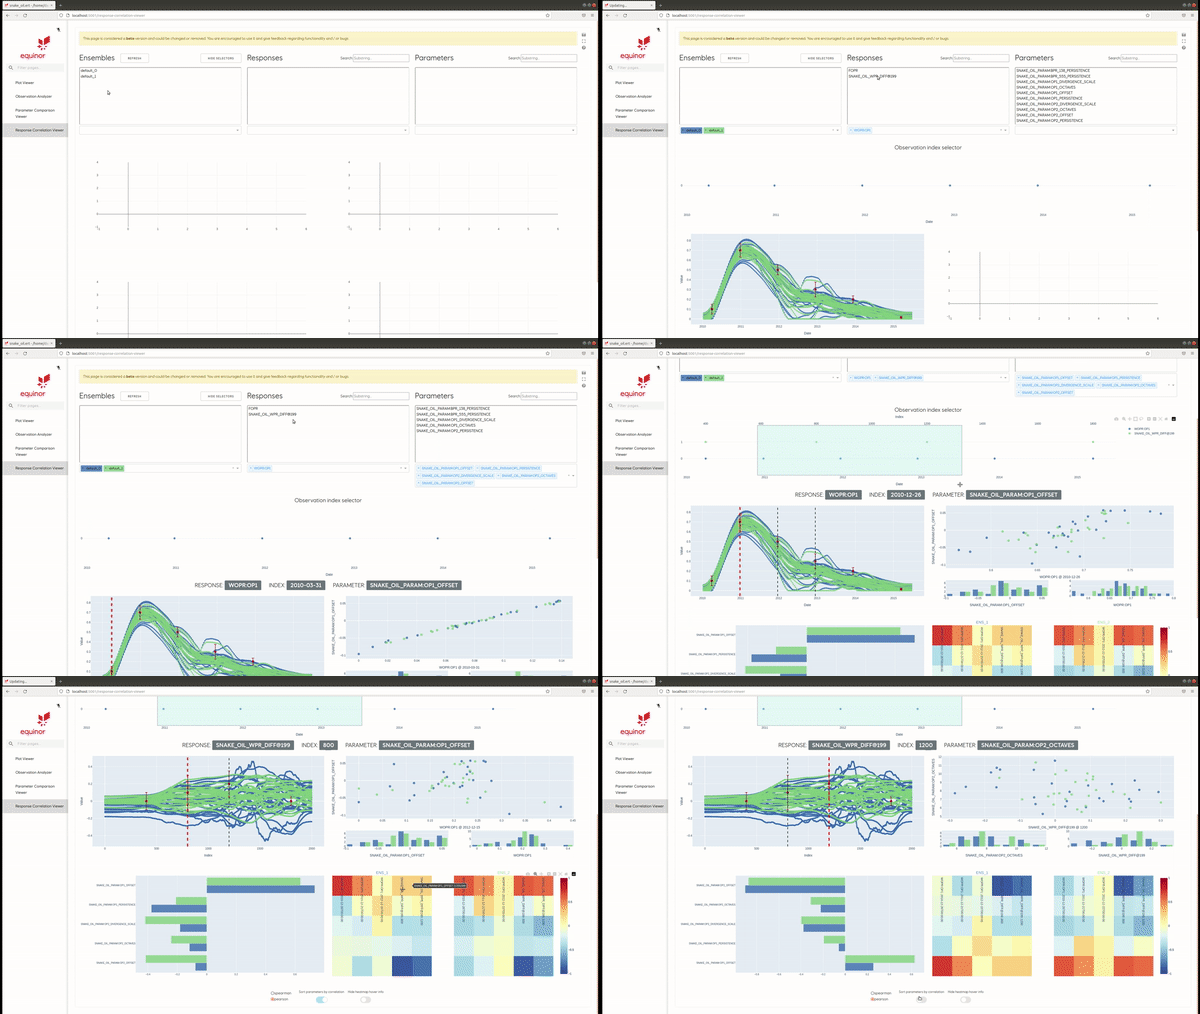
Response correlation
Project details
Release history Release notifications | RSS feed
Download files
Download the file for your platform. If you're not sure which to choose, learn more about installing packages.
Source Distribution
webviz-ert-0.5.10.tar.gz
(113.2 kB
view hashes)
Built Distribution
webviz_ert-0.5.10-py3-none-any.whl
(114.7 kB
view hashes)
Close
Hashes for webviz_ert-0.5.10-py3-none-any.whl
| Algorithm | Hash digest | |
|---|---|---|
| SHA256 | 68817041f941f7cda69171903dc1dcba93e44e1703c374c40c4fbbde565d24d8 |
|
| MD5 | 64d665786a4d5a7bd421feb3ca327ae6 |
|
| BLAKE2b-256 | 22e396ccd00cb404e77b49674470988591618672675b21ad4bb753c0698962d0 |


