Small library for creating and visualizing dot plot matrices

Project description
wotplot


wotplot is a small Python library for creating and visualizing dot plot matrices.
Notably, wotplot creates the exact dot plot matrix, describing (given some k ≥ 1) every single k-mer match between two sequences. Many tools for visualizing dot plots create only an approximation of this matrix (containing only the "best" matches) in order to save time; wotplot uses a few optimizations to make the creation and visualization of the exact dot plot matrix feasible even for entire prokaryotic genomes. Having this exact matrix can be useful for a variety of downstream analyses.
1. Quick examples
1.1. Small dataset
This example is adapted from Figure 6.20 (bottom right) in Bioinformatics Algorithms, edition 2.
import wotplot as wp

# Define our dataset
s1 = "AGCAGGAGATAAACCTGT"
s2 = "AGCAGGTTATCTACCTGT"
k = 3

# Create the matrix
m = wp.DotPlotMatrix(s1, s2, k)

# Convert the matrix to dense format and visualize it using matplotlib's
# imshow() function (for large matrices where dense representations are
# impractical, use viz_spy() instead; see below)
wp.viz_imshow(m)
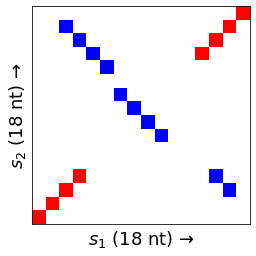
In the default colorscheme red cells (🟥) indicate forward matches, blue cells (🟦) indicate reverse-complementary matches, purple cells (🟪) indicate palindromic matches, and white cells (⬜) indicate no matches.
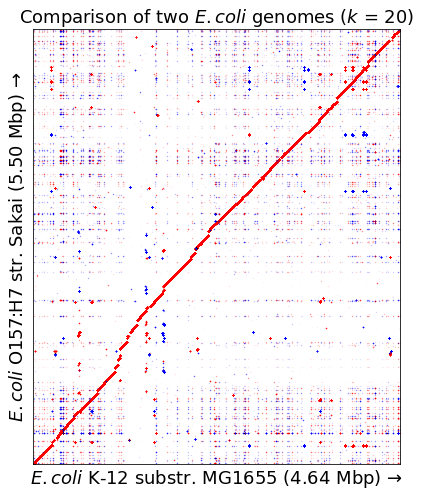
1.2. Larger dataset: comparing two E. coli genomes
Using E. coli K-12 (from this assembly) and E. coli O157:H7 (from this assembly). I removed the two plasmid sequences from the O157:H7 assembly.
import wotplot as wp

# (skipping the part where I loaded the genomes into memory as e1s and e2s...)

# Create the matrix
# This takes ~35 seconds on a laptop with 8 GB of RAM
em = wp.DotPlotMatrix(e1s, e2s, 20, verbose=True)

# Visualize the matrix using matplotlib's spy() function
# This takes ~1 second on a laptop with 8 GB of RAM
fig, ax = wp.viz_spy(em, markersize=0.01, title="Comparison of two $E. coli$ genomes ($k$ = 20)")
ax.set_xlabel(f"$E. coli$ K-12 substr. MG1655 ({len(e1s)/1e6:.2f} Mbp) \u2192")
ax.set_ylabel(f"$E. coli$ O157:H7 str. Sakai ({len(e2s)/1e6:.2f} Mbp) \u2192")
fig.set_size_inches(8, 8)
2. More detailed tutorial
Please see this Jupyter Notebook.
3. Installation
wotplot supports Python ≥ 3.6. You can install it and its dependencies using pip:
pip install wotplot
4. Performance
4.1. Optimizations made so far
I've tried to make this library reasonably performant. The main optimizations include:
-
We use the
pydivsufsortlibrary to find shared k-mers (corresponding to filled-in cells in the dot plot matrix). See below for details. -
We store the dot plot matrix in sparse format (courtesy of SciPy) in order to reduce its memory footprint.
-
We support visualizing the dot plot matrix's nonzero values using matplotlib's
spy()function, which (at least for large sequences) is faster and more memory-efficient than converting the matrix to a dense format and visualizing it with something likeimshow().
4.2. Two methods for finding shared k-mers
In order to create an exact dot plot comparing two sequences, we need to identify all pairs of shared k-mers between these sequences and their locations within these sequences. Doing this in a time- and space-efficient way is tricky.
wotplot supports two methods for finding shared k-mers, both of which rely on
the excellent pydivsufsort library:
-
Default: just uses
pydivsufsort.common_substrings()(faster, but requires more memory) -
"suff-only": uses
pydivsufsort.divsufsort()to compute suffix arrays, then iterates through them (slower, but requires less memory)
If you want to use the suff-only method, you can set suff_only=True when creating a
DotPlotMatrix object.
4.2.1. Details about these methods
So, I implemented the second method ("suff-only") first, way back in 2023. This method
uses pydivsufsort.divsufsort() (which in turn uses
libdivsufsort) to compute suffix arrays for
each of the input strings, then iterates through these suffix arrays simultaneously to
identify shared k-mers. The iterating-through-suffix-arrays part of this method (aka
the stuff that I wrote) is relatively simple, and could probably be made much more efficient.
More recently, I switched to using
pydivsufsort.common_substrings()
as the default method for identifying shared k-mers. It's much faster than the "suff-only"
method -- for example, computing the dot plot of the E. coli example shown above takes
~3 minutes with the suff-only method, but ~35 seconds with the common_substrings() method!
Howeever, I've noticed from benchmarking (see below) that the common_substrings() method
has higher memory requirements for long sequences than the suff-only method. For example,
on my laptop with 8 GB of RAM, wotplot using the common_substrings() method sometimes crashes when
creating dot plots of two 20 Mbp sequences (although, when it doesn't crash, it can create such
a dot plot in about 62 seconds). The peak memory usage from such a successful run
is ~5,823.75 MiB (aka ~6.11 GB).
wotplot using the suff-only method, for comparison, can create a dot plot of two 150 Mbp (!) sequences on the same laptop -- with peak memory usage of ~2,318.79 MiB (aka ~2.43 GB). The downside is that it is slow; creating this massive dot plot takes over an hour.
Anyway -- for most use cases, I think common_substrings() will be a better choice, so
I'm leaving it as the default. However, if you are working with long sequences on
low-memory systems, you may need to use the suff-only method.
4.2.2. When should I use one method or another?
It depends on how much memory your system has and how long your sequences are. Speaking very generally, assuming you are on a system with ~8 GB RAM, the default method should be fine up until your sequences are ~5-10 Mbp each. At that point, if you are okay with taking a longer time to create your dot plots, you may want to use the suff-only method (or at least think about it, in case you eventually start running out of memory).
(If you need to create dot plots of (i) very long sequences (ii) on a low-memory system and (iii) you need to do it as quickly as possible, this library might not be ideal -- since it is creating the exact dot plot matrix. Using a tool that creates a less granular dot plot might better meet your needs.)
4.3. Informal benchmarking
4.4. Some ideas for improving performance
I've documented a few ideas in issue #2. Right now this library is fast enough for my purposes, but feel free to open an issue / make a pull request if you'd like to speed it up :)
5. Okay but like why does this library exist
-
This library separates the creation and visualization of dot plot matrices. Other tools that I tried produced pretty visualizations, but didn't give me easy access to the underlying matrix.
-
I wanted something that worked well with matplotlib, so that I could create and tile lots of dotplots at once in complicated ways.
6. Limitations
-
Performance: Although I've tried to optimize this tool (see above), it definitely isn't the fastest or the most memory-efficient way to visualize dot plots. The two obvious reasons for this are that (1) this is written in Python, and (2) this is creating the exact dot plot matrix rather than a subset of it.
-
Only static visualizations: The visualization methods included in the tool only support the creation of static plots. There are ways to make matplotlib visualizations interactive (e.g. using
%matplotlib notebookwithin a Jupyter Notebook, or with thepyplot.show()GUI), but (1) I don't know enough about these methods to "officially" support them and (2) these visualizations will still probably pale in comparison to the outputs of dedicated interactive visualization software (e.g. ModDotPlot).
7. Setting up a development environment
First, fork wotplot -- this will make it easy to submit a pull request later.
After you've forked wotplot, you can download a copy of the code from your fork and install wotplot from this downloaded code. The following commands should do this; note that these commands assume (1) that you're using a Unix system and (2) that you have Python ≥ 3.6 and pip installed.
git clone https://github.com/your-github-username-goes-here/wotplot.git
cd wotplot
pip install -e .[dev]
After the above commands, you can check that wotplot was installed successfully by running its test suite:
make test
8. Acknowledgements
The small example given above, and my initial implementation of an algorithm for computing dot plots, were based on Chapter 6 of Bioinformatics Algorithms (Compeau & Pevzner).
The idea of using suffix arrays to speed up dot plot computation is not new; it
is also used in Gepard
(Krumsiek et al. 2007).
(Eventually I moved from directly using suffix arrays to just using the
pydivsufsort.common_substrings() algorithm, at least as the default algorithm; although
that is still using a suffix array under the hood :)
8.1. Dependencies
8.3. Testing dependencies
9. Contact
Feel free to open an issue if you have questions, suggestions, comments, etc.


Download files
Download the file for your platform. If you're not sure which to choose, learn more about installing packages.
Source Distribution
Built Distribution
Filter files by name, interpreter, ABI, and platform.
If you're not sure about the file name format, learn more about wheel file names.
Copy a direct link to the current filters
File details
Details for the file wotplot-0.4.0.tar.gz.
File metadata
- Download URL: wotplot-0.4.0.tar.gz
- Upload date:
- Size: 21.1 kB
- Tags: Source
- Uploaded using Trusted Publishing? No
- Uploaded via: twine/3.8.0 pkginfo/1.9.6 readme-renderer/34.0 requests/2.27.1 requests-toolbelt/1.0.0 urllib3/1.26.16 tqdm/4.64.1 importlib-metadata/4.2.0 keyring/23.4.1 rfc3986/1.5.0 colorama/0.4.5 CPython/3.6.13
File hashes
| Algorithm | Hash digest | |
|---|---|---|
| SHA256 |
1c11c94b3ccf5408f39b01544b9c81e1d527370ded24a5ba08fec5d432402afe
|
|
| MD5 |
3ea5f5864240a15655ae33da7192fa8f
|
|
| BLAKE2b-256 |
76bb21e0f92b809790b2caa974d26b2bd6d520f092600245ba355304fb6b2800
|
File details
Details for the file wotplot-0.4.0-py3-none-any.whl.
File metadata
- Download URL: wotplot-0.4.0-py3-none-any.whl
- Upload date:
- Size: 23.0 kB
- Tags: Python 3
- Uploaded using Trusted Publishing? No
- Uploaded via: twine/3.8.0 pkginfo/1.9.6 readme-renderer/34.0 requests/2.27.1 requests-toolbelt/1.0.0 urllib3/1.26.16 tqdm/4.64.1 importlib-metadata/4.2.0 keyring/23.4.1 rfc3986/1.5.0 colorama/0.4.5 CPython/3.6.13
File hashes
| Algorithm | Hash digest | |
|---|---|---|
| SHA256 |
c3364f6642da27cb87c7bfa06259cf7d4b67b3fe1c59e1702f20dfc549b2610f
|
|
| MD5 |
0623b5b39903f63d33a22520c65bd22a
|
|
| BLAKE2b-256 |
30c94a606faefe86b4828eebd906d5e5331ed104ccdda0d62ab6a41d29e07a8c
|


