





DaSPi — Process Analytics & Six Sigma in Python
DaSPi helps engineers analyze and improve processes using statistical workflows.
🎯 The Problem
Process analysis in practice is fragmented:
- Excel is error-prone and hard to scale
- Minitab / JMP are expensive and closed
- Python tools (pandas, scipy, statsmodels) are powerful but disconnected
👉 Engineers spend more time combining tools than improving processes.
✅ The Solution
DaSPi provides integrated workflows for process analytics:
- Capability analysis (Cp, Cpk)
- Root cause analysis (ANOVA, regression)
- Statistical process control (SPC)
- Professional visualization
All in one consistent and intuitive interface.
🚀 Three Flagship Workflows
DaSPi provides three ready-to-use workflows that cover the most common process analysis tasks. Each workflow produces visual output + interpretation in under 20 lines of code.
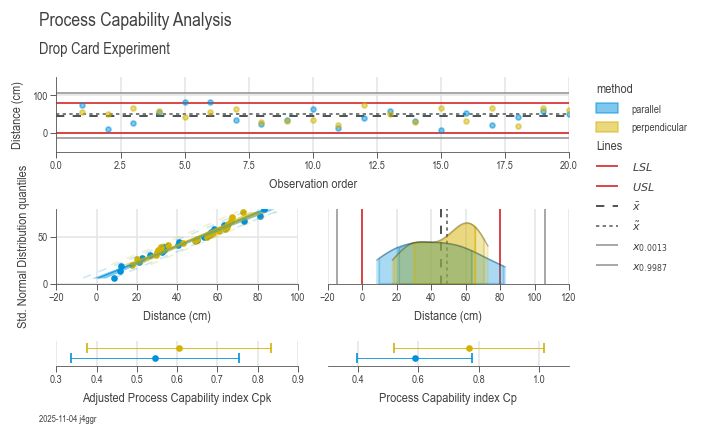
📊 Workflow 1: Process Capability Analysis
Evaluate if your process meets specifications.
import daspi as dsp

# Load data
df = dsp.load_dataset("drop_card")
spec_limits = dsp.SpecLimits(0, float(df.loc[0, "usl"]))

# Analyze capability
chart = dsp.ProcessCapabilityAnalysisCharts(
    source=df,
    target="distance",
    spec_limits=spec_limits,
    hue="method"
).plot().stripes().label(info=True)

chart.show()
Output: 5-panel analysis with Cp, Cpk, Pp, Ppk, distribution plots, and statistical interpretation.
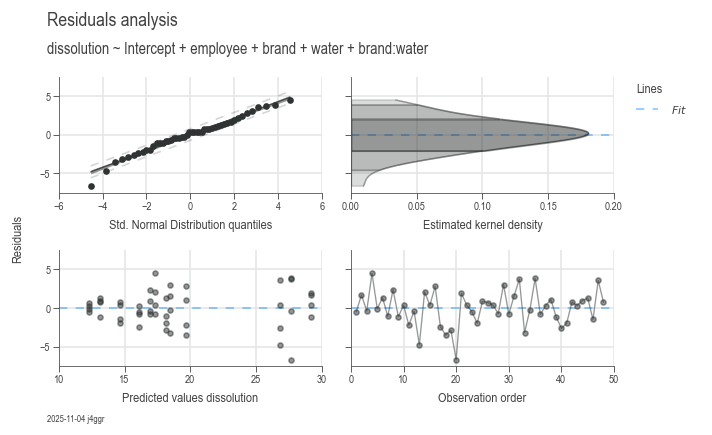
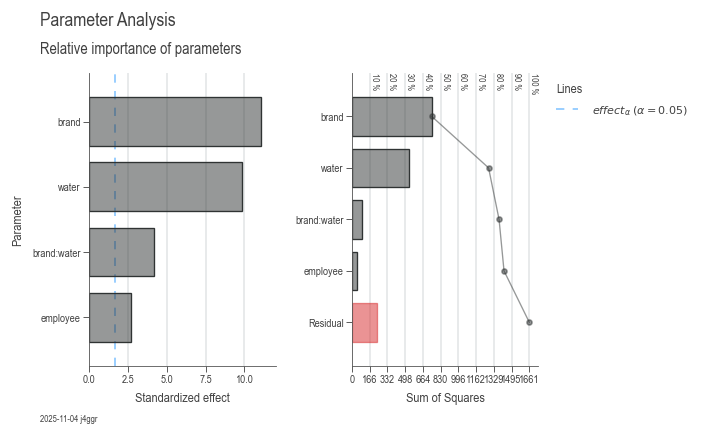
🔍 Workflow 2: Root Cause Analysis
Identify which factors significantly impact your process.
import daspi as dsp

# Load data
df = dsp.load_dataset("painkillers-dissolution")

# Fit model with automatic factor selection
model = dsp.LinearModel(
    source=df,
    target="dissolution",
    factors=["employee", "brand", "catalyst"],
    covariates=["temperature"]
)
model.recursive_elimination()

# Visualize results
dsp.ResidualsCharts(model).plot().stripes().label(info=True)
dsp.ParameterRelevanceCharts(model).plot().stripes().label(info=True)
Output: Residual diagnostics + parameter effects with ANOVA tables and significance tests.
📈 Workflow 3: Statistical Process Control (SPC)
Monitor process stability and detect out-of-control conditions.
import daspi as dsp

# Load process data
df = dsp.load_dataset("grnr_spc")

# Create control chart
chart = dsp.SingleChart(
    source=df,
    target="layer_thickness",
    feature="sample"
).plot(
    dsp.Scatter
).stripes(
    mean=True,
    control_limits=True,  # UCL/LCL at 3-sigma
    spec_limits=dsp.SpecLimits(lower=45, upper=55),
    agreement=3
).label(
    fig_title="SPC Chart: Layer Thickness",
    sub_title="Control limits at ±3σ",
    info=True
)

chart.show()
Output: Control chart with mean, control limits (UCL/LCL), specification limits, and trend analysis.
🏭 Use Cases
- Manufacturing: Monitor tolerances and reduce defects
- Quality Engineering: Automate Six Sigma DMAIC workflows
- Process Optimization: Identify key drivers of variation
- Data Analysts: Unify statistics and visualization in one tool
📊 Example Outputs
Process Capability Analysis
Root Cause Analysis (ANOVA)
Multivariate Visualization
🚀 Installation
pip install daspi
📚 Documentation
- User Guide — Complete tutorials for each workflow
- API Reference — Detailed documentation
- 3S Methodology — Structured problem-solving
🔧 Technical Features
- Centralized configuration — Manage language, username, and styles globally
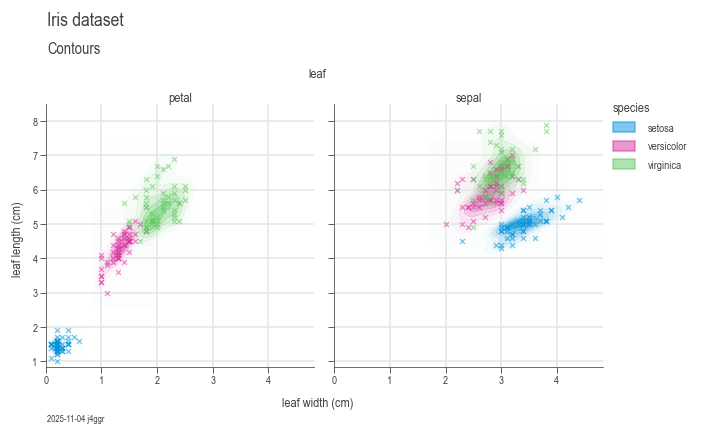
- Multivariate visualization — Explore complex relationships
- Linear models & ANOVA — Statistical inference made simple
- Hypothesis testing — Confidence intervals and p-values
- Monte Carlo simulation — Assess uncertainty
- Process capability — Cp, Cpk, Pp, Ppk calculations
⚙️ Built on Proven Libraries
DaSPi leverages the Python scientific stack:
- pandas — Data manipulation
- numpy — Numerical computing
- matplotlib — Visualization
- scipy — Statistical functions
- statsmodels — Advanced statistics
👤 About
DaSPi is created and maintained by Reto Jäggli, Data Scientist at Festo Microtechnology AG.
The project is driven by a passion to make process analytics and Six Sigma workflows more accessible in Python.
⚠️ Disclaimer
DaSPi is under active development and may contain bugs.
Results should be validated with trusted statistical tools when required.
🤝 Feedback & Contributions
If you use DaSPi in real-world process analysis:
👉 I would love to hear your use case.
Feedback, ideas, and contributions are very welcome.
1 maintainer

Metadata
1 maintainer
Release files for DaSPi 2.0.0
For a detailed explanation of source distributions (sdists) and built distributions (wheels), please see the package formats documentation.
Source distribution (sdist)
| File | Size | Uploaded | |
|---|---|---|---|
| daspi-2.0.0.tar.gz | 16.9 MB | Details |
Built distribution (wheel)
| File | Interpreter | ABI | Platform | Reset |
|---|---|---|---|---|
| daspi-2.0.0-py3-none-any.whl | Python 3 | none | any | Details |
Total release size: 17.2 MB
Release files / daspi-2.0.0.tar.gz
| Download URL | daspi-2.0.0.tar.gz |
|---|---|
| Size | 16.9 MB |
| Tags | Source |
|
SHA-256 checksum How to use checksums |
55e4da2e48076c64d0a0b749f97b264e12c09fd1e36729c08878935b5bcbe745
|
|
BLAKE2b-256 checksum How to use checksums |
939bf17785687df48d063f65d0a7be7572603eb7dd0e7227270c8cb04a9d8fe2
|
| Upload date | |
|
Uploaded using Trusted Publishing? What is trusted publishing? |
No |
| Uploaded via |
pdm/2.28.0 CPython/3.12.3 Windows/11
|
Release files / daspi-2.0.0-py3-none-any.whl
| Download URL | daspi-2.0.0-py3-none-any.whl |
|---|---|
| Size | 376.3 kB |
| Tags | Python 3 |
|
SHA-256 checksum How to use checksums |
8c248d9dfb4ec1e8991b19e304c160e5798a373060252e03d741785e6df51e22
|
|
BLAKE2b-256 checksum How to use checksums |
dc433405364e6c8b23232d7cc95946c19c675381b8904fd018128546a70ad402
|
| Upload date | |
|
Uploaded using Trusted Publishing? What is trusted publishing? |
No |
| Uploaded via |
pdm/2.28.0 CPython/3.12.3 Windows/11
|














