
Dash Tooltip
A module to add interactive editable tooltips to your Dash applications. Inspired by mplcursors and Matlab's datatip.
Installation
You can download the dash_tooltip.py module and place it in your working directory.
Basic Usage
import numpy as np
import plotly.express as px
from dash import Dash, dcc, html
from dash.dependencies import Input, Output
from dash_tooltip import tooltip

# Sample Data
np.random.seed(20)
y1 = np.random.normal(0, 10, 50)
x1 = np.arange(0, 50)
fig1 = px.scatter(x=x1, y=y1)
fig1.update_layout(title_text="Editable Title", title_x=0.5)

app1 = Dash(__name__)

#makes graph items, including tooltips editable
app1.layout = html.Div([
    dcc.Graph(
        id='graph1',
        figure=fig1,
        config={
            'editable': True,
            'edits': {
                'shapePosition': True,
                'annotationPosition': True
            }
        }
    )
])

# Add the tooltip functionality to the app
tooltip(app1)
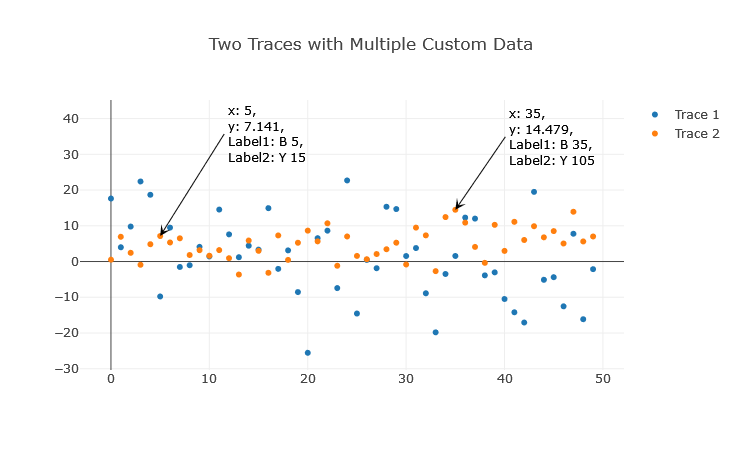
Click on data points to add tooltips.
If dcc.Graph is configured editatble, tolltips:
- can be dragged around
- text can be edited on click
- can be deleted: click, delete text, enter. In some occasions a tooltip arrow may remain due to a Dash bug (clientside_callback not firing). In this cas, click near arrow end (mouse cursor changes to pointer), enter some text and repeat deletion and enter.
Advanced Usage
If you want to customize the tooltips, hover templates, and more:
import pandas as pd
import numpy as np
import plotly.express as px
from dash import Dash, dcc, html
from dash.dependencies import Input, Output
from dash_tooltip import tooltip

# Generate random time series data
date_rng = pd.date_range(start='2020-01-01', end='2020-12-31', freq='h')
ts1 = pd.Series(np.random.randn(len(date_rng)), index=date_rng)
ts2 = pd.Series(np.random.randn(len(date_rng)), index=date_rng)
df = pd.DataFrame({'Time Series 1': ts1, 'Time Series 2': ts2})

template = "x: %{x}<br>y: %{y}<br>ID: %{pointNumber}<br>name: %{customdata[0]}<br>unit: %{customdata[1]}"
fig10 = px.line(df, x=df.index, y=df.columns, title="Time Series Plot")

for i, trace in enumerate(fig10.data):
    trace.customdata = np.column_stack((np.repeat(df.columns[i], len(df)), np.repeat('#{}'.format(i+1), len(df))))
    trace.hovertemplate = template

app10 = Dash(__name__)

app10.layout = html.Div([
    dcc.Graph(
        id="graph-id",
        figure=fig10,
        config={
            'editable': True,
            'edits': {
                'shapePosition': True,
                'annotationPosition': True
            }
        }
    )
])

tooltip(app10, graph_ids=["graph-id"], template=template, debug=True)
Custom Styling
custom_config = {
    'text_color': 'red',
    'arrow_color': 'blue',
    'arrow_size': 2.5,
    # ... any other customization
}
tooltip(app10, graph_ids=["graph-id"], template=template, debug=True, **custom_config)
For more examples, refer to the provided dash_tooltip_demo.py or its Jupyter counterpart dash_tooltip_demo.ipynb.
Debugging
If you encounter any issues or unexpected behaviors, enable the debug mode by setting the debug argument of the tooltip function to True. The log outputs will be written to dash_app.log in the directory where your script or application is located.
License
This project is licensed under the MIT License. See the LICENSE file for details.
Acknowledgements
- Inspired by
mplcursorsand Matlab'sdatatip.
1 maintainer

Metadata
1 maintainer
Release files for Dash_tooltip 0.3.2
For a detailed explanation of source distributions (sdists) and built distributions (wheels), please see the package formats documentation.
Source distribution (sdist)
| File | Size | Uploaded | |
|---|---|---|---|
| Dash_tooltip-0.3.2.tar.gz | 23.9 kB | Details |
Built distribution (wheel)
| File | Interpreter | ABI | Platform | Reset |
|---|---|---|---|---|
| Dash_tooltip-0.3.2-py3-none-any.whl | Python 3 | none | any | Details |
Total release size: 48.4 kB
Release files / Dash_tooltip-0.3.2.tar.gz
| Download URL | Dash_tooltip-0.3.2.tar.gz |
|---|---|
| Size | 23.9 kB |
| Tags | Source |
|
SHA-256 checksum How to use checksums |
026321c1e6078cd13d378ad2105d531fce449fbb3f4dff3ab714e553ccdef8bc
|
|
BLAKE2b-256 checksum How to use checksums |
2669127d839f6d5851ded800a191e1877ba1b432178f06408c02115d8effd4a8
|
| Upload date | |
|
Uploaded using Trusted Publishing? What is trusted publishing? |
No |
| Uploaded via |
twine/4.0.2 CPython/3.11.4
|
Release files / Dash_tooltip-0.3.2-py3-none-any.whl
| Download URL | Dash_tooltip-0.3.2-py3-none-any.whl |
|---|---|
| Size | 24.5 kB |
| Tags | Python 3 |
|
SHA-256 checksum How to use checksums |
ea04acb3919a6cc8f98340a88bf13930487fa0ab7c70a2a8f0f45f162f3888f6
|
|
BLAKE2b-256 checksum How to use checksums |
b0a07a14605388897b33a4bc6e2f74760bc4239d953ec4bda37399895f2bcfbf
|
| Upload date | |
|
Uploaded using Trusted Publishing? What is trusted publishing? |
No |
| Uploaded via |
twine/4.0.2 CPython/3.11.4
|














