




Dash Tooltip
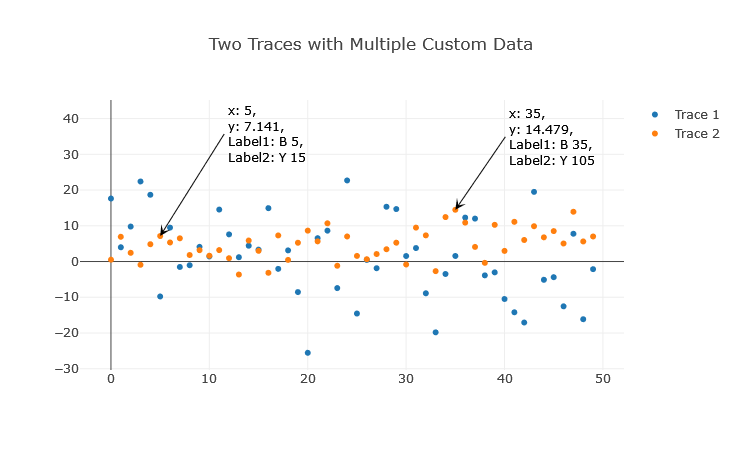
A module to add interactive editable tooltips to your Dash applications. Inspired by mplcursors and Matlab's datatip.
Installation
pip install dash-tooltip
Build And Publish
Versions are derived from Git tags by setuptools-scm; do not edit a version number in
pyproject.toml. A clean vX.Y.Z tag produces version X.Y.Z. Commits after a tag
produce development versions, with a local suffix for the commit and dirty working tree.
For development, run uv sync --group dev before importing from a fresh checkout.
The build generates dash_tooltip/_version.py, which is ignored by Git and exposes
dash_tooltip.__version__. An unbuilt checkout without that file reports 0+unknown;
this is only a runtime placeholder and is never used as the distribution version.
For a release, commit all release changes, create a vX.Y.Z tag, and build from that
clean tagged checkout. Use uv for local builds and publishing:
# Build source distribution and wheel into dist/
uv build

# Install the built wheel locally
uv pip install dist/*.whl

# Publish to PyPI
uv publish
Source distributions retain their version when rebuilt without Git. Arbitrary source copies without Git history or source-distribution metadata cannot determine a version and fail to build. See the release guide for the release steps.
Basic Usage
import numpy as np
import plotly.express as px
from dash import Dash, dcc, html
from dash.dependencies import Input, Output
from dash_tooltip import tooltip

# Sample Data
np.random.seed(20)
y1 = np.random.normal(0, 10, 50)
x1 = np.arange(0, 50)
fig1 = px.scatter(x=x1, y=y1)
fig1.update_layout(title_text="Editable Title", title_x=0.5)

app1 = Dash(__name__)

#makes graph items, including tooltips editable
app1.layout = html.Div([
    dcc.Graph(
        id='graph1',
        figure=fig1,
        config={
            'editable': True,
            'edits': {
                'shapePosition': True,
                'annotationPosition': True
            }
        }
    )
])

# Add the tooltip functionality to the app
tooltip(app1)
Click on data points to add tooltips.
If dcc.Graph is configured editatble, tolltips:
- can be dragged around
- text can be edited on click
- can be deleted: click, delete text, enter. In some occasions a tooltip arrow may remain due to a Dash bug (clientside_callback not firing). In this cas, click near arrow end (mouse cursor changes to pointer), enter some text and repeat deletion and enter.
Advanced Usage
If you want to customize the tooltips, hover templates, and more:
import pandas as pd
import numpy as np
import plotly.express as px
from dash import Dash, dcc, html
from dash.dependencies import Input, Output
from dash_tooltip import tooltip

# Generate random time series data
date_rng = pd.date_range(start='2020-01-01', end='2020-12-31', freq='h')
ts1 = pd.Series(np.random.randn(len(date_rng)), index=date_rng, name='Time Series 1')
ts2 = pd.Series(np.random.randn(len(date_rng)), index=date_rng, name='Time Series 2')
df = pd.DataFrame({ts1.name: ts1, ts2.name: ts2})

# Define the hover and tooltip template
# name is only compatible with tooltip
template = "name:%{name}<br>META0: %{meta[0]}<br>META1: %{meta[1]}<br>x: %{x}<br>y: %{y:.2f}<br>pointNumber: %{pointNumber}<br>customdata0: %{customdata[0]}<br>customdata1: %{customdata[1]}"

# Create a line plot
fig10 = px.line(df, x=df.index, y=df.columns, title="Time Series Plot")

# Apply metadata and custom data to each trace
for i, trace in enumerate(fig10.data):
    # Applying different metadata to each trace
    trace.meta = [f"META{i}0", f"META{i}1"]

    # Setting customdata for each point in the trace, for use in the hover template
    trace.customdata = np.array([[f"Series {i+1}", f'Point {j+1}'] for j in range(len(df))])

    # Setting the hover template
    trace.hovertemplate = template

app10 = Dash(__name__)

app10.layout = html.Div([
    dcc.Graph(
        id="graph-id",
        figure=fig10,
        config={
            'editable': True,
            'edits': {
                'shapePosition': True,
                'annotationPosition': True
            }
        }
    )
])

tooltip(app10, graph_ids=["graph-id"], template=template, debug=True)
app10.run(port=8082)
Tooltip Templates with Formatting
Tooltips can be formatted using templates similar to Plotly's hovertemplates. The tooltip template allows custom formatting and the inclusion of text and values.
For example, you can use a template like "%{name}<br>%{meta[0]}<br>x: %{x:.2f}<br>y: %{y:.2f}" to display the track name, meta[0] from a list of text data, plus x and y values with two decimal places. Note that name key is not available in the Plotly hover template, but is displayed by default.
Refer to Plotly’s documentation on hover text and formatting for more details on how to construct and customize your tooltip templates.
Custom Styling
custom_style = {
        "font": {"size": 12, "color":"red"},
        "arrowcolor": "red",
        'arrowsize': 5,
        # ... any other customization
    }
tooltip(app10, style=custom_style, graph_ids=["graph-id"], template=template, debug=True)
For more examples, refer to the provided dash_tooltip_demo.py and check out Plotly’s Text and Annotations documentation, which provides a wealth of information on customizing the appearance of annotations.
Refer to the Plotly Annotation Reference for a comprehensive guide on available styling attributes and how to apply them.
Template updating
Tooltip content can be updated to match with selected data in a dynamic Dash app:
GRAPH_ID = "scatter-plot16a"

# Sample DataFrame with DatetimeIndex
date_range = pd.date_range(start="2025-01-01", periods=5)
df = pd.DataFrame(
    {
        "x": [1, 2, 3, 4, 5],
        "y": [2, 4, 6, 8, 10],
        "z": [3, 6, 9, 12, 15],
        "a": [4, 8, 12, 16, 20],
        "b": [5, 10, 15, 20, 25],
    },
    index=date_range,
)

# Initialize the Dash app
app16 = dash.Dash(__name__)

# Define the layout
app16.layout = html.Div(
    [
        html.Label("Select X and Y columns:"),
        dcc.Dropdown(
            id="x-column",
            options=[{"label": col, "value": col} for col in df.columns],
            placeholder="Select X axis data",
        ),
        dcc.Dropdown(
            id="y-column",
            options=[{"label": col, "value": col} for col in df.columns],
            placeholder="Select Y axis data",
        ),
        dcc.Graph(
            id=GRAPH_ID,
            style={"width": "600px", "height": "600px"},
            config={
                "editable": True,
                "edits": {"shapePosition": True, "annotationPosition": True},
            },
        ),
    ]
)

# Create a tooltip instance
tooltip_instance16 = tooltip(app16, graph_ids=[GRAPH_ID])

# Define callback to update the scatter plot
@app16.callback(
    Output(GRAPH_ID, "figure", allow_duplicate=True),
    [Input("x-column", "value"), Input("y-column", "value")],
    prevent_initial_call=True,
)
def update_scatter_plot(x_column, y_column):
    if not x_column or not y_column:
        raise PreventUpdate  # Prevent update if either dropdown is not selected

    non_selected_columns = [
        col for col in df.columns if col not in [x_column, y_column]
    ]
    customdata = df[non_selected_columns].apply(
        lambda row: "<br>".join(
            f"{col}: {val}" for col, val in zip(non_selected_columns, row)
        ),
        axis=1,
    )
    # gives (depending on selected entries):
    # 2022-01-01     x: 1<br>z: 3<br>b: 5
    # 2022-01-02     x: 2<br>z: 6<br>b: 10
    # ...

    # New template, to match selected data entries
    template = (
        "<b>Date</b>: %{customdata}<br>"
        + f"<b>{x_column}: %{{x}}<br>"
        + f"{y_column}: %{{y}}</b><br>"
    )
    # gives (depending on selected entries):
    # <b>Date</b>: %{customdata}<br><b>x: %{x}<br><b>a</b>: %{y}<br>

    # Update template for new tooltips
    tooltip_instance16.update_template(graph_id=GRAPH_ID, template=template)

    trace = go.Scatter(
        x=df[x_column],
        y=df[y_column],
        mode="markers",
        marker=dict(color="blue"),
        customdata=df.index.strftime("%Y-%m-%d %H:%M:%S") + "<br>" + customdata,
        # Include date and time with other data
        hovertemplate=template,
    )
    layout = go.Layout(
        title="Scatter Plot",
        xaxis=dict(title=x_column),
        yaxis=dict(title=y_column),
        hovermode="closest",
        height=800,
        width=800,
    )
    return {"data": [trace], "layout": layout}


# Run the app
if __name__ == "__main__":
app16.run(debug=False, port=8196)
Handling Log Axes
Plotly's annotation coordinate convention requires logarithmic coordinates on log axes: a point at y=100 needs an annotation anchor at y=2. By default, tooltip(..., apply_log_fix=True) performs this conversion for new tooltips while retaining the original data values in their text. The module reads the current figure's axis types on each click, including after update_yaxes(type="log") or update_xaxes(type="log").
Setting apply_log_fix=False deliberately disables conversion and can produce misplaced annotations on log axes, as demonstrated by demo 15. Nonpositive or nonfinite coordinates on a log axis are skipped with a warning when conversion is enabled.
Existing annotations are not converted when an axis type changes. This support covers tooltips added after the change; remove existing tooltips before switching scales if their anchors must remain aligned with the data.
Demo and Test Mapping
Numbered pytest modules correspond to cases in dash_tooltip_demo.py. Tests without a corresponding demo use descriptive names without numbers. A matching test covers the listed behavior; it does not execute the notebook cell itself.
| Demo | Behavior | Automated coverage in tests/ |
|---|---|---|
| 1 | Single trace, editable annotations | test_1_tooltip_function.py, test_1_go_scatter.py, test_1_tooltip_removal.py |
| 2 | Custom data, styles, formatting | test_2_tooltip_configuration.py, test_2_template_formatting.py |
| 3 | Multiple traces | Manual demo only |
| 4 | Multiple traces with custom data | Manual demo only |
| 5 | Toggle tooltip functionality | Manual demo only |
| 6 | Multiple custom-data fields | Manual demo only |
| 7 | Enable tooltips on selected graphs | Manual demo only |
| 8 | Tooltips on multiple graphs | test_8_multiple_graph.py |
| 9 | Noneditable resampled time series | Manual demo only |
| 10 | Editable resampled time series | Manual demo only |
| 11 | Resampler wrapper | Manual demo only |
| 12 | Resampled 2x2 subplots | Manual demo only |
| 13 | Figure dictionary supplied to dcc.Graph |
test_13_direct_figure_in_dcc_graph.py |
| 14 | Static log axes with conversion enabled | Shared coordinate/callback tests in test_log_axis_coordinates.py; subplot/resampler rendering is manual |
| 15 | Static log axes with conversion disabled | Shared coordinate/callback tests in test_log_axis_coordinates.py; intentionally misplaced rendering is manual |
| 16 | Update tooltip template | test_16_update_template.py |
| 17 | Add tooltips after changing the y scale | test_17_log_axis_update.py, test_log_axis_coordinates.py |
Additional tests cover annotation relayout persistence, display/deduplication logic, invalid graph IDs, bar/line charts, and combinations of multiple graphs and subplots.
Run the unit tests and the demo 17 browser regression locally with the project environment:
.\.venv\Scripts\python.exe -m pytest tests/ -m "not selenium"
.\.venv\Scripts\python.exe -m pytest tests/test_17_log_axis_update.py --webdriver Firefox --headless
# Run all browser tests:
.\.venv\Scripts\python.exe -m pytest tests/ -m selenium --webdriver Firefox --headless
The Selenium tests require Firefox and a compatible geckodriver on PATH. Demo 17 checks both annotation coordinates and the rendered arrowhead's distance from the clicked marker. GitHub Actions continues to run the non-Selenium suite.
Debugging
If you encounter any issues or unexpected behaviors, enable the debug mode by setting the debug argument of the tooltip function to True. The log outputs will be written to dash_app.log in the directory where your script or application is located.
License
This project is licensed under the MIT License. See the LICENSE file for details.
Acknowledgements
- Inspired by
mplcursorsand Matlab'sdatatip.
1 maintainer

Metadata
1 maintainer
Release files for Dash_tooltip 0.6.0
For a detailed explanation of source distributions (sdists) and built distributions (wheels), please see the package formats documentation.
Source distribution (sdist)
| File | Size | Uploaded | |
|---|---|---|---|
| dash_tooltip-0.6.0.tar.gz | 496.9 kB | Details |
Built distribution (wheel)
| File | Interpreter | ABI | Platform | Reset |
|---|---|---|---|---|
| dash_tooltip-0.6.0-py3-none-any.whl | Python 3 | none | any | Details |
Total release size: 512.2 kB
Release files / dash_tooltip-0.6.0.tar.gz
| Download URL | dash_tooltip-0.6.0.tar.gz |
|---|---|
| Size | 496.9 kB |
| Tags | Source |
|
SHA-256 checksum How to use checksums |
2f15a385cfde82efd7c685ccd76ec51c4f0f795c35fcbe17ca08c2208eb7bd49
|
|
BLAKE2b-256 checksum How to use checksums |
f051a747116d63f5e81f2ca36adcb1e8f60b88ddfca762fe85afecdc47044550
|
| Upload date | |
|
Uploaded using Trusted Publishing? What is trusted publishing? |
No |
| Uploaded via |
uv/0.13.0 {"installer":{"name":"uv","version":"0.13.0","subcommand":["publish"]},"python":null,"implementation":{"name":null,"version":null},"distro":null,"system":{"name":null,"release":null},"cpu":null,"openssl_version":null,"setuptools_version":null,"rustc_version":null,"ci":null}
|
Release files / dash_tooltip-0.6.0-py3-none-any.whl
| Download URL | dash_tooltip-0.6.0-py3-none-any.whl |
|---|---|
| Size | 15.3 kB |
| Tags | Python 3 |
|
SHA-256 checksum How to use checksums |
5497e3fbbaf4bb97ccbb658dae4fb9bccbac46827dc4fdbc8dee6d224a37feea
|
|
BLAKE2b-256 checksum How to use checksums |
47c00c7c11726f99ffc5470393b79335c248825ad20c1d715e42913c7dca72dc
|
| Upload date | |
|
Uploaded using Trusted Publishing? What is trusted publishing? |
No |
| Uploaded via |
uv/0.13.0 {"installer":{"name":"uv","version":"0.13.0","subcommand":["publish"]},"python":null,"implementation":{"name":null,"version":null},"distro":null,"system":{"name":null,"release":null},"cpu":null,"openssl_version":null,"setuptools_version":null,"rustc_version":null,"ci":null}
|














