
adb: Agent Debugger
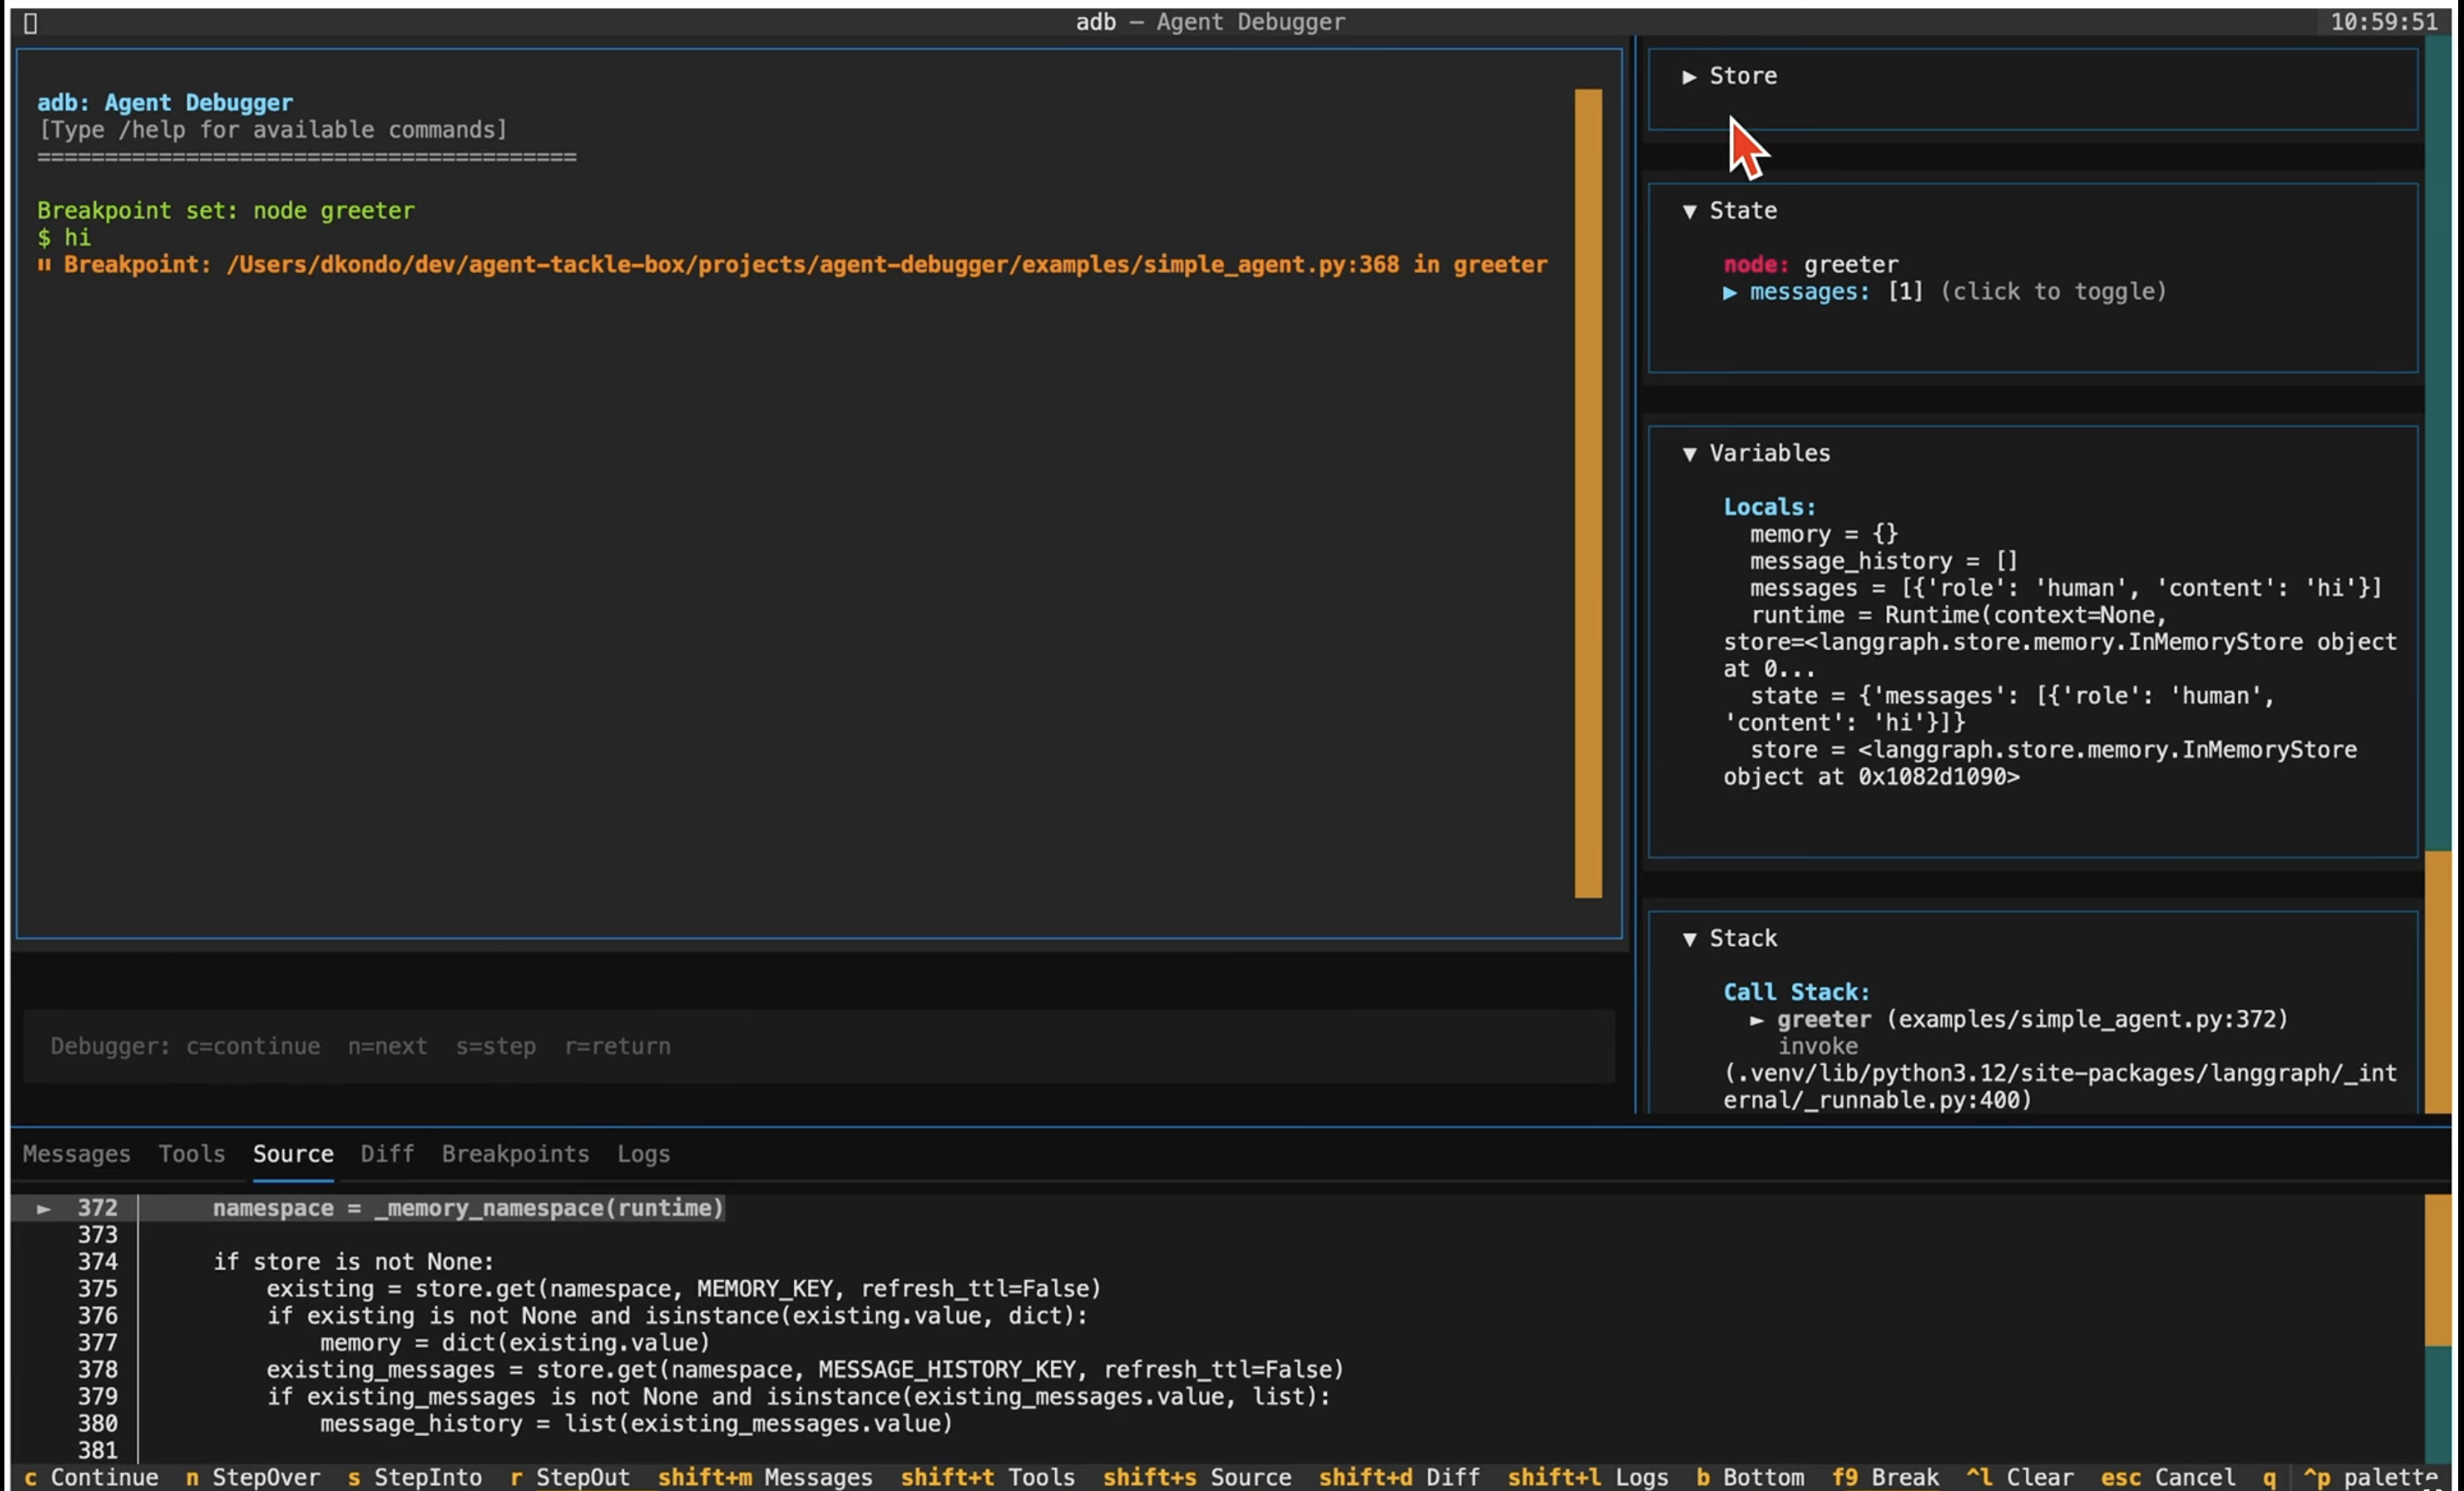
A terminal UI debugger that combines application-level agent inspection (state, memory, tool calls, messages) with Python-level debugging (breakpoints, stepping, variable inspection).
Features
- Application-level inspection: See agent state, messages, tool calls, state diffs
- Code-level debugging: Set breakpoints, step through code, inspect variables
- Agent-level "semantic" breakpoints: Break on node start, tool call, or state change
- Optional renderers/providers: Interfaces to render custom state, store, tools, chat output, and state mutation
- Drop-in breakpoints: Drop into the debugger from anywhere in your agent code with
breakpoint()statement
Motivation
An agent developer needs to answer two kinds of questions simultaneously:
-
Application-level: "How did state or memory change? What tools were called and how?"
-
Code-level: "Why did this node produce that output? What's in the local variables at line 42? Why did the conditional branch go left?"
When you stop at a breakpoint inside a node, you want to see both the Python locals and the graph-level context (which node, what triggered it, the full agent state).
The combined debugger adb makes "zoom in / zoom out" seamless
Also, adb enables generative debugging by providing interfaces and hooks for custom rendering of state, store, and chat output, and custom specification of inputs and state mutation.
The debugger is agent agnostic. The engineering design is based on an agent's event stream, and it extends Python’s standard-library debugger class (Bdb) .
The tool is released on pypi as agent-debugger.
Quick Start
# Install
uv add agent-debugger

# Debug a LangGraph agent script
adb run my_agent.py

# Attach to a specific graph object
adb attach my_module:graph

# Attach with optional renderers/providers
adb attach my_module:graph \
  --store-renderer my_mod:StoreRenderer \
  --state-renderer my_mod:StateRenderer \
  --output-renderer my_mod:ChatOutputRenderer \
  --tool-renderer my_mod:ToolRenderer \
  --state-mutator my_mod:StateMutator
Run from Source
# Create/update local env from this repo
uv sync --all-extras

# Run adb directly from source (project root)
uv run adb run examples/simple_agent.py

# Equivalent module invocation
uv run python -m agent_debugger.cli run examples/simple_agent.py
Without LiteLLM (default)
Uses deterministic, mock tool-calling responses — no API keys or network needed:
uv run adb run examples/simple_agent.py
With LiteLLM
Uses a real LLM via LiteLLM for tool-calling. Requires langchain-litellm (included in extras). Pick the auth path that matches your environment:
# 1. AI Studio (Gemini API key) — default model is gemini/gemini-2.0-flash
#    Requires GEMINI_API_KEY in .env (get one at https://aistudio.google.com/apikey)
USE_LITELLM=1 uv run adb run examples/simple_agent.py

# 2. Vertex AI (service account / ADC)
USE_LITELLM=1 LITELLM_MODEL=vertex_ai/gemini-2.0-flash uv run adb run examples/simple_agent.py

# 3. OpenAI-compatible LiteLLM proxy
#    Requires OPENAI_API_KEY and OPENAI_BASE_URL in .env (point at your proxy)
USE_LITELLM=1 LITELLM_MODEL=openai/gpt-4o-mini uv run adb run examples/simple_agent.py
The LITELLM_MODEL value's prefix decides which provider LiteLLM routes through (gemini/..., vertex_ai/..., openai/..., anthropic/..., etc.) and which env vars it reads for auth. See the LiteLLM provider docs for the full list.
Simple Agent Demo
# Run simple_agent with all demo renderer/mutator extensions
uv run adb run examples/simple_agent.py \
  --store-renderer examples.simple_extensions:SimpleStoreRenderer \
  --output-renderer examples.simple_extensions:SimpleChatOutputRenderer \
  --tool-renderer examples.simple_extensions:SimpleToolRenderer \
  --state-mutator examples.simple_extensions:SimpleStateMutator

# Optional: enable LiteLLM tool-calling path in examples/simple_agent.py
# (example model uses Vertex + service account/ADC auth)
USE_LITELLM=1 LITELLM_MODEL=vertex_ai/gemini-2.0-flash uv run adb run examples/simple_agent.py \
  --store-renderer examples.simple_extensions:SimpleStoreRenderer \
  --output-renderer examples.simple_extensions:SimpleChatOutputRenderer \
  --tool-renderer examples.simple_extensions:SimpleToolRenderer \
  --state-mutator examples.simple_extensions:SimpleStateMutator
Structured Agent Demo
examples/structured_agent.py is a minimal LangGraph agent whose AI message
content is a dict ({"text": ..., "recommendations": [...], "metadata": ...})
instead of a plain string. Useful for understanding adb's default text
extraction and the --raw-chat flag, and for testing a custom
ChatOutputRenderer against structured content.
# Default: deterministic recommender, no API keys required
uv run adb run examples/structured_agent.py

# --raw-chat: disable extraction and show the normalized event.text
uv run adb run examples/structured_agent.py --raw-chat

# LLM mode: route through LiteLLM (uses OPENAI_API_KEY / OPENAI_BASE_URL,
# default model openai/gpt-4o-mini). Override the model via LITELLM_MODEL.
USE_LITELLM=1 uv run adb run examples/structured_agent.py
Try inputs like give me ideas, cheap ones, or premium picks. The chat
pane shows the extracted text; the State and Messages panels render the full
structured payload (recommendations + metadata).
The example also exports a WELCOME constant — adb auto-renders it in the
chat pane on launch as a short explainer. Define WELCOME = "..." in your
own scripts to do the same.
Usage
CLI commands
adb run vs adb attach
adb run my_agent.py: Execute a Python script and auto-detect (or choose via--graph) aCompiledStateGraphfrom that script.adb attach my_module:graph: Import and debug an already-exposed graph object from amodule:attributereference.
Both commands support the same optional debugger extensions (--store-renderer, --state-renderer, --output-renderer, --tool-renderer, --state-mutator, and --input-provider).
Debugger commands
# Set a breakpoint on a node
/break node agent

# Set a breakpoint on a tool
/break tool search_listings

# Break when a state key changes
/break state messages

# Standard Python breakpoint
/break line my_agent.py:42

# Clear local UI context
/clear

# Local clear + optional mutator mutation
/clear memory

# Quit (or press Ctl-c, Ctl-c)
/q
See /help in the TUI for all commands.
Programmatic Breakpoints
You can drop into the adb debugger from anywhere in your agent code using Python's built-in breakpoint():
PYTHONBREAKPOINT="adb.set_trace" adb run my_agent.py
Then add breakpoint() calls in your code:
def my_node(state: dict) -> dict:
    messages = state.get("messages", [])
    breakpoint()  # execution pauses here in the adb UI
    return {"messages": [...]}
Or call adb.set_trace() directly:
def my_node(state: dict) -> dict:
    import agent_debugger as adb; adb.set_trace()
    return {"messages": [...]}
Debug Keys
When at a breakpoint, use pudb-style keys:
| Key | Action |
|---|---|
c |
Continue execution |
n |
Step over (next line) |
s |
Step into |
r |
Step out (return / finish) |
Implementation note: When a breakpoint hits, the Input widget is disabled (inp.disabled = True). This prevents it from consuming keystrokes, so c/n/s/r go to the App's BINDINGS instead. When the user presses c (continue), the Input is re-enabled and re-focused.
Extensions
adb supports optional extensions that customize how your agent's data is displayed and how input is constructed. Extensions are plain Python classes — no base class required. adb uses duck typing, so any object with the right methods will work.
Pass extensions via CLI flags using module:Class references:
adb attach my_module:graph \
  --store-renderer my_ext:MyStoreRenderer \
  --state-renderer my_ext:MyStateRenderer \
  --output-renderer my_ext:MyChatOutputRenderer \
  --tool-renderer my_ext:MyToolRenderer \
  --state-mutator my_ext:MyStateMutator \
  --input-provider my_ext:MyInputProvider
If a class reference is provided, adb will instantiate it (call Class()) and
validate that the required methods exist. If loading fails, adb logs a warning
and falls back to default behavior.
StoreRenderer
Customizes the Store panel in the right sidebar.
| Method | Signature | Description |
|---|---|---|
render_store |
(snapshot: Mapping[str, Any]) -> MemoryRenderModel | None |
Render store contents. snapshot contains {"store_items": {...}}. |
from agent_debugger.extensions import MemoryRenderModel

class MyStoreRenderer:
    def render_store(self, snapshot):
        items = snapshot.get("store_items", {})
        lines = ["[bold cyan]My Store[/bold cyan]"]
        for ns, entries in items.items():
            lines.append(f"  {ns}: {len(entries)} items")
        return MemoryRenderModel(lines=lines)
StateRenderer
Customizes the State panel in the right sidebar.
| Method | Signature | Description |
|---|---|---|
render_state |
(snapshot: Mapping[str, Any]) -> StateRenderModel | None |
Render state contents. snapshot contains {"state": {...}}. |
from agent_debugger.extensions import StateRenderModel

class MyStateRenderer:
    def render_state(self, snapshot):
        state = snapshot.get("state", {})
        lines = [
            "[bold cyan]Agent State[/bold cyan]",
            f"messages: {len(state.get('messages', []))}",
            f"status: {state.get('status', 'unknown')}",
        ]
        return StateRenderModel(lines=lines)
ChatOutputRenderer
Customizes how agent responses appear in the main chat pane. This is useful
when your agent returns structured output (e.g., JSON with a text field and
metadata) and you want to display only the relevant parts.
Default behavior: When no
--output-rendereris supplied (or when one is supplied but returns no lines for a given payload),adbautomatically extracts the"text"field from JSON-shaped chat content — bothdictcontent like{"text": "hi", "recommendations": [...]}and JSON-string content like'{"text": "hi"}'. Pass--raw-chatonadb run/adb attachto disable this and fall through to the normalized response string (event.text, which is whatadbshowed prior to text extraction). For deeper inspection of the full structured payload, use the State panel or Messages tab.
| Method | Signature | Description |
|---|---|---|
can_render |
(payload: Mapping[str, Any]) -> bool |
Return True if this renderer handles the given payload. |
render_chat_output |
(payload, state, messages) -> ChatRenderModel | None |
Render the payload into display lines. |
The payload dict contains the raw agent response (e.g., additional_kwargs.parsed
from the AI message, or parsed JSON content). Lines support
Rich markup for styling.
from agent_debugger.extensions import ChatRenderModel

class MyChatOutputRenderer:
    def can_render(self, payload):
        return "text" in payload

    def render_chat_output(self, payload, state, messages):
        text = payload.get("text", "")
        lines = [text]
        recs = payload.get("recommendations", [])
        if recs:
            lines.append("")
            lines.append("[bold]Recommendations:[/bold]")
            for i, rec in enumerate(recs, 1):
                title = rec.get("title", "")
                lines.append(f"  {i}. [cyan]{title}[/cyan]")
        return ChatRenderModel(lines=lines)
ToolRenderer
Customizes the Tools tab in the bottom panel.
| Method | Signature | Description |
|---|---|---|
render_tools |
(snapshot: Mapping[str, Any]) -> ToolRenderModel | None |
Render tool call history. snapshot contains {"tool_calls": [...]}. |
Each tool call dict has keys: name, args, result, error, node, turn.
from agent_debugger.extensions import ToolRenderModel

class MyToolRenderer:
    def render_tools(self, snapshot):
        calls = snapshot.get("tool_calls", [])
        lines = [f"[bold]Tools ({len(calls)} calls)[/bold]"]
        for call in calls:
            name = call.get("name", "?")
            status = "[red]error[/red]" if call.get("error") else "[green]ok[/green]"
            lines.append(f"  {name} — {status}")
        return ToolRenderModel(lines=lines)
StateMutator
Handles custom /clear <mutation> commands (e.g., /clear memory).
| Method | Signature | Description |
|---|---|---|
mutate_state |
(mutation, args, current_state, runner) -> StateMutationResult | None |
Apply a named mutation. runner provides access to the graph and store. |
from agent_debugger.extensions import StateMutationResult

class MyStateMutator:
    def mutate_state(self, mutation, args, current_state, runner):
        if mutation != "memory":
            return StateMutationResult(applied=False, message="Unknown mutation.")
        store = getattr(getattr(runner, "graph", None), "store", None)
        if store is None:
            return StateMutationResult(applied=False, message="No store configured.")
        # ... clear store entries ...
        return StateMutationResult(applied=True, message="Memory cleared.")
InputProvider
Customizes the input dict sent to graph.stream(). Use this when your agent's
state schema requires fields beyond messages (e.g., user_id).
| Method | Signature | Description |
|---|---|---|
build_input |
(message: str) -> dict[str, Any] |
Build the input dict. Must include a "messages" key. |
import getpass

class MyInputProvider:
    def build_input(self, message):
        return {
            "messages": [{"role": "human", "content": message}],
            "user_id": getpass.getuser(),
        }
Render model line format
All render models (MemoryRenderModel, StateRenderModel, ChatRenderModel,
ToolRenderModel) contain a lines: list[str] field. Each string is rendered
as a separate line in the UI and supports
Rich console markup:
[bold cyan]Title[/bold cyan]       # bold cyan text
[dim]subtitle[/dim]               # dimmed text
[green]success[/green]            # green text
[red]error[/red]                  # red text
If markup parsing fails for a line, adb falls back to rendering it as plain text.
Full example
See examples/simple_extensions.py for a
working implementation of StoreRenderer, ChatOutputRenderer, ToolRenderer,
and StateMutator.
CLI Options
| Option | Default | Description |
|---|---|---|
--env-file |
.env |
Path to a dotenv file to load before starting. |
--thread-id, -t |
— | Thread ID for checkpointed graphs. |
--store-renderer |
— | Store panel renderer (module:Class). |
--state-renderer |
— | State panel renderer (module:Class). |
--output-renderer |
— | Chat output renderer (module:Class). |
--tool-renderer |
— | Tools panel renderer (module:Class). |
--state-mutator |
— | State mutator for /clear commands (module:Class). |
--input-provider |
— | Input provider for custom graph input (module:Class). |
--store-prefix |
— | Backend store namespace prefix (comma-separated). |
--store-max-namespaces |
20 |
Max store namespaces to display. |
--store-items-per-namespace |
20 |
Max items per namespace to display. |
--raw-chat |
off | Disable default text extraction; show normalized event.text. |
Design
See Design.md.
1 maintainer

Release files for agent-debugger 0.1.12
For a detailed explanation of source distributions (sdists) and built distributions (wheels), please see the package formats documentation.
Source distribution (sdist)
| File | Size | Uploaded | |
|---|---|---|---|
| agent_debugger-0.1.12.tar.gz | 263.9 kB | Details |
Built distribution (wheel)
| File | Interpreter | ABI | Platform | Reset |
|---|---|---|---|---|
| agent_debugger-0.1.12-py3-none-any.whl | Python 3 | none | any | Details |
Total release size: 314.9 kB
Release files / agent_debugger-0.1.12.tar.gz
| Download URL | agent_debugger-0.1.12.tar.gz |
|---|---|
| Size | 263.9 kB |
| Tags | Source |
|
SHA-256 checksum How to use checksums |
70797d342a0f65d924d4a2732b7d2c5525f5c74cc88906a3549006fc4aa5ba06
|
|
BLAKE2b-256 checksum How to use checksums |
c26167a29c379beae32ec0cffccb9a1f3fdce631a18cfb3a45576ea1c5caa69f
|
| Upload date | |
|
Uploaded using Trusted Publishing? What is trusted publishing? |
Yes |
| Uploaded via |
twine/6.1.0 CPython/3.13.12
|
Provenance
Provenance describes where a file came from. On PyPI, provenance is shared via attestations, which provide a verifiable record of the build or publishing details. View details, limitations and caveats.


PyPI Publish Attestation
PyPI verified that this artifact, at this checksum, originated from the publisher listed below.
Signed by GitHub Actions, verified by PyPI on May 11, 2026.
Transparency logRelease files / agent_debugger-0.1.12-py3-none-any.whl
| Download URL | agent_debugger-0.1.12-py3-none-any.whl |
|---|---|
| Size | 51.0 kB |
| Tags | Python 3 |
|
SHA-256 checksum How to use checksums |
d3ad18f5ce18269669178e5b26511b16cc8df76bd5e733123ebbc17fd4a8b9f9
|
|
BLAKE2b-256 checksum How to use checksums |
1b71a837fdc263d607144ef9e6eca5ac1c6d08cab6fd58f36a55b446925b1da1
|
| Upload date | |
|
Uploaded using Trusted Publishing? What is trusted publishing? |
Yes |
| Uploaded via |
twine/6.1.0 CPython/3.13.12
|
Provenance
Provenance describes where a file came from. On PyPI, provenance is shared via attestations, which provide a verifiable record of the build or publishing details. View details, limitations and caveats.
PyPI Publish Attestation
PyPI verified that this artifact, at this checksum, originated from the publisher listed below.
Signed by GitHub Actions, verified by PyPI on May 11, 2026.
Transparency log













