
View airflow-pytest-operator results in the Airflow 3 web UI.
Verified details
These details have been verified by PyPIProject links
GitHub Statistics
Maintainers

Project description
airflow-pytest-plugin
View airflow-pytest-operator
results in the Airflow 3 web UI.
Package
| Badge | What it tells you |
|---|---|
 |
Latest release on PyPI — pip install airflow-pytest-plugin |
 |
Supported Python versions (3.10+) |
 |
Targets Airflow 3.x (FastAPI plugin UI) |
 |
Distributed under the Apache-2.0 licence |
Quality & build
| Badge | What it tells you |
|---|---|
 |
Build & test suite (lint, types, unit, integration) on main |
 |
Test coverage of the package |
 |
Fully type-checked with mypy --strict |
 |
Linted & formatted with Ruff |
 |
OpenSSF supply-chain security score |
The operator runs a pytest suite as an Airflow task and parses the JUnit
report into a structured result. This plugin archives each of those reports —
keyed by dag_id / run_id / task_id / try — and serves a small web UI to browse
them: pass/fail counts per run, durations, and the per-test breakdown (with
failure messages) for any run. On top of that it adds cross-run analytics —
flaky-test detection, per-test history, run-to-run comparison, a duration
histogram, and a searchable catalogue of unique tests.
It has two halves that share one on-disk layout:
| Side | Where it runs | What it is |
|---|---|---|
| Producer | the worker | ArchivingResultParser, a drop-in parser= for PytestOperator |
| Reader | the API server | a FastAPI app + single-page viewer, registered as an Airflow plugin |
Contents
- Screenshots
- Install
- Quickstart
- Do I need
cleanup="never"? - How it works
- HTTP API
- Access control (RBAC)
- Configuration
- Prometheus metrics
- Architecture (SOLID)
- Development
- License
Screenshots
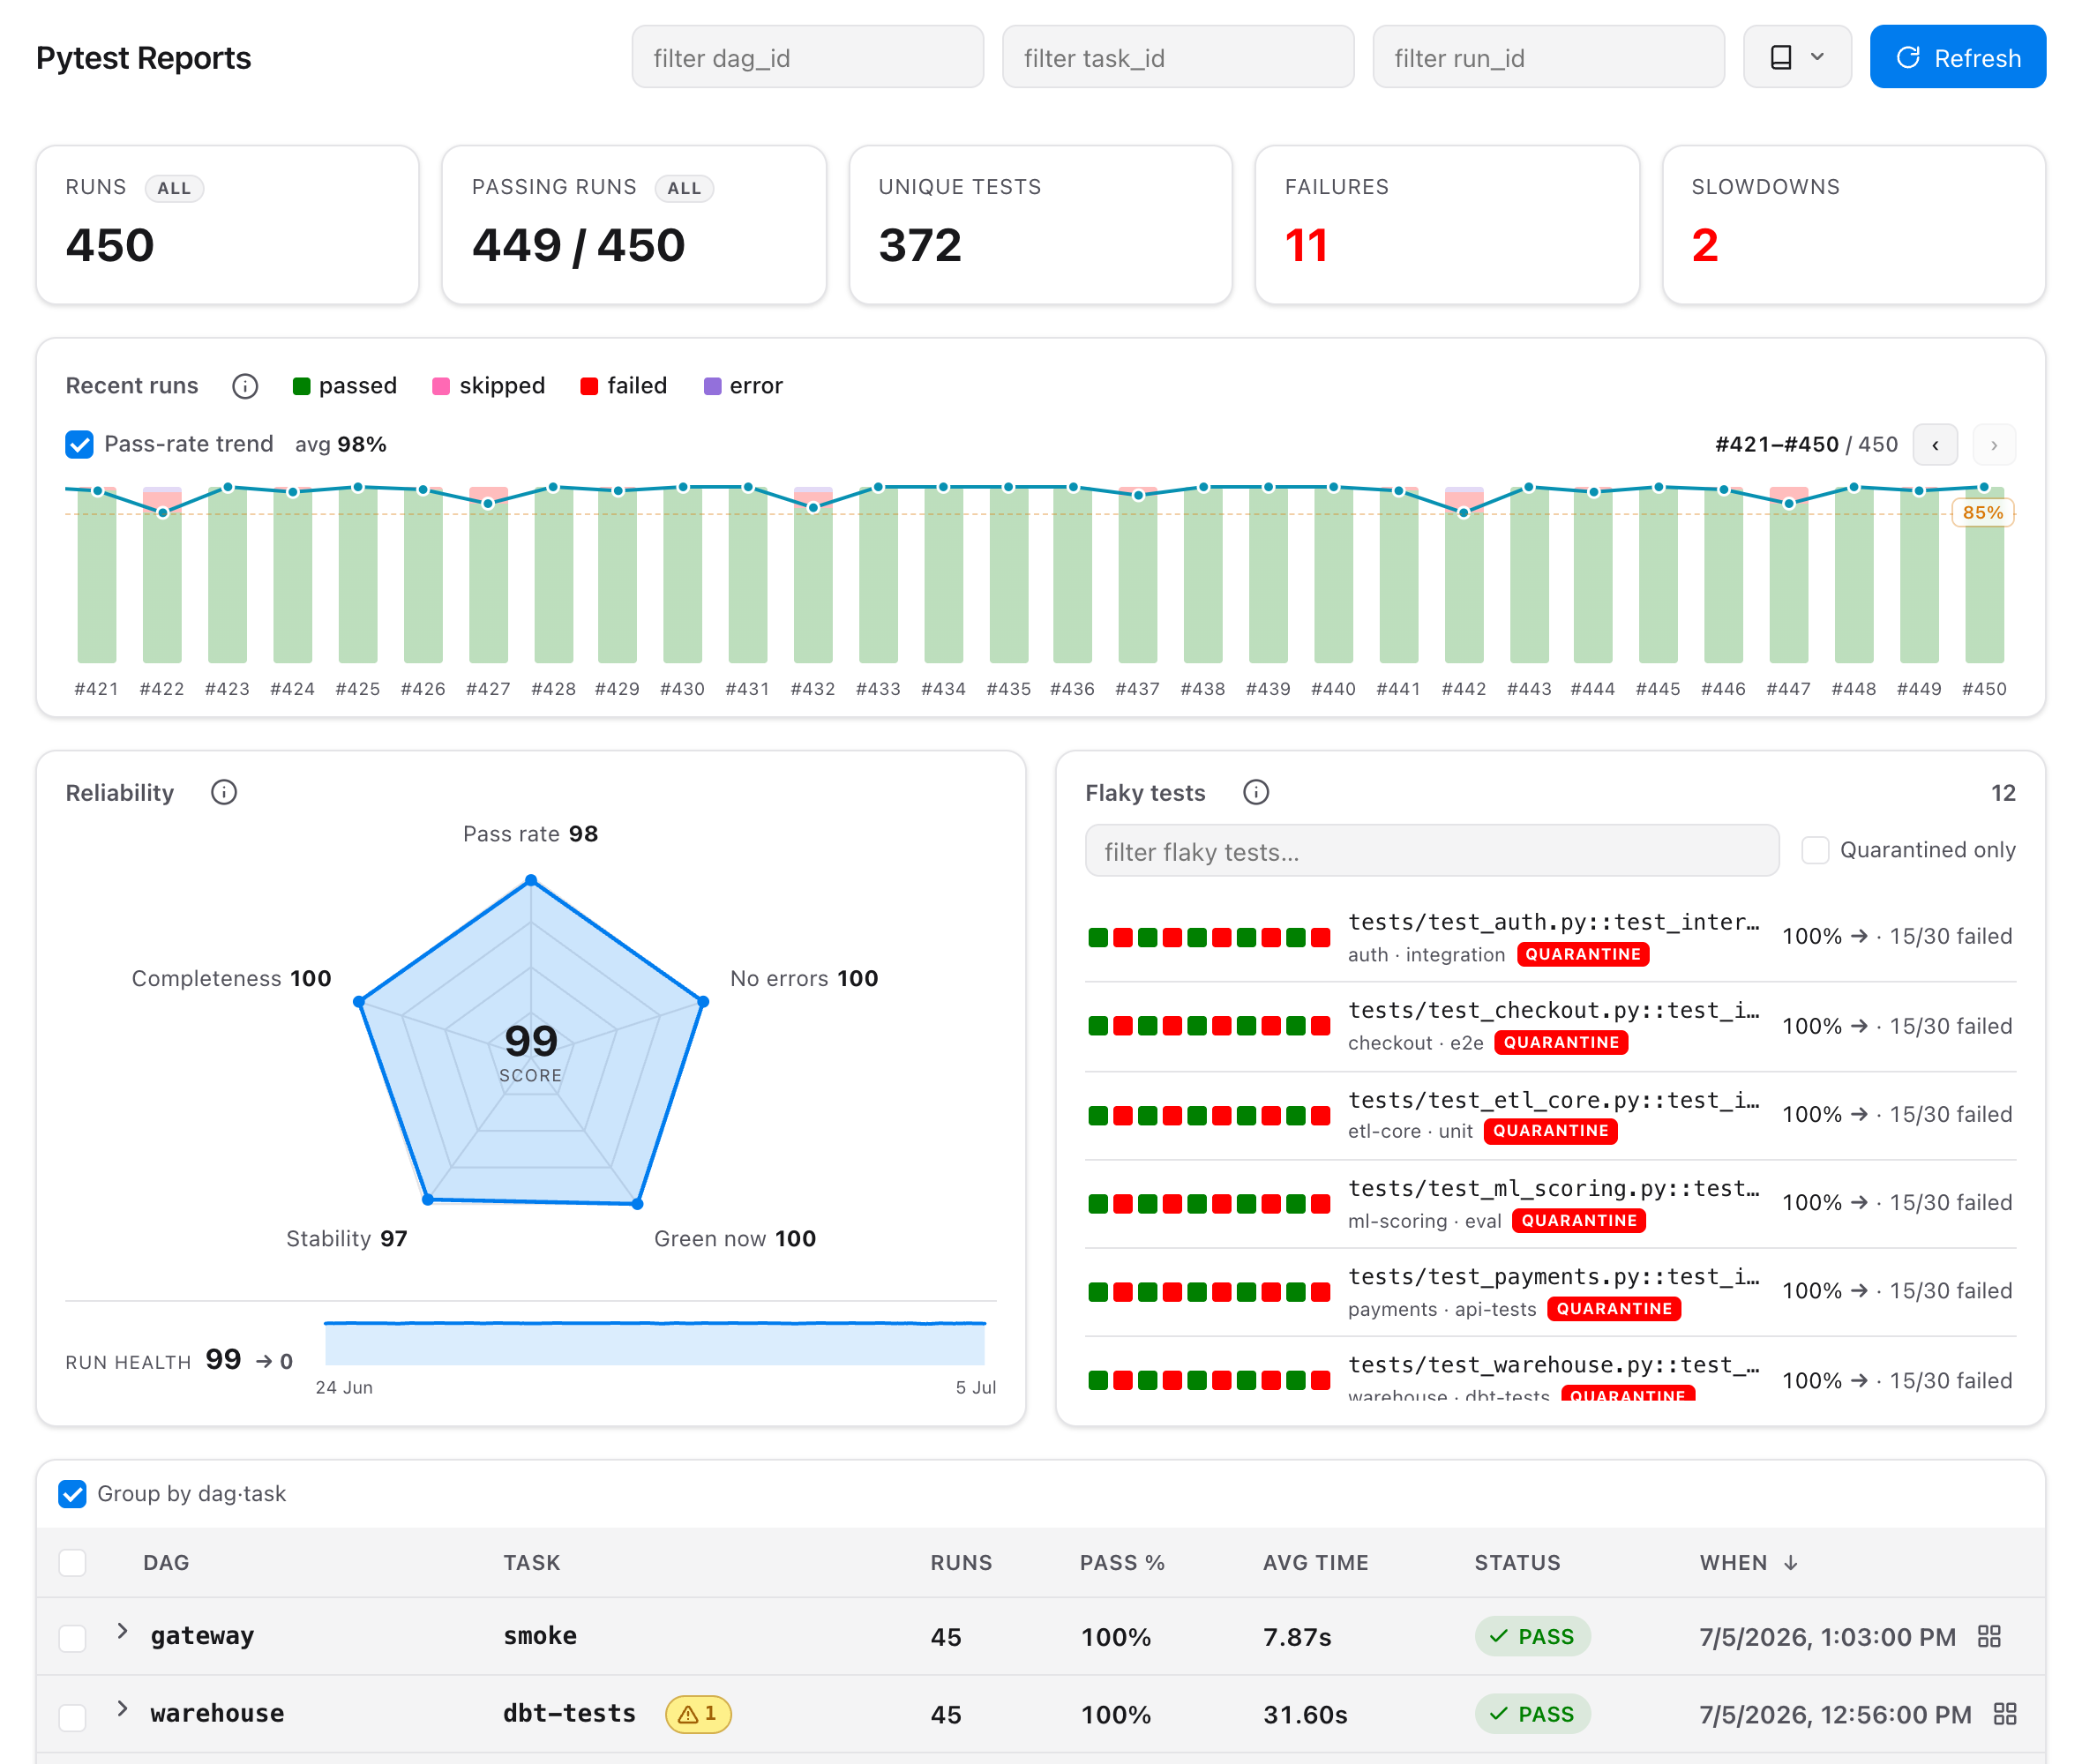
Overview — the run list with the historical chart (per-status legend toggles, run numbers, a carousel beyond 30 runs, an optional pass-rate trend line with a success-threshold gridline, and tick runs in the list to filter the chart to just their trend) beside a flaky-tests panel (with its own search and a quarantined-only toggle), KPI cards (including a clickable unique tests count), and Airflow-matched colours and font. The run list is grouped by dag·task by default (a checkbox toggles the flat list) — collapsible groups with run count, pass-rate, average duration and last status, each sortable on its own; select a whole group to chart its trend:
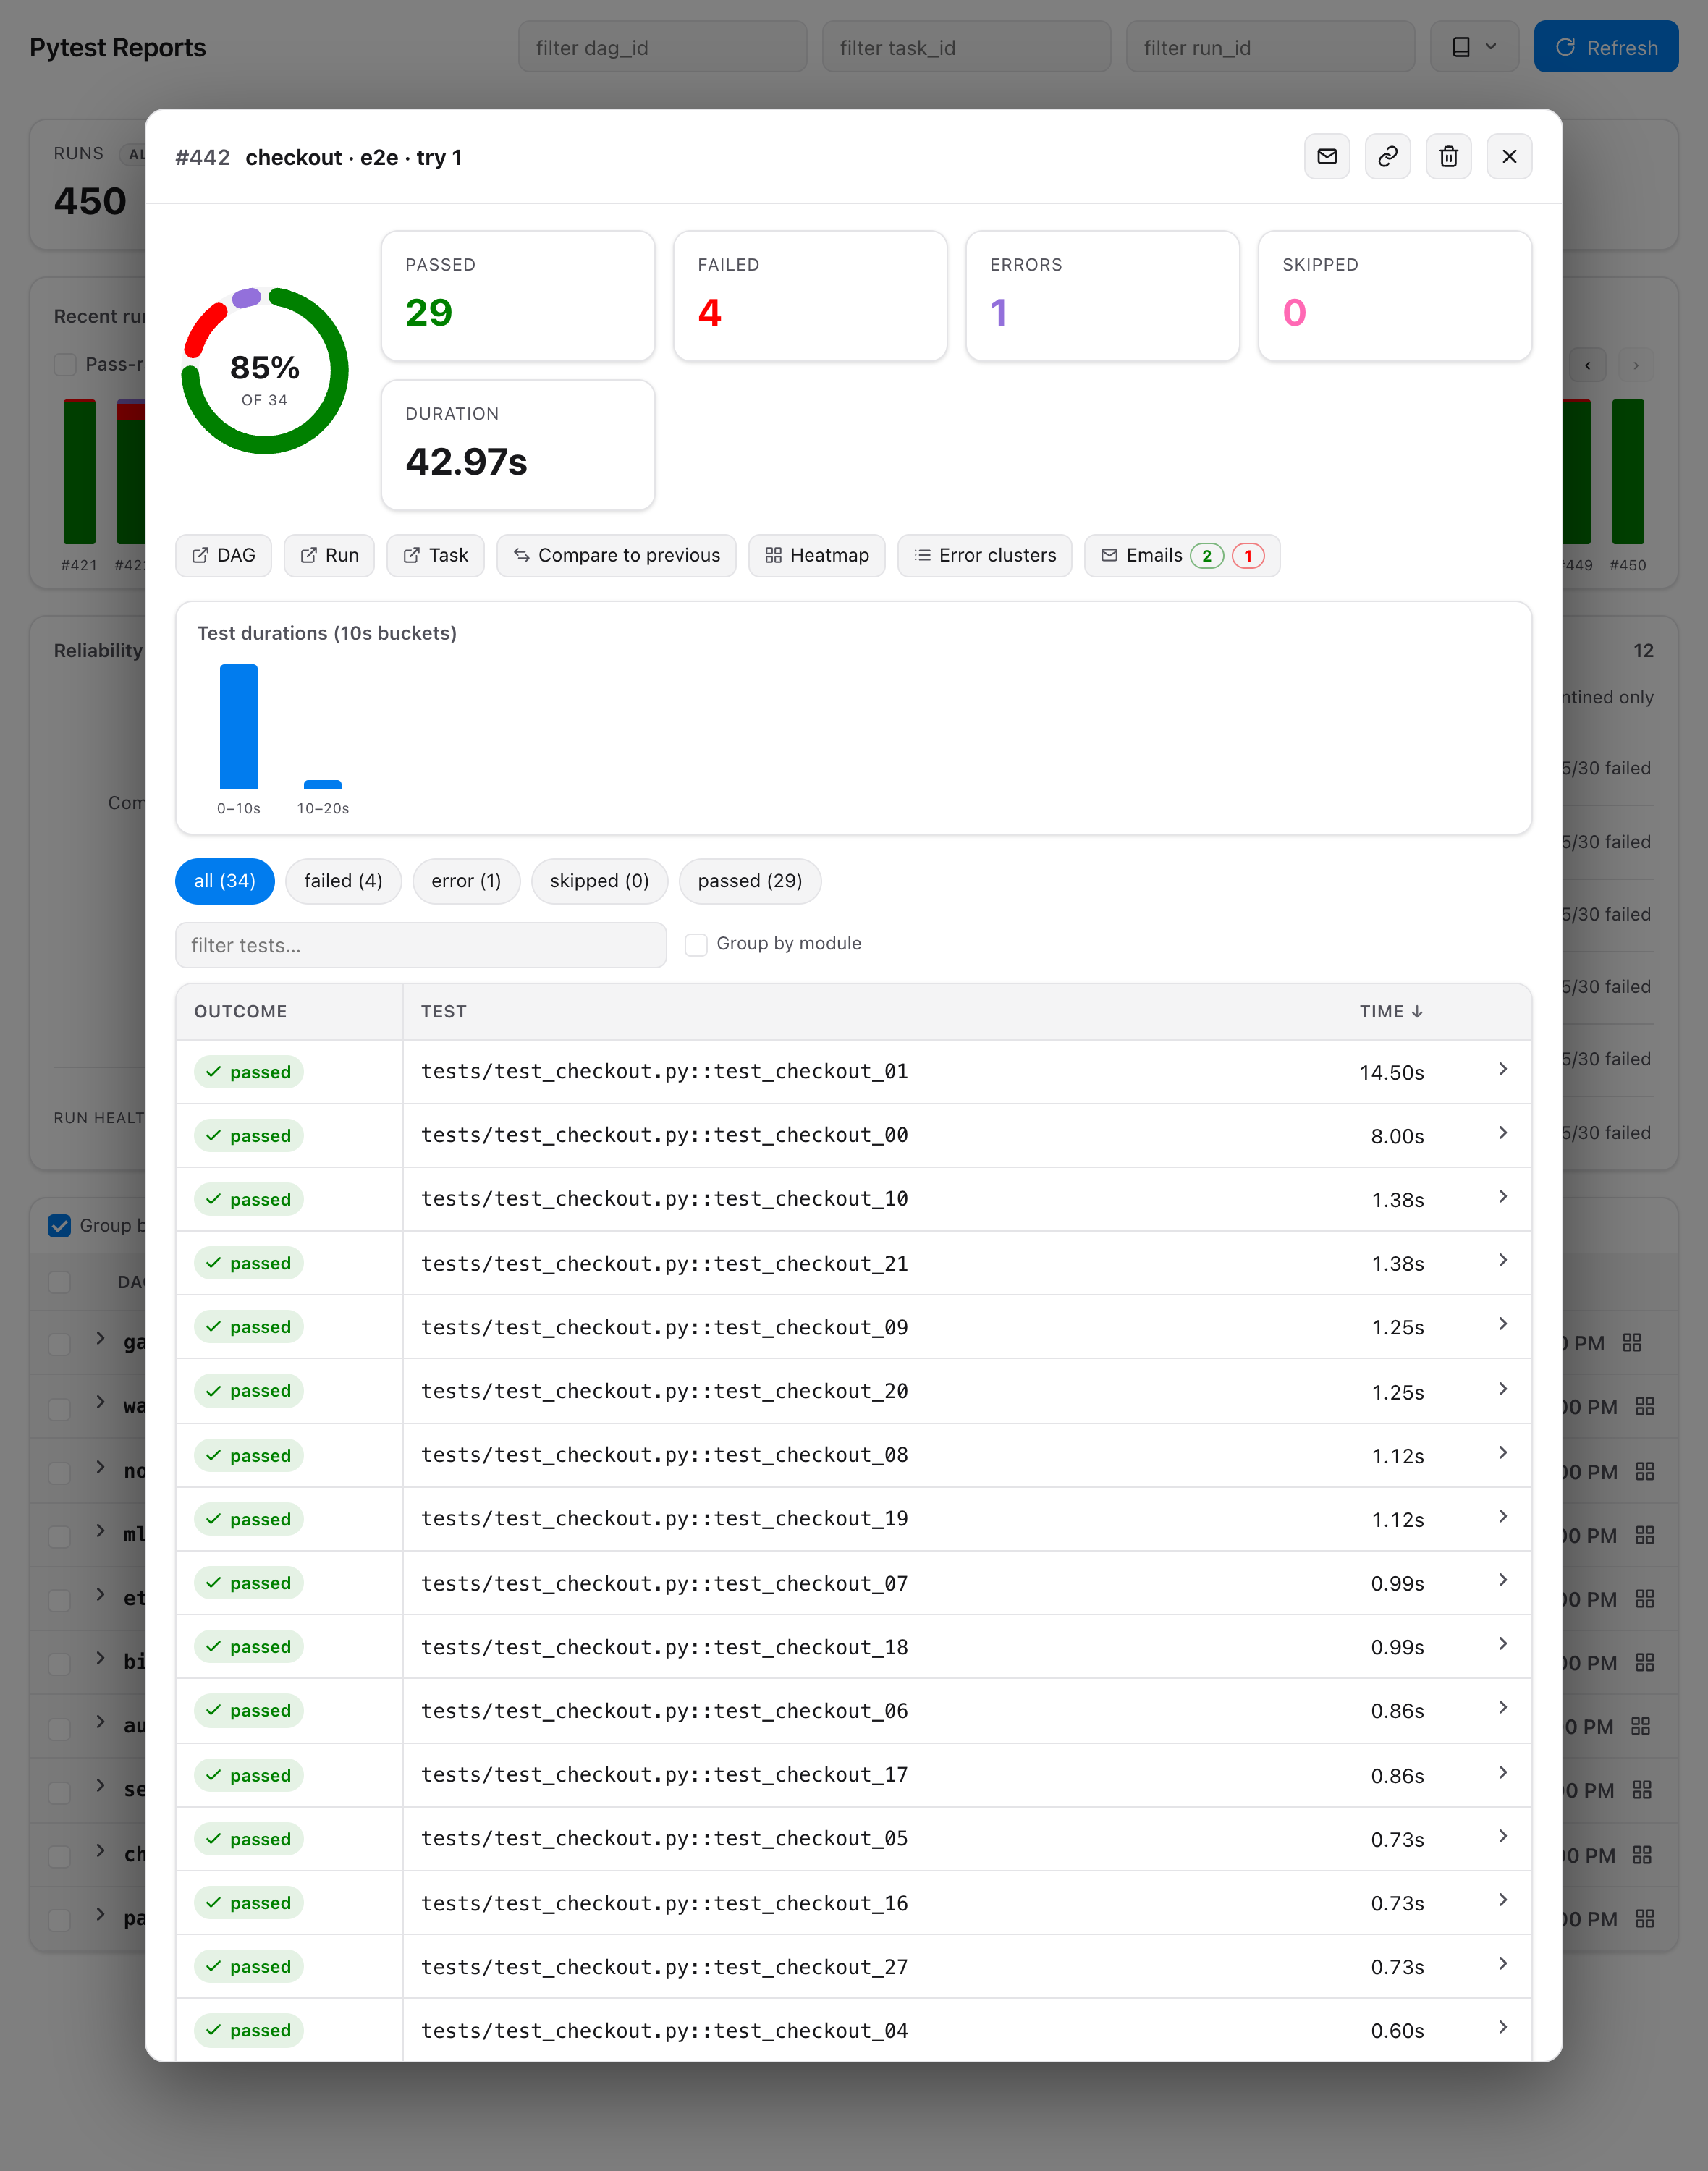
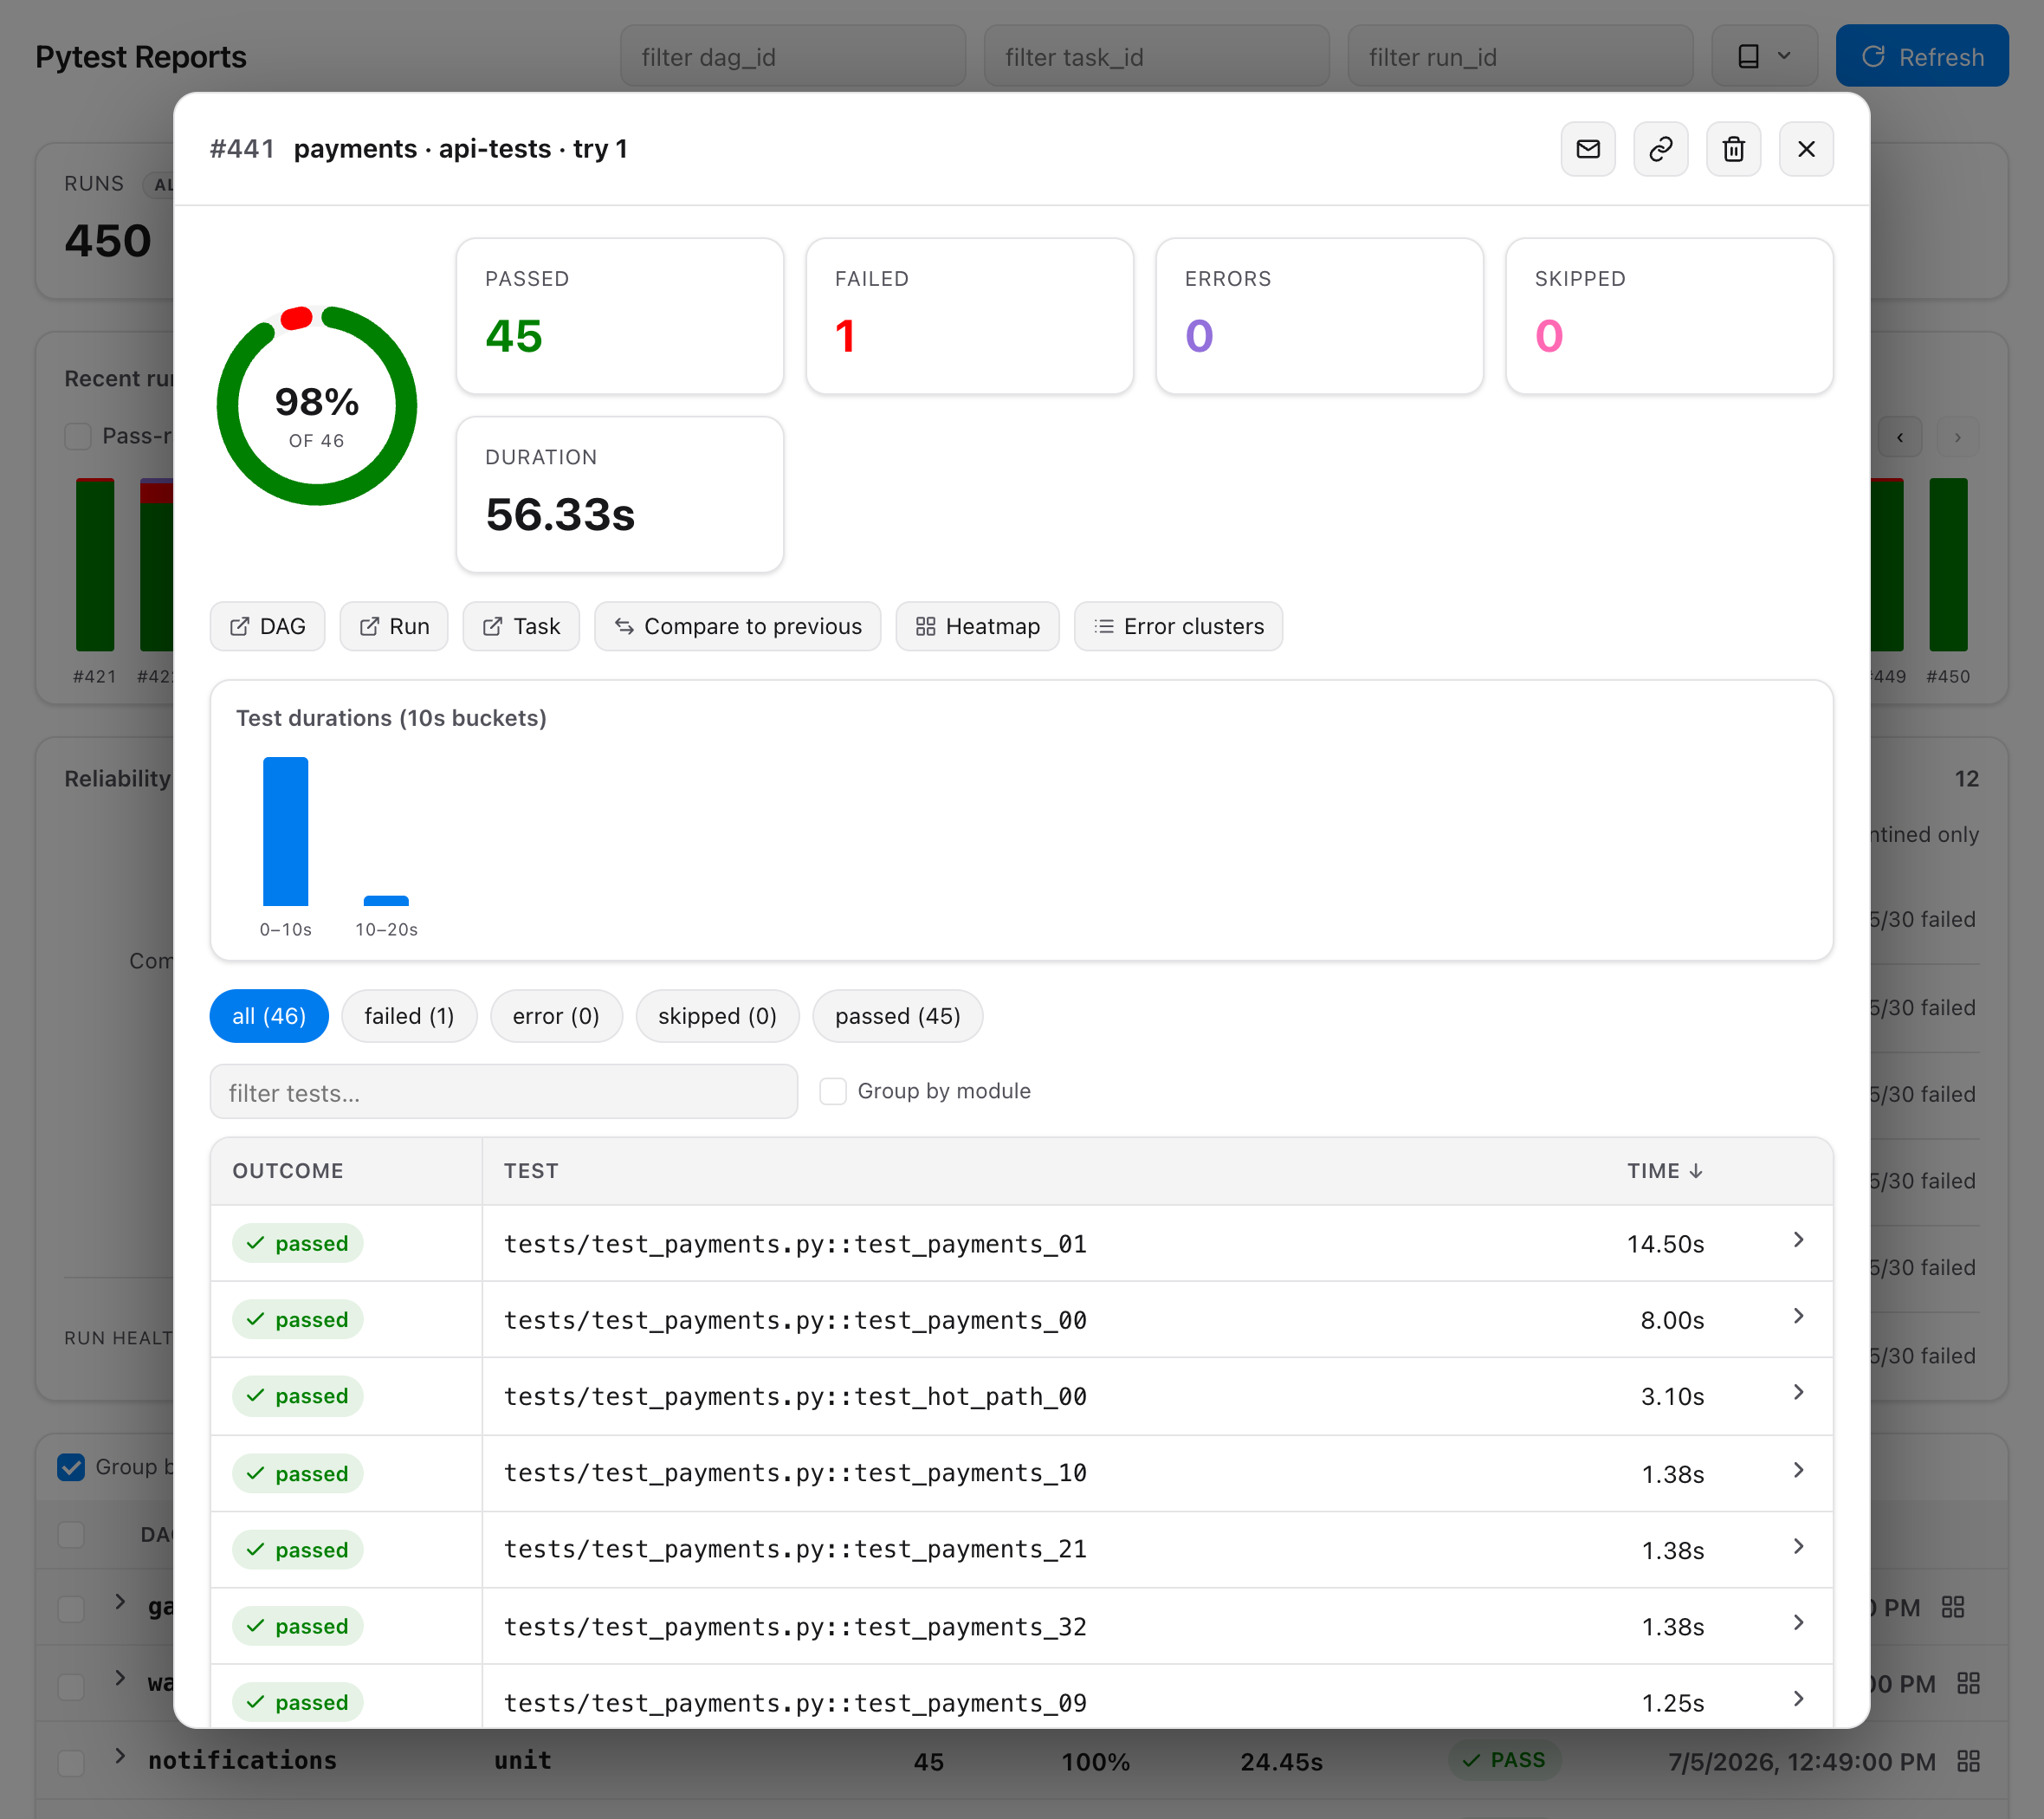
A single run — a clickable success donut (pass-rate over the test count; click a slice to filter by status), a test-duration histogram (10-second buckets, scrollable), case search / group-by-module, and every test's captured output on expand:
Flaky tests & comparison — from a run, Flaky tests lists the tests that both pass and fail across recent runs, each with a recent-outcome strip, a flakiness score, a trend arrow, and a quarantine badge, over a configurable analysis window; Compare to previous diffs it against the prior run; expanding a case offers its full history:
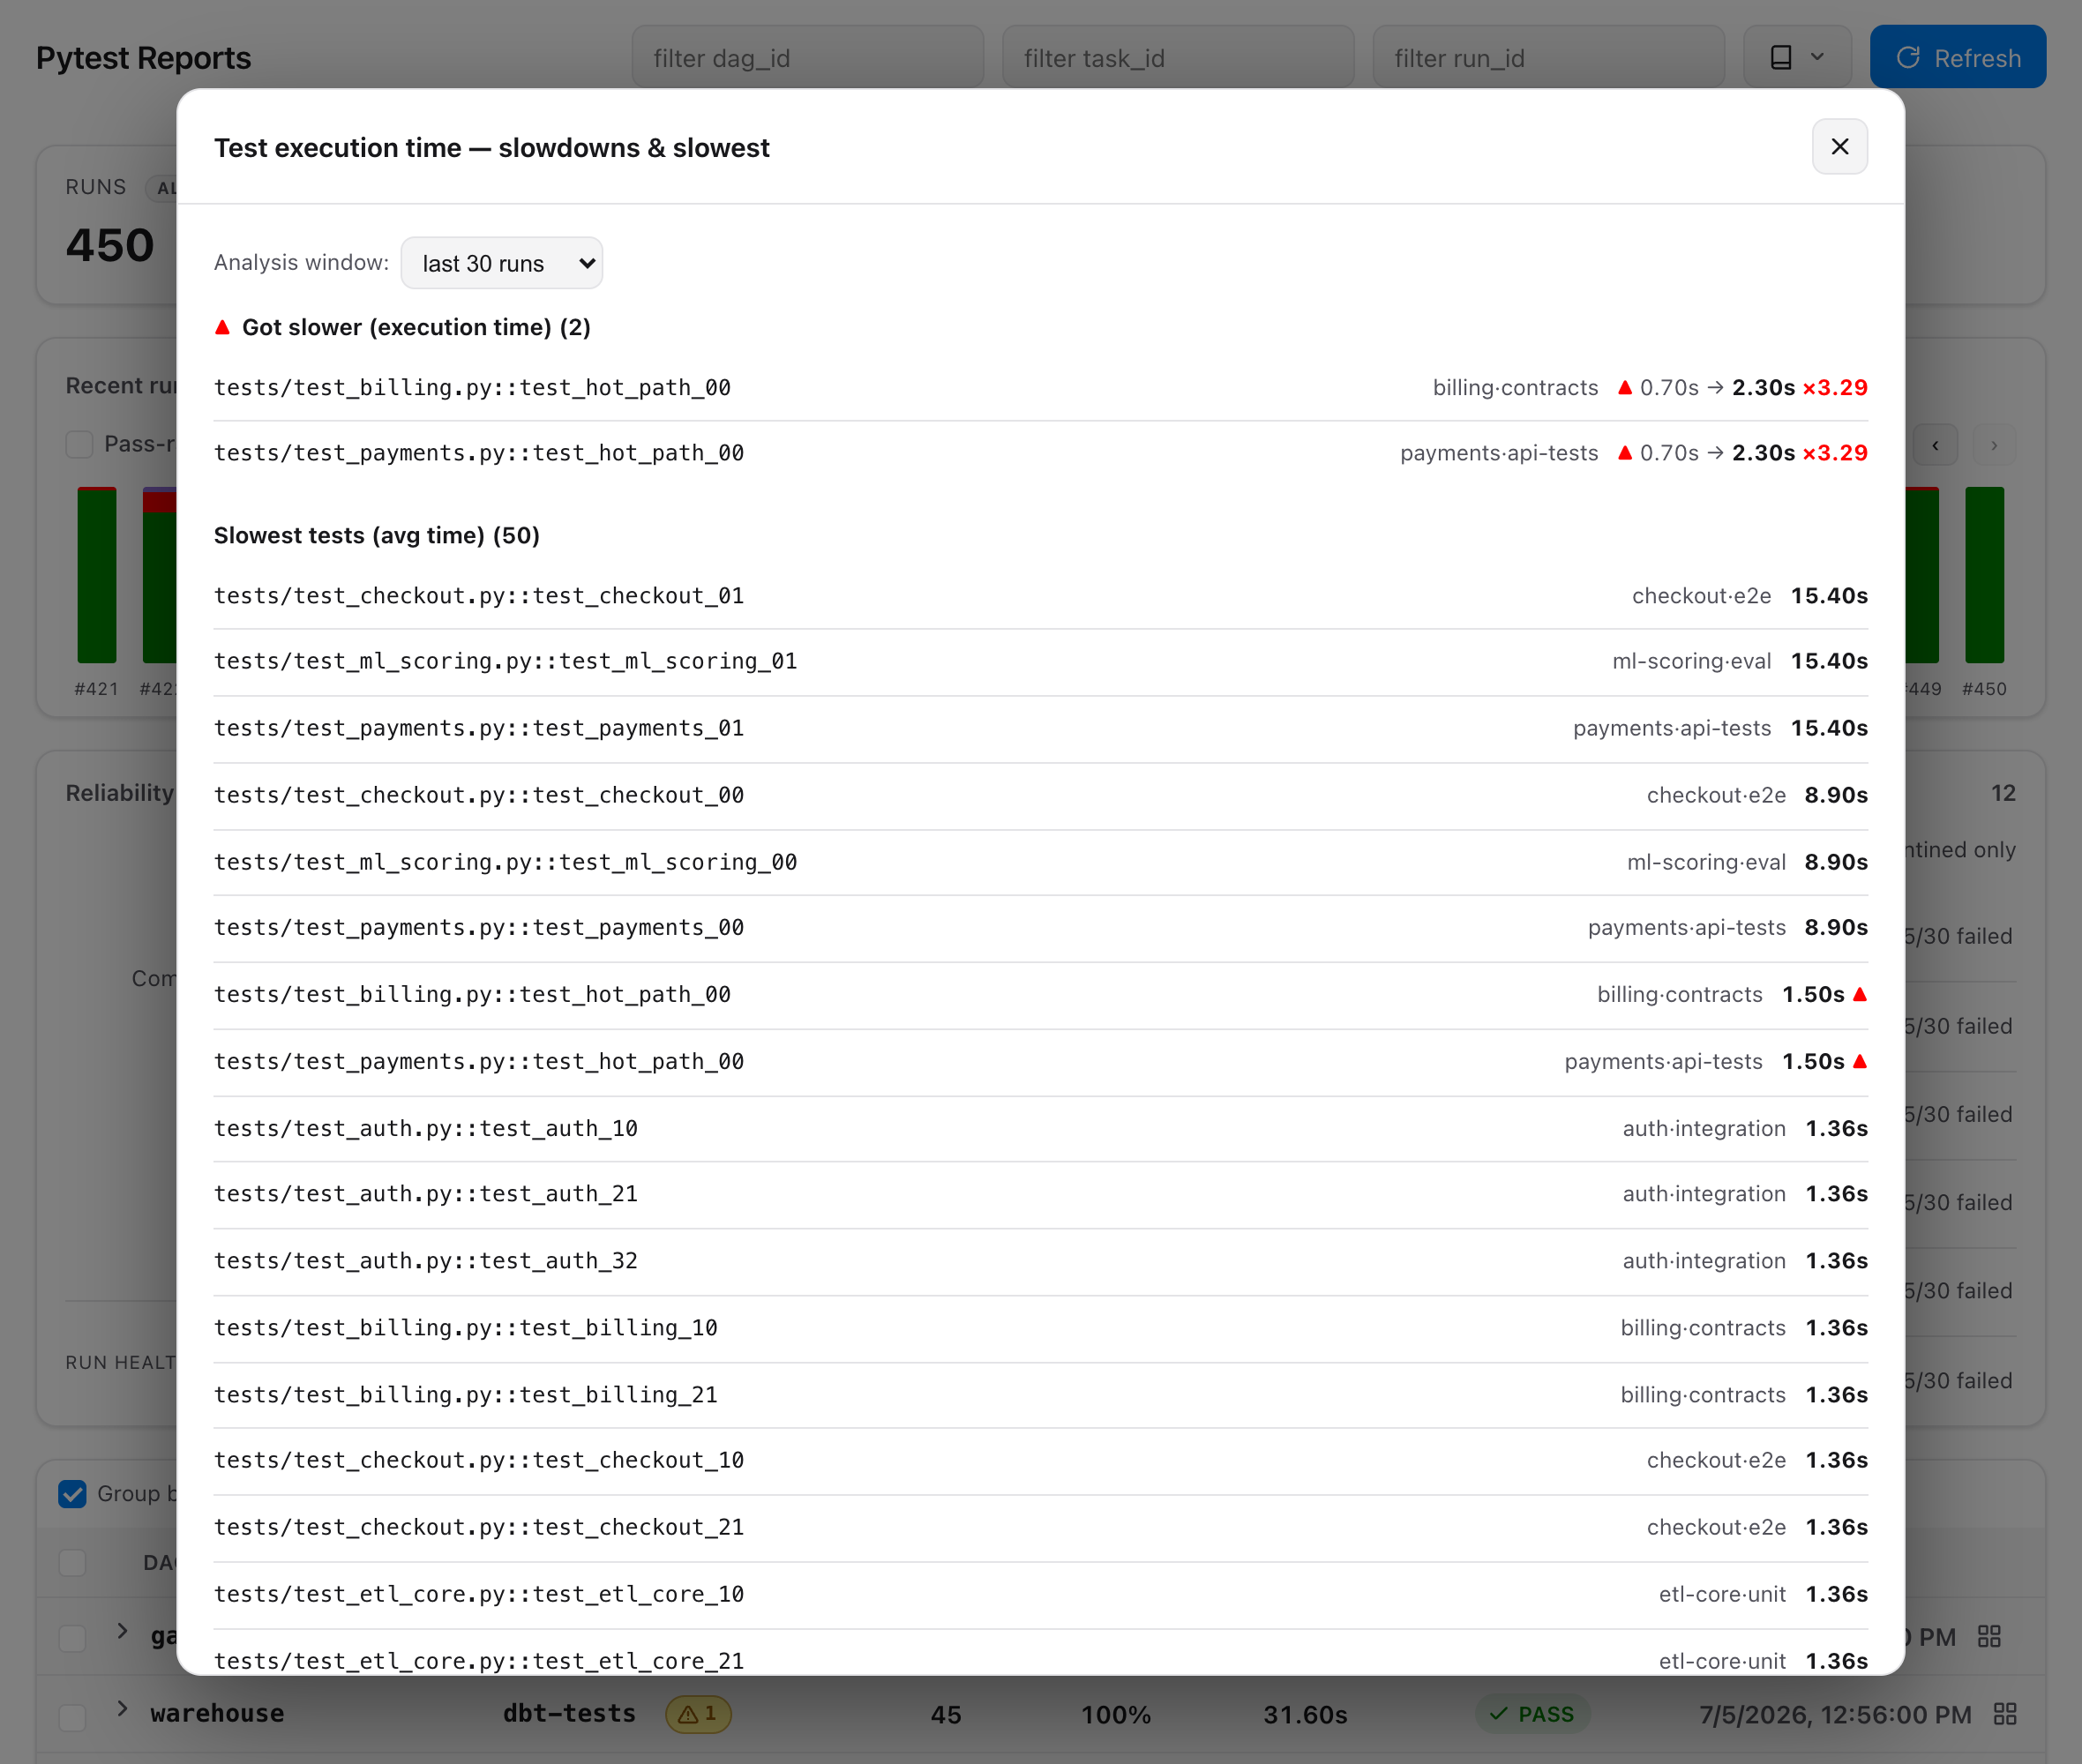
Slow tests & duration regressions — the Slowdowns KPI opens a panel of tests whose execution time got slower (recent-half average vs the older half, over a configurable window) alongside the slowest tests by average duration. A test that speeds back up drops off the list. Inside a run, the case table sorts by execution time (slowest first) so the heaviest tests surface immediately.
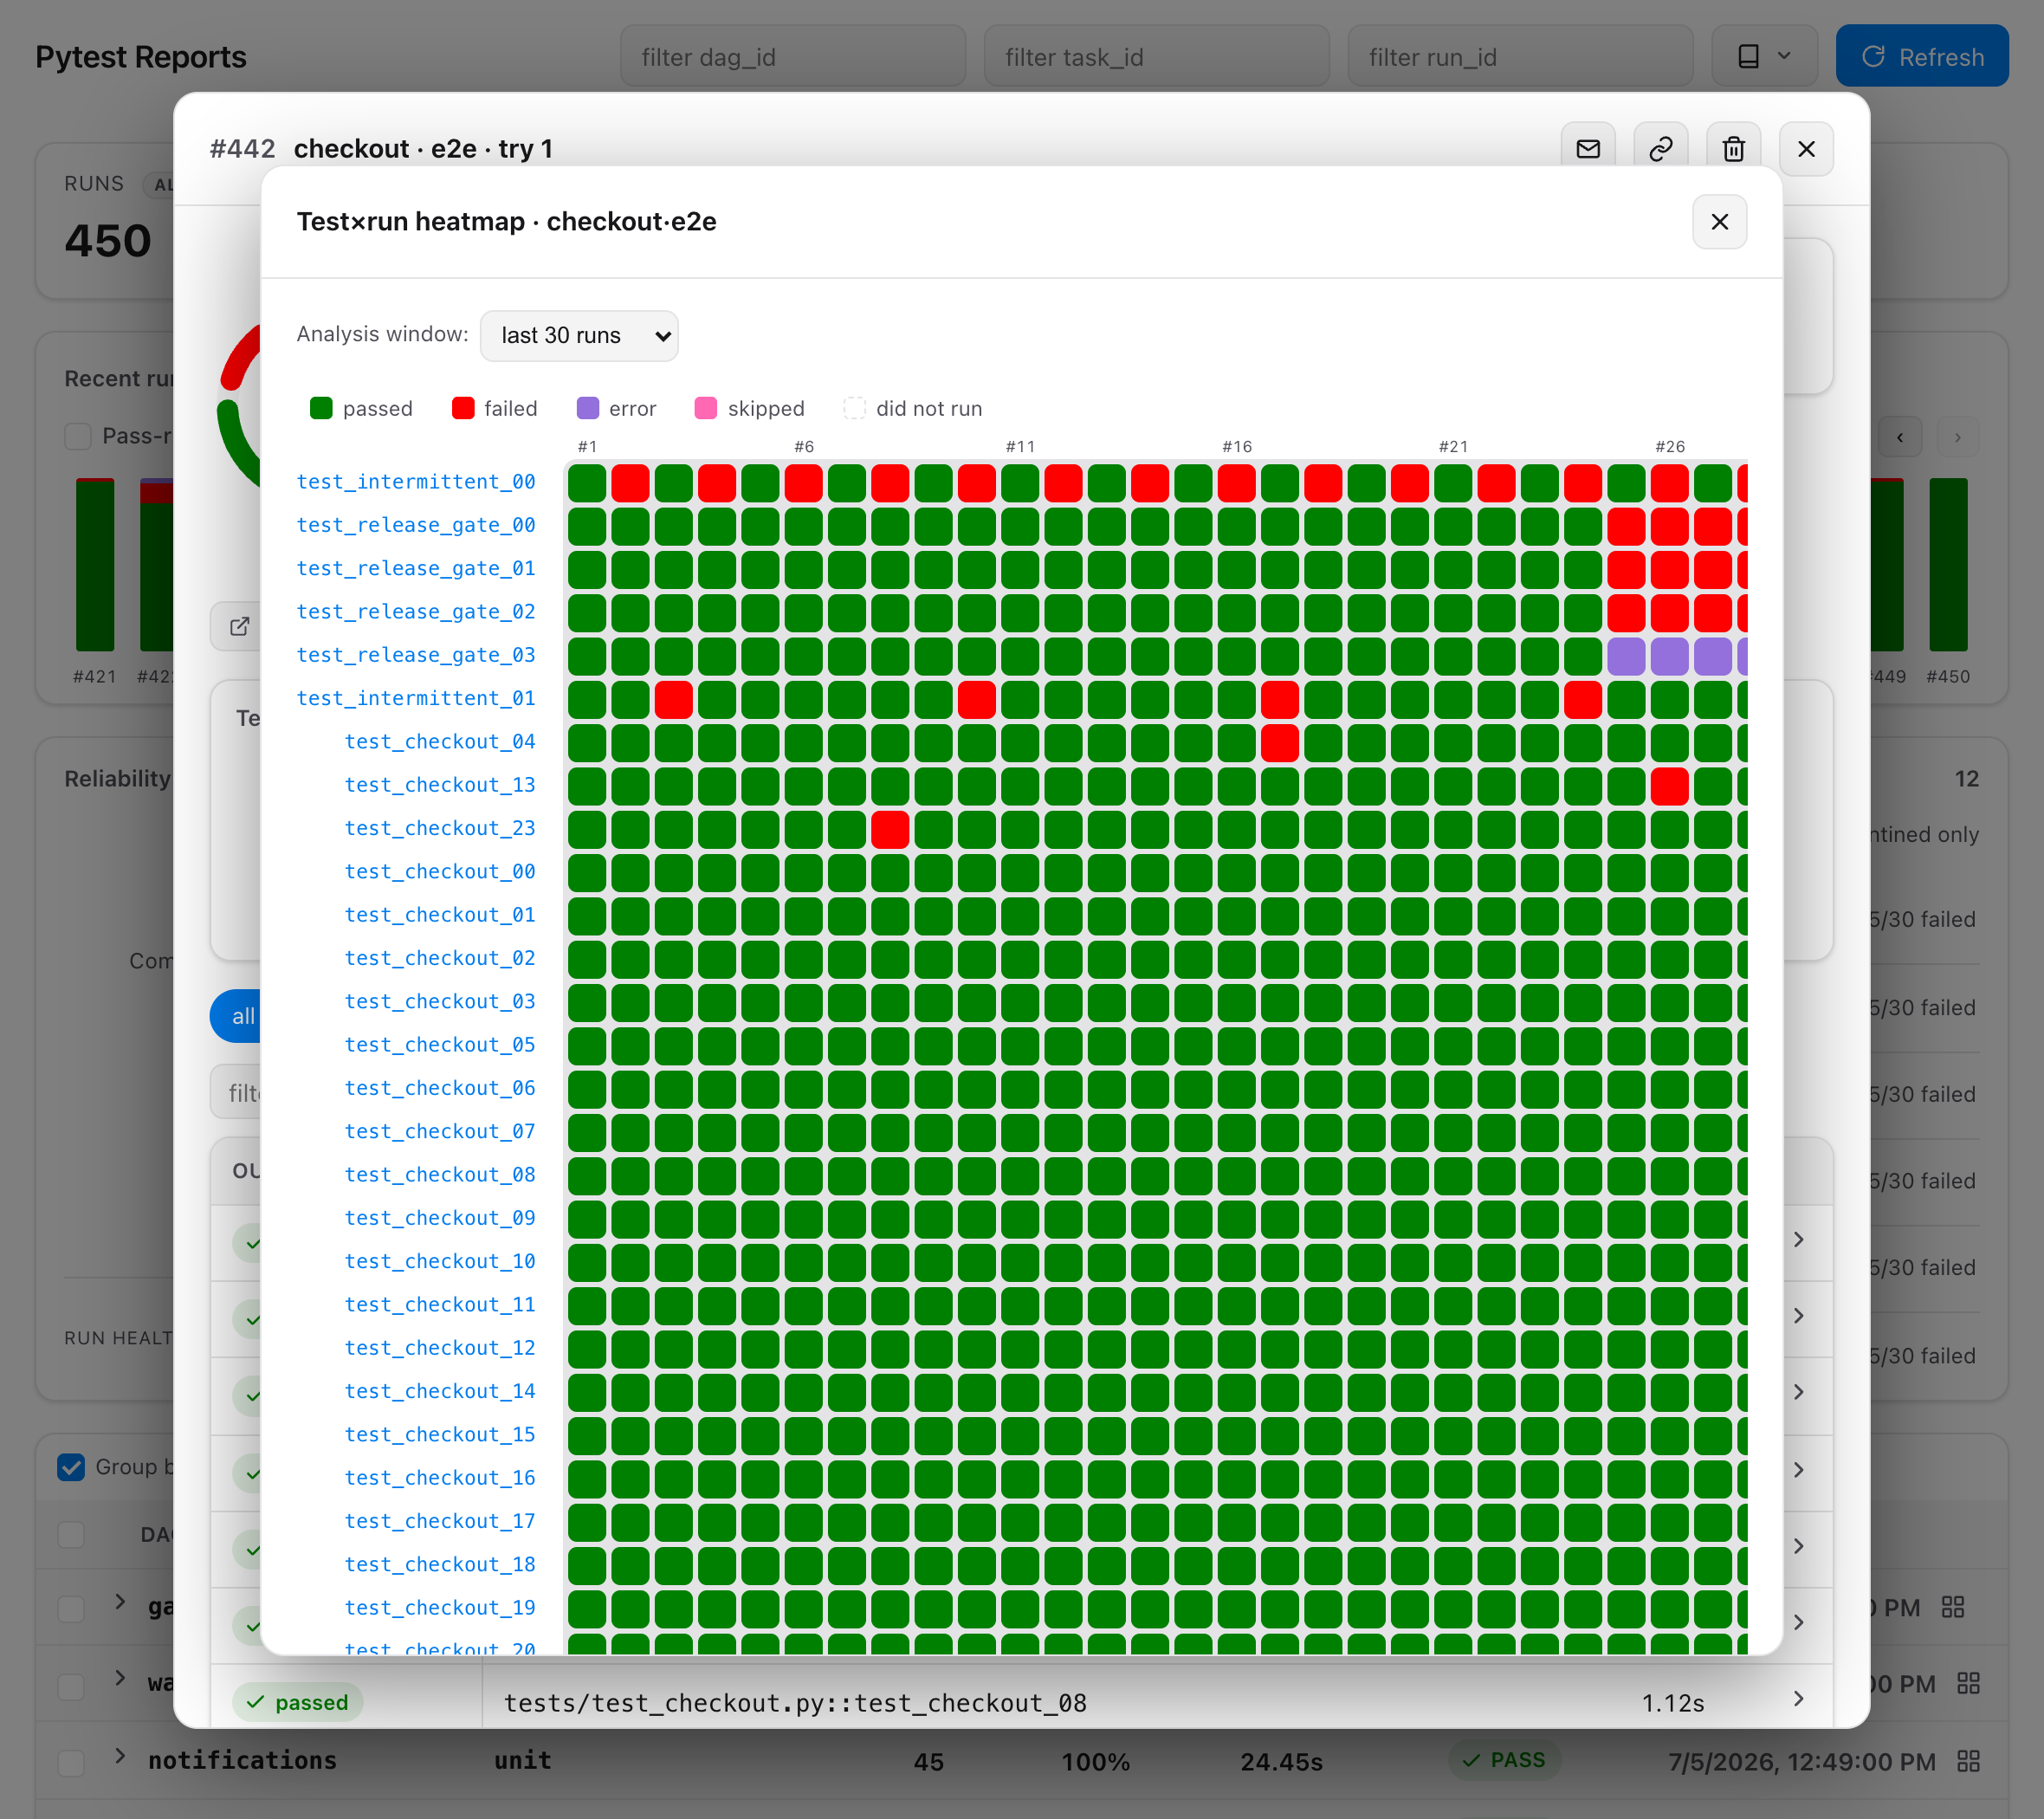
Test×run heatmap — the Heatmap button on a dag·task group (or a run's toolbar)
opens a matrix of tests (rows) × recent runs (columns), each cell coloured by that
test's outcome (did not run is an empty dashed cell). Flaky tests read as alternating
rows, a regression as a block of failures filling in on the right, and a run that broke
the build as a red/error column — all at a glance. Rows sort most-broken first; click
a cell to open that run, or a test name to open its history.
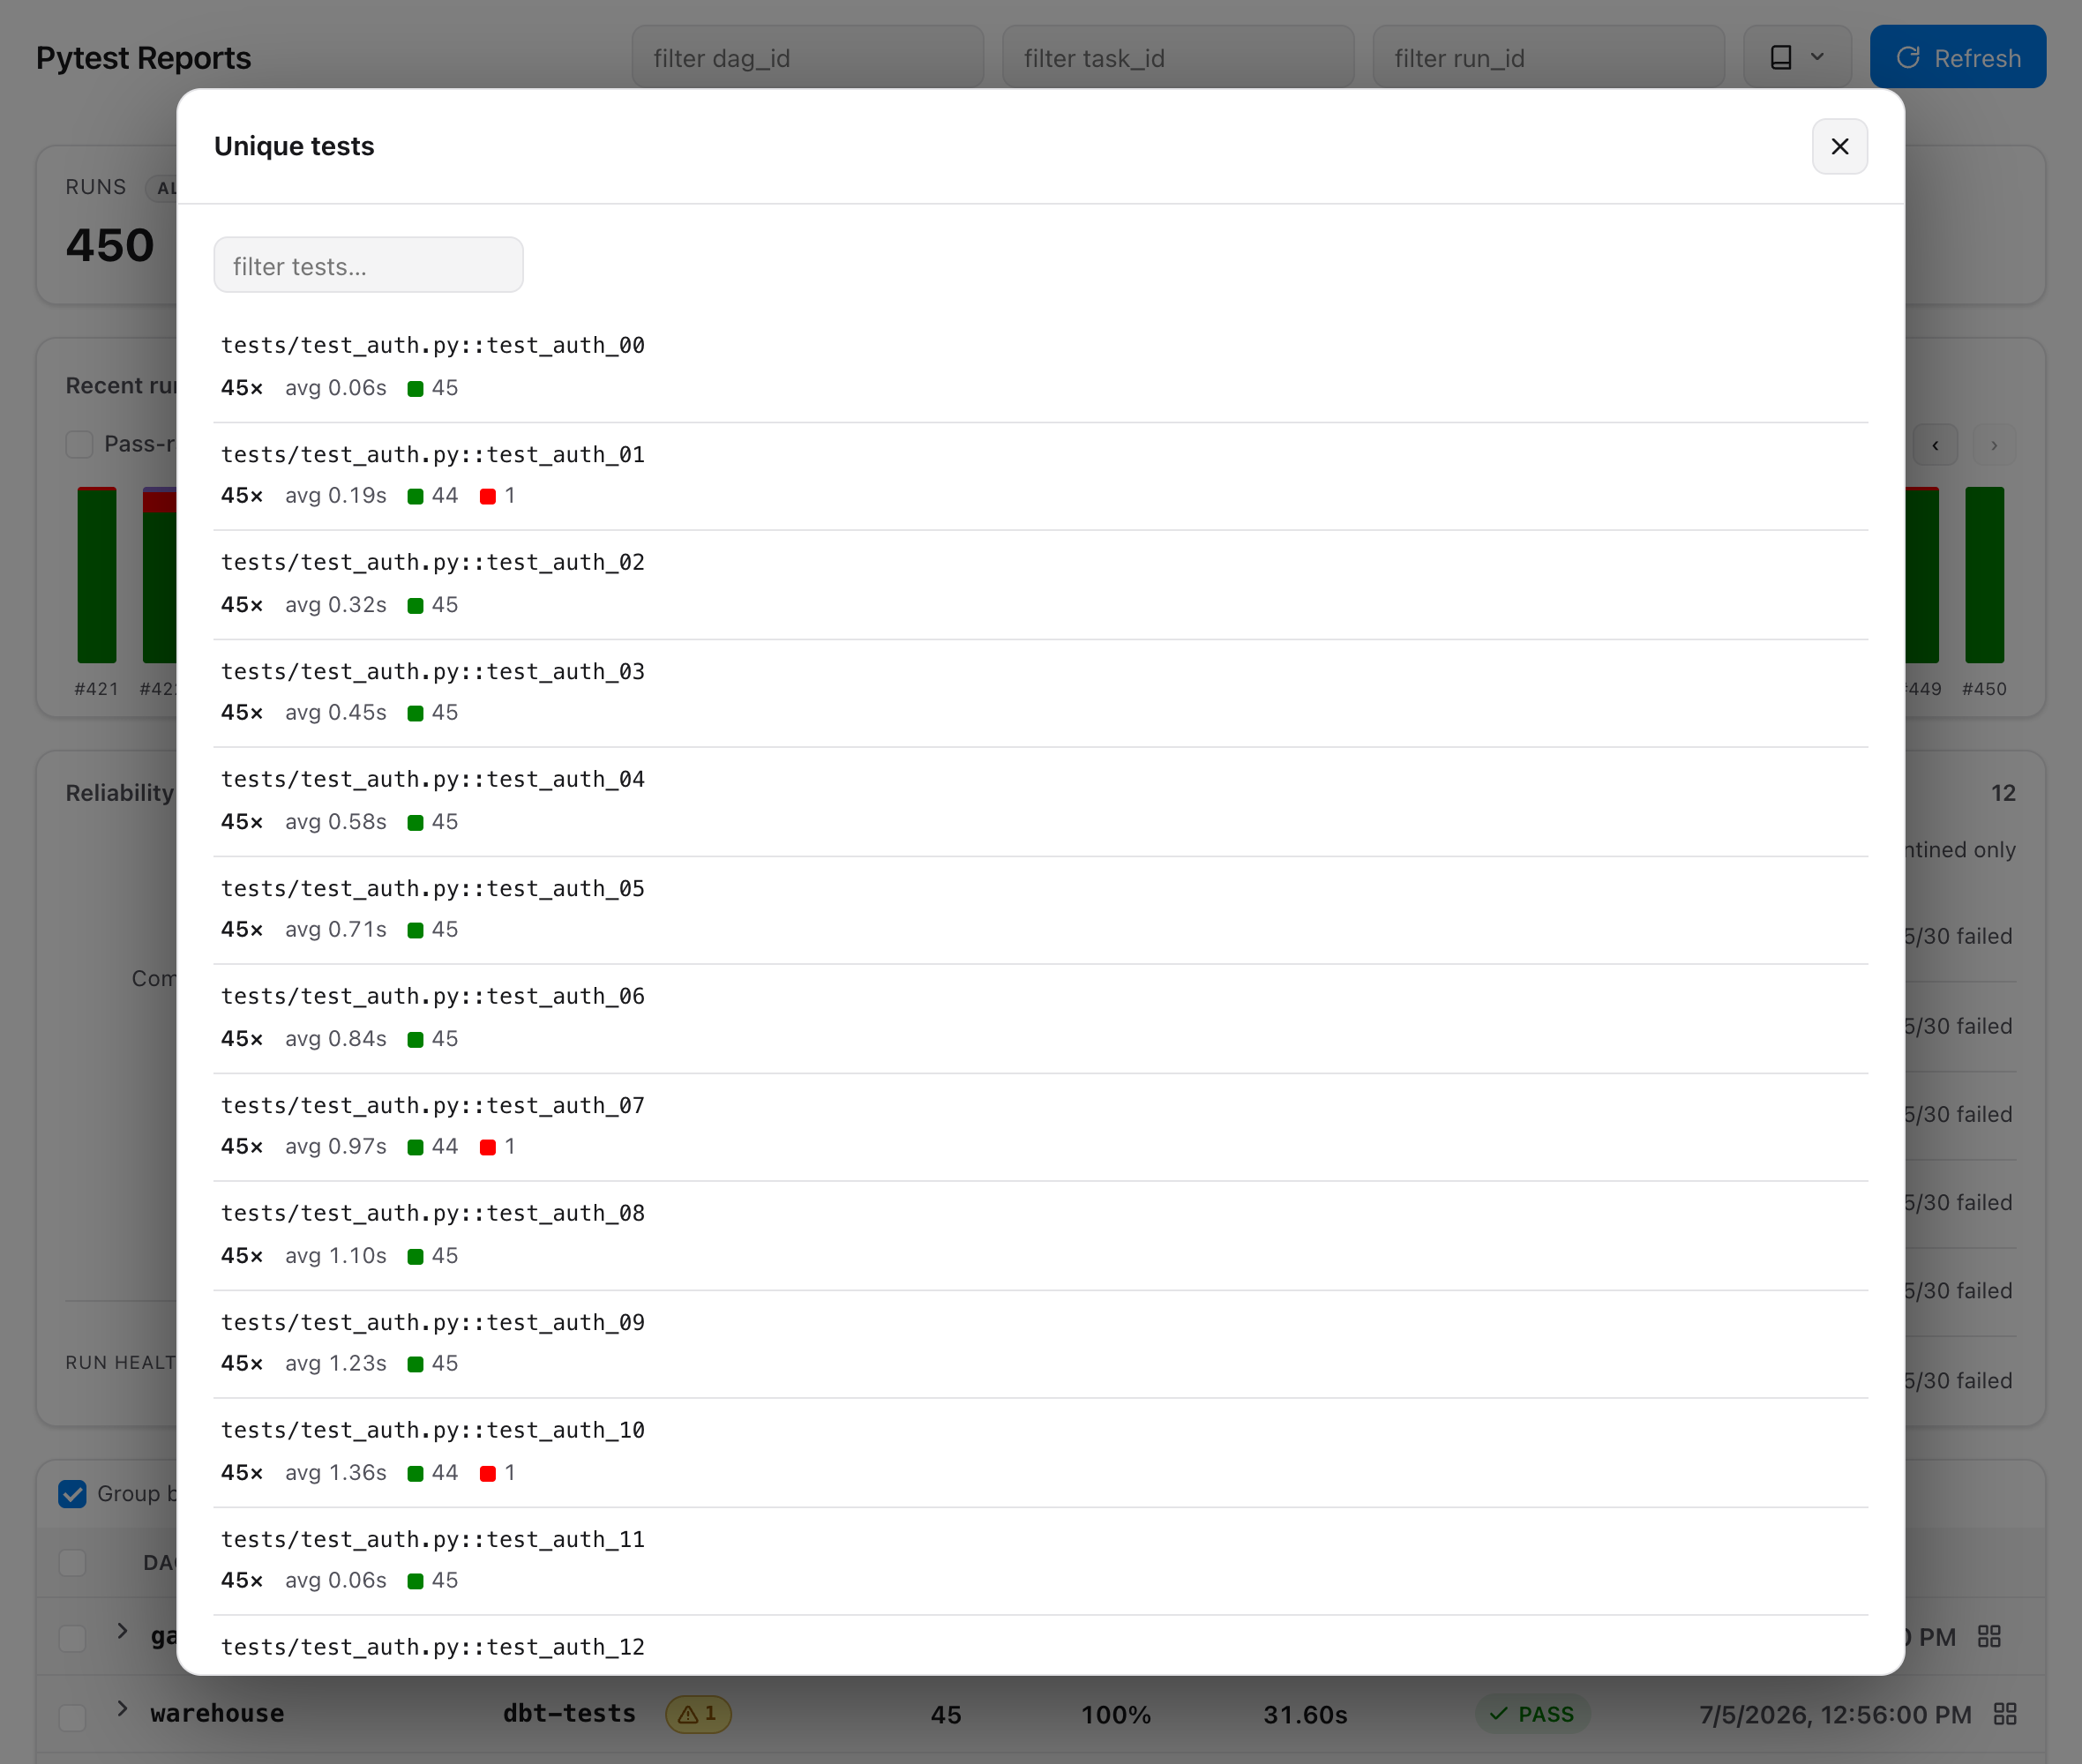
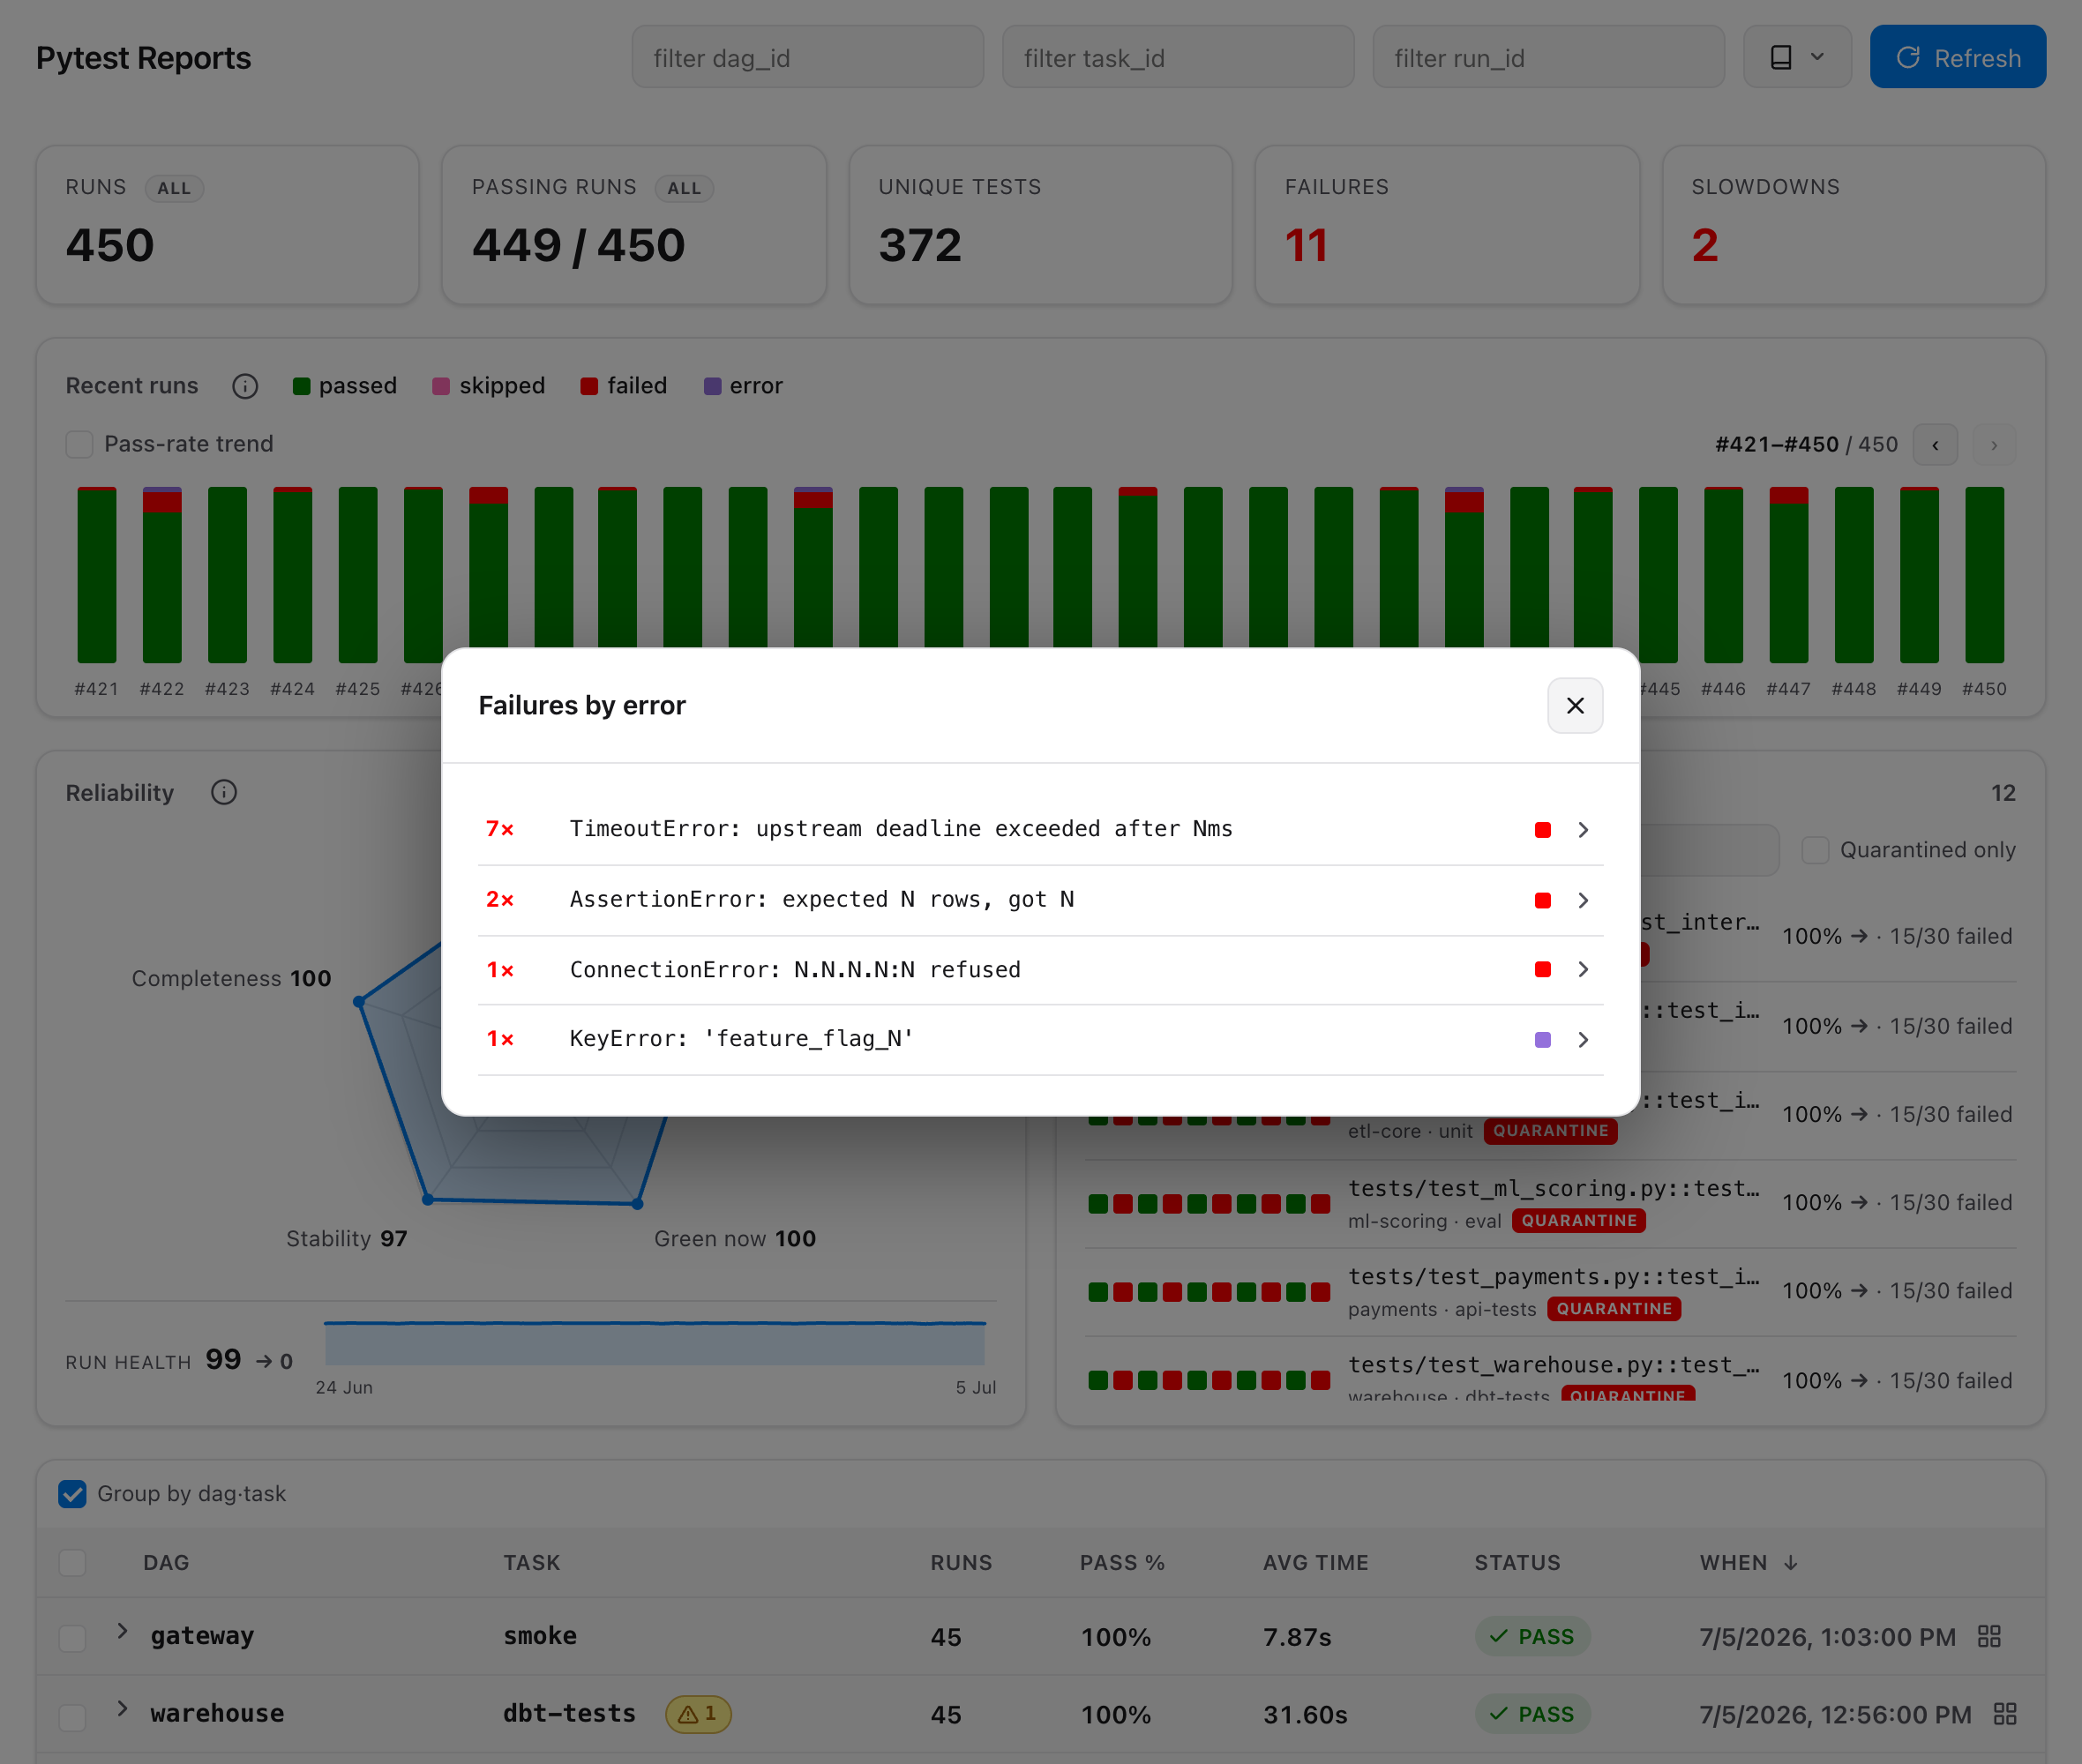
Unique tests & failures — the Unique tests KPI opens the searchable, paginated catalogue of every distinct test (each with its runs / pass-fail-error-skip counts / average time); the Failures KPI shows what's broken now — failures in each dag·task's latest run, so the count shrinks as tests are fixed — grouped into clusters by normalized error (biggest first) so common root causes surface instead of per-failure spam. Expand a cluster to its tests, or open the same clusters scoped to one run via the detail's Error clusters button:
Install
pip install airflow-pytest-plugin          # producer side (workers)
pip install 'airflow-pytest-plugin[web]'   # reader side (API server)
On Airflow 3 the API server already provides FastAPI, so the bare install is
enough there too; the [web] extra only adds the standalone dev server.
Quickstart
1. Point your operator at the archiving parser — the only DAG change:
from airflow_pytest_operator import PytestOperator
from airflow_pytest_plugin import ArchivingResultParser

PytestOperator(
    task_id="run_tests",
    test_path="tests/",
    parser=ArchivingResultParser(),   # was JUnitResultParser()
)
2. Tell both sides where reports live (one place, read by producer and reader alike):
export AIRFLOW_PYTEST_REPORTS_ROOT=/opt/airflow/pytest-reports
or in airflow.cfg:
[pytest_reports]
reports_root = /opt/airflow/pytest-reports
In a distributed deployment this should be a shared volume that both the workers (writing) and the API server (reading) can see.
3. Open the UI. The plugin registers itself via the airflow.plugins entry
point — no config. The app mounts on the API server at /pytest-reports, with a
Pytest Reports entry under Browse in the nav.
Preview locally, without Airflow
python -m airflow_pytest_plugin.web --root ./pytest-reports --port 8000
# open http://127.0.0.1:8000/
Do I need cleanup="never"?
No. In the operator, the parser owns the report location, and a
parser-supplied directory is never deleted by the runner under any cleanup
policy. ArchivingResultParser supplies its own directory, so reports
always survive regardless of the runner's cleanup setting. cleanup="never"
only matters when you let the runner use throwaway temp dirs — which is exactly
the fragile path (random names, no dag/run/task association, not visible to
other workers) this plugin replaces.
How it works
worker                              shared volume                 API server
──────                              ─────────────                 ──────────
PytestOperator                      {root}/{dag}/{run}/           FastAPI app
  └─ ArchivingResultParser ──▶   {task}/t{try}/        ◀──── FileSystemReportSource
       report_request() → path          ├─ junit.xml              └─ lists meta.json,
       parse()          → meta.json     └─ meta.json                 parses junit.xml
report_request()reads the live Airflow context (get_current_context(), available because the parser runs inside the task'sexecute()), computes the archive directory, and hands it to the operator's JUnit parser.parse()reuses the operator's JUnit parsing, then drops ameta.jsonsidecar carrying the Airflow coordinates + the summary. That sidecar makes each report self-describing, so the reader needs no database access.- The reader lists by scanning
meta.jsonfiles (fast) and parsesjunit.xmlon demand for the per-case detail.
The directory is a human-friendly container; the authoritative identity always
lives in meta.json (and the API's opaque, reversible report token), so awkward
run_id characters like : are sanitised in the path without losing anything.
HTTP API
The app is mountable under any prefix; the viewer derives its API base at runtime. Endpoints (relative to the mount):
| Method & path | Returns |
|---|---|
GET / |
the single-page viewer (HTML) |
GET /api/reports?dag_id=&run_id= |
summaries, newest first |
GET /api/reports/{report_id} |
one report with per-case rows |
GET /api/groups?dag_id=&task_id= |
runs aggregated by dag·task (count, pass-rate, avg duration, last status) |
GET /api/failures?dag_id=&run_id=&task_id=&latest= |
failed/errored cases — each dag·task's latest run by default (latest=0 for full history) |
GET /api/failure-clusters?dag_id=&run_id=&task_id=&latest= |
failures grouped by normalized error signature (biggest first); latest-run-only by default |
GET /api/compare?base=&head= |
per-test diff between two runs (newly failed / fixed / …) |
GET /api/flaky?dag_id=&task_id=&window= |
flaky tests with score, trend, and a quarantine flag |
GET /api/slow?dag_id=&task_id=&window= |
duration regressions (tests whose execution time got slower) + the slowest tests by average |
GET /api/heatmap?dag_id=&task_id=&window= |
test×run outcome matrix for one dag·task (rows = tests sorted most-broken first, cells = p/f/e/s/- aligned to recent runs) |
GET /api/test-history?dag_id=&task_id=&node_id=&limit= |
one test's outcome per run |
GET /api/unique-tests?dag_id=&task_id=&run_id=&full= |
distinct test count (+ when full, each test's runs / passed / failed / errors / skipped / avg duration) |
DELETE /api/reports/{report_id} |
delete a report (RBAC-gated) |
GET /api/reports/{report_id}/allure.zip |
raw Allure results as a zip (if any) |
GET /api/health |
liveness + readiness: status, ready, reports_root(+_exists), auth, secure_xml |
GET /api/version |
{"name": ..., "version": ...} from package metadata |
GET /api/metrics |
Prometheus exposition — opt-in, bearer-token (see Prometheus metrics) |
GET /api/docs |
OpenAPI docs (Swagger UI) |
The reads (GET) and the delete are gated by Airflow RBAC — see below.
Access control (RBAC)
Access is enforced the way Airflow 3 enforces it: every check goes through
Airflow's auth manager (is_authorized_dag(...)) — the same call Airflow's
own DAG-run endpoints make — keyed by the report's dag_id and the
authenticated user. Two permissions are checked:
| Action | Airflow 3.x check | Airflow 2.x (FAB) equivalent |
|---|---|---|
| See / open a report | is_authorized_dag(method="GET", access_entity=RUN) |
can_read on the DAG |
| Delete a report | is_authorized_dag(method="POST", access_entity=RUN) (may trigger the DAG) |
trigger / can_create on the DAG |
The report list is filtered to the DAGs you may read, opening a report you can't
read returns 403, and deleting one requires permission to trigger its DAG.
Every check fails closed: if the auth manager can't be consulted, access is
denied.
Airflow 2 → 3 mapping. Airflow 2's FAB used (action, resource) pairs —
can_read / can_edit / can_delete / can_create on a resource such as
DAG:<id>. Airflow 3 replaced these with the auth manager's method: GET ↔
read, POST ↔ create, PUT ↔ edit, DELETE ↔ delete, MENU ↔ menu access.
This plugin maps read → GET and delete → POST (trigger), so it
inherits your existing per-DAG roles with no extra configuration.
Plugin visibility. The nav entry is an Airflow external_views item, which
has no per-permission gate, so the menu link is visible to every signed-in user;
access is enforced on the content (a user who may read no DAG sees an empty
list and 403 on direct links). The standalone dev server (no Airflow auth)
allows everything.
Allure / TestOps export
Opt in per task and install allure-pytest
on the worker:
parser=ArchivingResultParser(allure=True)
The parser then adds --alluredir (pytest errors with unrecognized arguments
if allure-pytest is missing), so the raw Allure results are archived next to
the report, with an executor.json linking the launch back to the Airflow run.
Download them from a report's detail view, or GET /api/reports/{id}/allure.zip — then upload to Allure TestOps
(allurectl upload …). The JUnit viewer is unaffected; both artifacts coexist.
Configuration
| Setting | Default | Purpose |
|---|---|---|
AIRFLOW_PYTEST_REPORTS_ROOT (env) |
— | report root (highest precedence) |
[pytest_reports] reports_root (cfg) |
— | report root |
| built-in default | /opt/airflow/pytest-reports |
fallback |
AIRFLOW_PYTEST_PLUGIN_ENABLE (env) |
True |
reader on/off — see below |
AIRFLOW_PYTEST_SCAN_CACHE_TTL (env) |
2.0 |
seconds a directory scan is reused (0 disables) |
AIRFLOW_PYTEST_RETENTION_MAX_AGE_DAYS (env/cfg) |
— | delete runs older than N days |
AIRFLOW_PYTEST_RETENTION_MAX_RUNS (env/cfg) |
— | keep at most N newest runs per dag·task |
AIRFLOW_PYTEST_RETENTION_MAX_TOTAL_MB (env/cfg) |
— | total report-tree budget in MB |
AIRFLOW_PYTEST_FLAKY_WINDOW (env/cfg) |
30 |
default recent runs the flaky detector scans |
AIRFLOW_PYTEST_FLAKY_QUARANTINE_SCORE (env/cfg) |
0.5 |
flakiness score (0–1) that flags a test for quarantine |
AIRFLOW_PYTEST_FLAKY_MIN_SCORE (env/cfg) |
0.1 |
flakiness score (0–1) below which a test is not counted as flaky |
AIRFLOW_PYTEST_SLOW_FACTOR (env/cfg) |
1.3 |
how much slower (recent-half avg ÷ older half, ≥1) a test must get to count as a duration regression |
AIRFLOW_PYTEST_SLOW_MIN_DELTA (env/cfg) |
0.5 |
minimum absolute slowdown in seconds for a regression to register (filters jittery fast tests) |
AIRFLOW_PYTEST_SUCCESS_THRESHOLD (env/cfg) |
0.85 |
pass-rate (0–1) over executed tests at/above which a run counts as successful (Passing runs); 1.0 = strict, zero failures/errors |
AIRFLOW_PYTEST_METRICS_TOKEN (env/cfg) |
— | bearer token that enables the Prometheus /api/metrics endpoint; unset = disabled (see below) |
Enable / disable the reader. Set AIRFLOW_PYTEST_PLUGIN_ENABLE to a falsey
value (0, false, no, off) to stop the plugin registering its UI and API
with Airflow; any other value, or leaving it unset, keeps it on (the default).
This is a kill switch for the reader only — the producer-side
ArchivingResultParser still archives reports regardless. It is read once at
plugin discovery, so toggling it takes effect on the next API-server restart.
export AIRFLOW_PYTEST_PLUGIN_ENABLE=false # hide the Pytest Reports UI + API
Scan cache. Loading the home page hits several summary-driven endpoints (the run
list, the flaky panel, the unique-tests count), and the filter box queries as you
type. To avoid walking the report tree once per call, the filesystem source reuses a
single scan for AIRFLOW_PYTEST_SCAN_CACHE_TTL seconds (default 2.0; deletes
invalidate it immediately). New runs therefore appear within a couple of seconds (or
on Refresh); set it to 0 for no caching, or higher on a very large tree.
Prometheus metrics
GET /api/metrics exposes per-dag·task gauges (from each dag·task's latest run)
in the Prometheus text format — airflow_pytest_latest_{passed,failed,errors,skipped, tests,pass_ratio,duration_seconds,success,run_timestamp_seconds}{dag_id,task_id} and
airflow_pytest_dagtask_runs{dag_id,task_id}, plus globals
airflow_pytest_{up,runs,dagtasks,latest_failures,series_truncated,build_info} (all gauges).
It's disabled by default and turns on only when you set a scrape token; requests must then present it as a bearer token (constant-time compared). The scrape is cheap and bounded — one cached directory scan, summary-derived (no per-run reads), capped at 2000 series — so it's safe to poll frequently.
export AIRFLOW_PYTEST_METRICS_TOKEN="$(openssl rand -hex 16)"
# prometheus.yml
scrape_configs:
  - job_name: airflow-pytest
    metrics_path: /pytest-reports/api/metrics   # the plugin's mount prefix
    authorization:
      credentials: "<AIRFLOW_PYTEST_METRICS_TOKEN>"
    static_configs:
      - targets: ["airflow-apiserver:8080"]
Retention (auto-cleanup)
Reports accumulate forever unless you prune them. Set any of the
AIRFLOW_PYTEST_RETENTION_* knobs above (all opt-in; unset = keep everything) and
schedule prune_reports from a maintenance DAG:
from airflow import DAG
from airflow.providers.standard.operators.python import PythonOperator
from airflow_pytest_plugin import prune_reports

with DAG("pytest_reports_retention", schedule="@daily", catchup=False, ...):
    PythonOperator(task_id="prune", python_callable=prune_reports)
Each knob is a dimension and they combine as a union — a run is deleted if any applies:
- age — older than
…_MAX_AGE_DAYS; - count — beyond the newest
…_MAX_RUNSof its dag·task; - size — oldest-first until the tree fits
…_MAX_TOTAL_MB.
The newest run of each dag·task is always kept, so a task's latest result never
disappears. prune_reports(dry_run=True) reports what would go without deleting
(its RetentionResult carries deleted, freed_bytes, scanned). Cleanup is
scheduler-driven — the plugin never deletes on its own. For a custom policy, build a
RetentionPolicy(...) and pass it (prune_reports(policy)).
Architecture (SOLID)
Mirrors the operator's layering — each piece has one reason to change:
| Module | Responsibility |
|---|---|
layout.ReportLayout |
the single ReportRef → directory mapping, shared by both sides |
producer.ArchivingResultParser |
write JUnit XML + meta.json (extends the operator's parser) |
sources.ReportSource / FileSystemReportSource |
read/index reports behind an interface (Dependency Inversion) |
web.create_app |
map HTTP onto a ReportSource — knows nothing about the filesystem |
retention |
pure select_expired decision + a prune orchestrator over any ReportSource |
plugin.PytestReportsPlugin |
register the app with Airflow |
compat |
the only module that imports Airflow; version differences resolved once |
models |
JSON-serializable view types; the web layer never sees operator types |
Adding a different backing store (e.g. an XComReportSource reading the
metadata DB) is a new ReportSource, not an edit of the web app (Open/Closed).
Development
pip install -e '.[dev,web]'
pytest -q
ruff check src tests && ruff format --check src tests
mypy src
License
Apache-2.0. See LICENSE.
Project details
Verified details
These details have been verified by PyPIProject links
GitHub Statistics
Maintainers
Release history Release notifications | RSS feed


Download files
Download the file for your platform. If you're not sure which to choose, learn more about installing packages.
Source Distribution
Built Distribution
Filter files by name, interpreter, ABI, and platform.
If you're not sure about the file name format, learn more about wheel file names.
Copy a direct link to the current filters
File details
Details for the file airflow_pytest_plugin-0.5.0.tar.gz.
File metadata
- Download URL: airflow_pytest_plugin-0.5.0.tar.gz
- Upload date:
- Size: 162.2 kB
- Tags: Source
- Uploaded using Trusted Publishing? Yes
- Uploaded via: twine/6.1.0 CPython/3.13.13
File hashes
| Algorithm | Hash digest | |
|---|---|---|
| SHA256 |
3863cdff723345c0777c1a4bcf7e9b53e245a0de1f76ccf52c456cb76527b7b5
|
|
| MD5 |
564c56b426245e81a60a9c4c17013698
|
|
| BLAKE2b-256 |
daef156e304bb7bcf35d2507810bfd838e4bdb1f3e85d057003df74f29fc59b0
|
Provenance
The following attestation bundles were made for airflow_pytest_plugin-0.5.0.tar.gz:
Publisher:
release.yml on IKrysanov/airflow-pytest-plugin
-
Statement:
-
Statement type:
https://in-toto.io/Statement/v1 -
Predicate type:
https://docs.pypi.org/attestations/publish/v1 -
Subject name:
airflow_pytest_plugin-0.5.0.tar.gz -
Subject digest:
3863cdff723345c0777c1a4bcf7e9b53e245a0de1f76ccf52c456cb76527b7b5 - Sigstore transparency entry: 2047877513
- Sigstore integration time:
-
Permalink:
IKrysanov/airflow-pytest-plugin@21c1ac3a193b6fb75aac101d7d97ba25adb19410 -
Branch / Tag:
refs/tags/v0.5.0 - Owner: https://github.com/IKrysanov
-
Access:
public
-
Token Issuer:
https://token.actions.githubusercontent.com -
Runner Environment:
github-hosted -
Publication workflow:
release.yml@21c1ac3a193b6fb75aac101d7d97ba25adb19410 -
Trigger Event:
release
-
Statement type:
File details
Details for the file airflow_pytest_plugin-0.5.0-py3-none-any.whl.
File metadata
- Download URL: airflow_pytest_plugin-0.5.0-py3-none-any.whl
- Upload date:
- Size: 134.5 kB
- Tags: Python 3
- Uploaded using Trusted Publishing? Yes
- Uploaded via: twine/6.1.0 CPython/3.13.13
File hashes
| Algorithm | Hash digest | |
|---|---|---|
| SHA256 |
1b2864ae49855da2a1749260e2ebfee388b0865cfddb3045576e57ec6ac538da
|
|
| MD5 |
fbd9f97f68211defe4b0dfcb7924d2b0
|
|
| BLAKE2b-256 |
2bcc40e7da32a15cb17d90031d923b4f251e4065e1b1f911c4da31da4575619a
|
Provenance
The following attestation bundles were made for airflow_pytest_plugin-0.5.0-py3-none-any.whl:
Publisher:
release.yml on IKrysanov/airflow-pytest-plugin
-
Statement:
-
Statement type:
https://in-toto.io/Statement/v1 -
Predicate type:
https://docs.pypi.org/attestations/publish/v1 -
Subject name:
airflow_pytest_plugin-0.5.0-py3-none-any.whl -
Subject digest:
1b2864ae49855da2a1749260e2ebfee388b0865cfddb3045576e57ec6ac538da - Sigstore transparency entry: 2047877534
- Sigstore integration time:
-
Permalink:
IKrysanov/airflow-pytest-plugin@21c1ac3a193b6fb75aac101d7d97ba25adb19410 -
Branch / Tag:
refs/tags/v0.5.0 - Owner: https://github.com/IKrysanov
-
Access:
public
-
Token Issuer:
https://token.actions.githubusercontent.com -
Runner Environment:
github-hosted -
Publication workflow:
release.yml@21c1ac3a193b6fb75aac101d7d97ba25adb19410 -
Trigger Event:
release
-
Statement type:






