
An easy way to calculate CCBHC measurements.

Project description
CCBHC Measurements
Table of Contents
- Purpose
- Currently Supported Measurements
- Code Demonstration
- De-panda-cies
- License
- Installation
- Contributors
- Contributions and Discussions
Purpose
This package is designed to simplify CCBHC reporting by automating the measurement process. It accepts all relevant clinical —such as PHQ-9s, AUDITs, and SDOH screenings— and insurance data and returns a labeled DataFrame indicating whether each patient meets the criteria for the chosen CCBHC measurements. The package is designed to be comprehensive in that you can give it ALL your historical data and it will output EVERY patient labeled in EVERY Measurement Year for a given Measurement. Take a look at this DEP-REM-6 example:
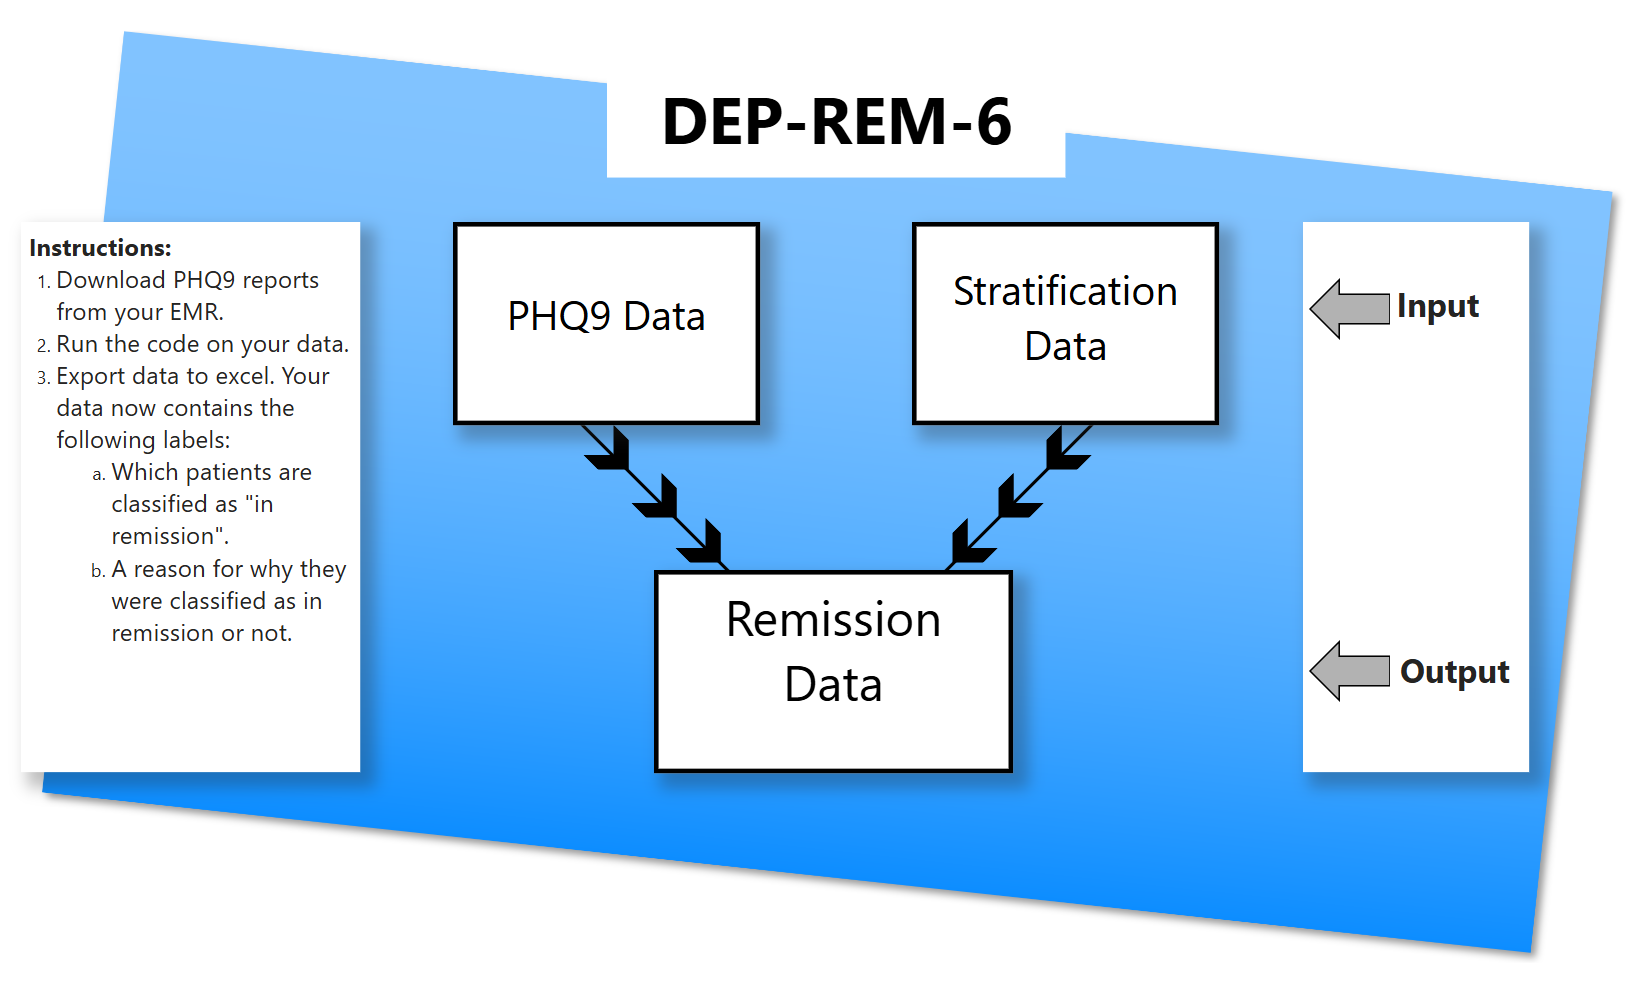
Click here for the more detailed DEP-REM-6 example pdf
1. Data Processing
Our code is simple:
- Import the Measurement you want to calculate.
- Give it the required data (downloaded excel reports from your EHR, query data from SQL, or whatever)
- Run
get_all_submeasures(). Under the hood,get_all_submeasures()determines which data meets the Measurments criteria and which does not. - Export your data to your preferred tool for analysis. If you want to keep it in pandas, you already have it. If you want to use Excel, or Power BI, you can export it there as well!
2. Dashboard Display
We've also created a base Power BI file as a foundation for a dashboard. Check out the dashboard folder here.

Currently Supported Measurements
- DEP REM 6 - Depression Remission at Six Months
- ASC - Preventive Care and Screening: Unhealthy Alcohol Use: Screening & Brief Counseling
- SDOH - Social Determinants of Health
- CDF-AD - Clinical Depression & Follow up
- CDF-CH - Clinical Depression & Follow up
The definition for these Measurements can be found at https://www.samhsa.gov/sites/default/files/ccbhc-quality-measures-technical-specifications-manual.pdf
IMPORTANT We unsure if we will be implementing the I-SERV Measurement and its SubMeasures. We would like to hear your thoughts on the matter, feel free to email us and let us know what you think.
Moving forward, our focus will shift from the SAMHSA-required measurements to those mandated by New York State.
Code Demonstration
This is a basic demonstration for the Dep-Rem-6 Measurement, see here for more in depth demonstrations
import pandas as pd
import ccbhc_measurements as ccbhc
- Step 1: Load in the data into Pandas Dataframes
all_inclusive_excel_file = r"../file/path/to/Dep Rem Data.xlsx"
phq_data = pd.read_xlsx(all_inclusive_excel_file, sheet_name = "phq9")
diagnosis_data = pd.read_xlsx(all_inclusive_excel_file, sheet_name = "diagnosis")
demographic_data = pd.read_xlsx(all_inclusive_excel_file, sheet_name = "demographic")
insurance_data = pd.read_xlsx(all_inclusive_excel_file, sheet_name = "insurance")
- Step 2: Ensure that the dataframes follows the correct schema
Dep Rem 6 Required Data Input and Output Diagram
phq_data = phq_data[["patient_id","patient_DOB","encounter_id","encounter_datetime","total_score"]].copy()
diagnosis_data = diagnosis_data[["patient_id","encounter_datetime","diagnosis"]].copy()
demographic_data = demographic_data[["patient_id","race","ethnicity"]].copy()
insurance_data = insurance_data[["patient_id","insurance","start_datetime","end_datetime"]].copy()
- Step 3: Calculate Dep-Rem
submeasure_data = [phq_data,diagnosis_data,demographic_data,insurance_data]
measure = ccbhc.Dep_Rem(submeasure_data)
results = measure.get_all_submeasures()
for name, data in results.items():
    data.to_excel(name+".xlsx", index=False)
Example Data Output:
| patient_id | patient_measurement_year_id | encounter_id | age | medicaid | numerator | numerator_reason |
|---|---|---|---|---|---|---|
| 1 | 1-2024 | 1 | 18+ | FALSE | TRUE | Has Remission |
| 2 | 1-2025 | 3 | 18+ | FALSE | FALSE | Remission Period not Reached |
| 3 | 3-2024 | 4 | 18+ | FALSE | FALSE | No PHQ-9 Follow Up |
| 4 | 4-2024 | 5 | 18+ | FALSE | FALSE | No Remission |
- Step 4: Create a Dashboard in Power BI (Optional)
We've created an example dashboard in Power BI for easy implementation but feel free to use the analysis tool of your choice. Feel free to download it from the dashboard folder.
De-panda-cies
License
Installation
Binary installers for the latest released version are available at the Python Package Index (PyPI)
# PyPI
pip install ccbhc_measurements
Contributors
- Alex Gursky - Data Engineer
- Max Friedman - Data Engineer
- Yisroel Len - Director of Data Analytics & CCBHC Project Evaluator
Contributions and Discussions
Feel free to add and create you own Measurements. All Measurements should follow this uml and you can use this guide to show you how to do it!
Send us your recomendations, bugs, questions or feedback at agursky@pesachtikvah.com
Release history Release notifications | RSS feed


Download files
Download the file for your platform. If you're not sure which to choose, learn more about installing packages.
Source Distribution
Built Distribution
Filter files by name, interpreter, ABI, and platform.
If you're not sure about the file name format, learn more about wheel file names.
Copy a direct link to the current filters
File details
Details for the file ccbhc_measurements-2025.10.23.tar.gz.
File metadata
- Download URL: ccbhc_measurements-2025.10.23.tar.gz
- Upload date:
- Size: 37.3 kB
- Tags: Source
- Uploaded using Trusted Publishing? No
- Uploaded via: twine/6.1.0 CPython/3.12.9
File hashes
| Algorithm | Hash digest | |
|---|---|---|
| SHA256 |
8c94d0bb7b9659d9368b64a25afa987f40c1c4d8c96da292201946bfd3409ea3
|
|
| MD5 |
176a760c9ba32b1ca0658d39643577c6
|
|
| BLAKE2b-256 |
fe230377e2ea17680dee1238da30d5c8bd98a29fa4cee45985d01aa6c860ffdf
|
File details
Details for the file ccbhc_measurements-2025.10.23-py3-none-any.whl.
File metadata
- Download URL: ccbhc_measurements-2025.10.23-py3-none-any.whl
- Upload date:
- Size: 53.2 kB
- Tags: Python 3
- Uploaded using Trusted Publishing? No
- Uploaded via: twine/6.1.0 CPython/3.12.9
File hashes
| Algorithm | Hash digest | |
|---|---|---|
| SHA256 |
aab3d7b01be87b7dad5c892a784294a0ff4f4586544404d66098dd8c5d04f1a3
|
|
| MD5 |
e8ee01c8bf376fd0c79072225a50e8c1
|
|
| BLAKE2b-256 |
3f410743a09d33870640e08ba67f7c24ada9bb1f6b9759c058b6189d6dccf7a0
|






