A Python library for creating comutation plots to visualize genomic and phenotypic information

Project description
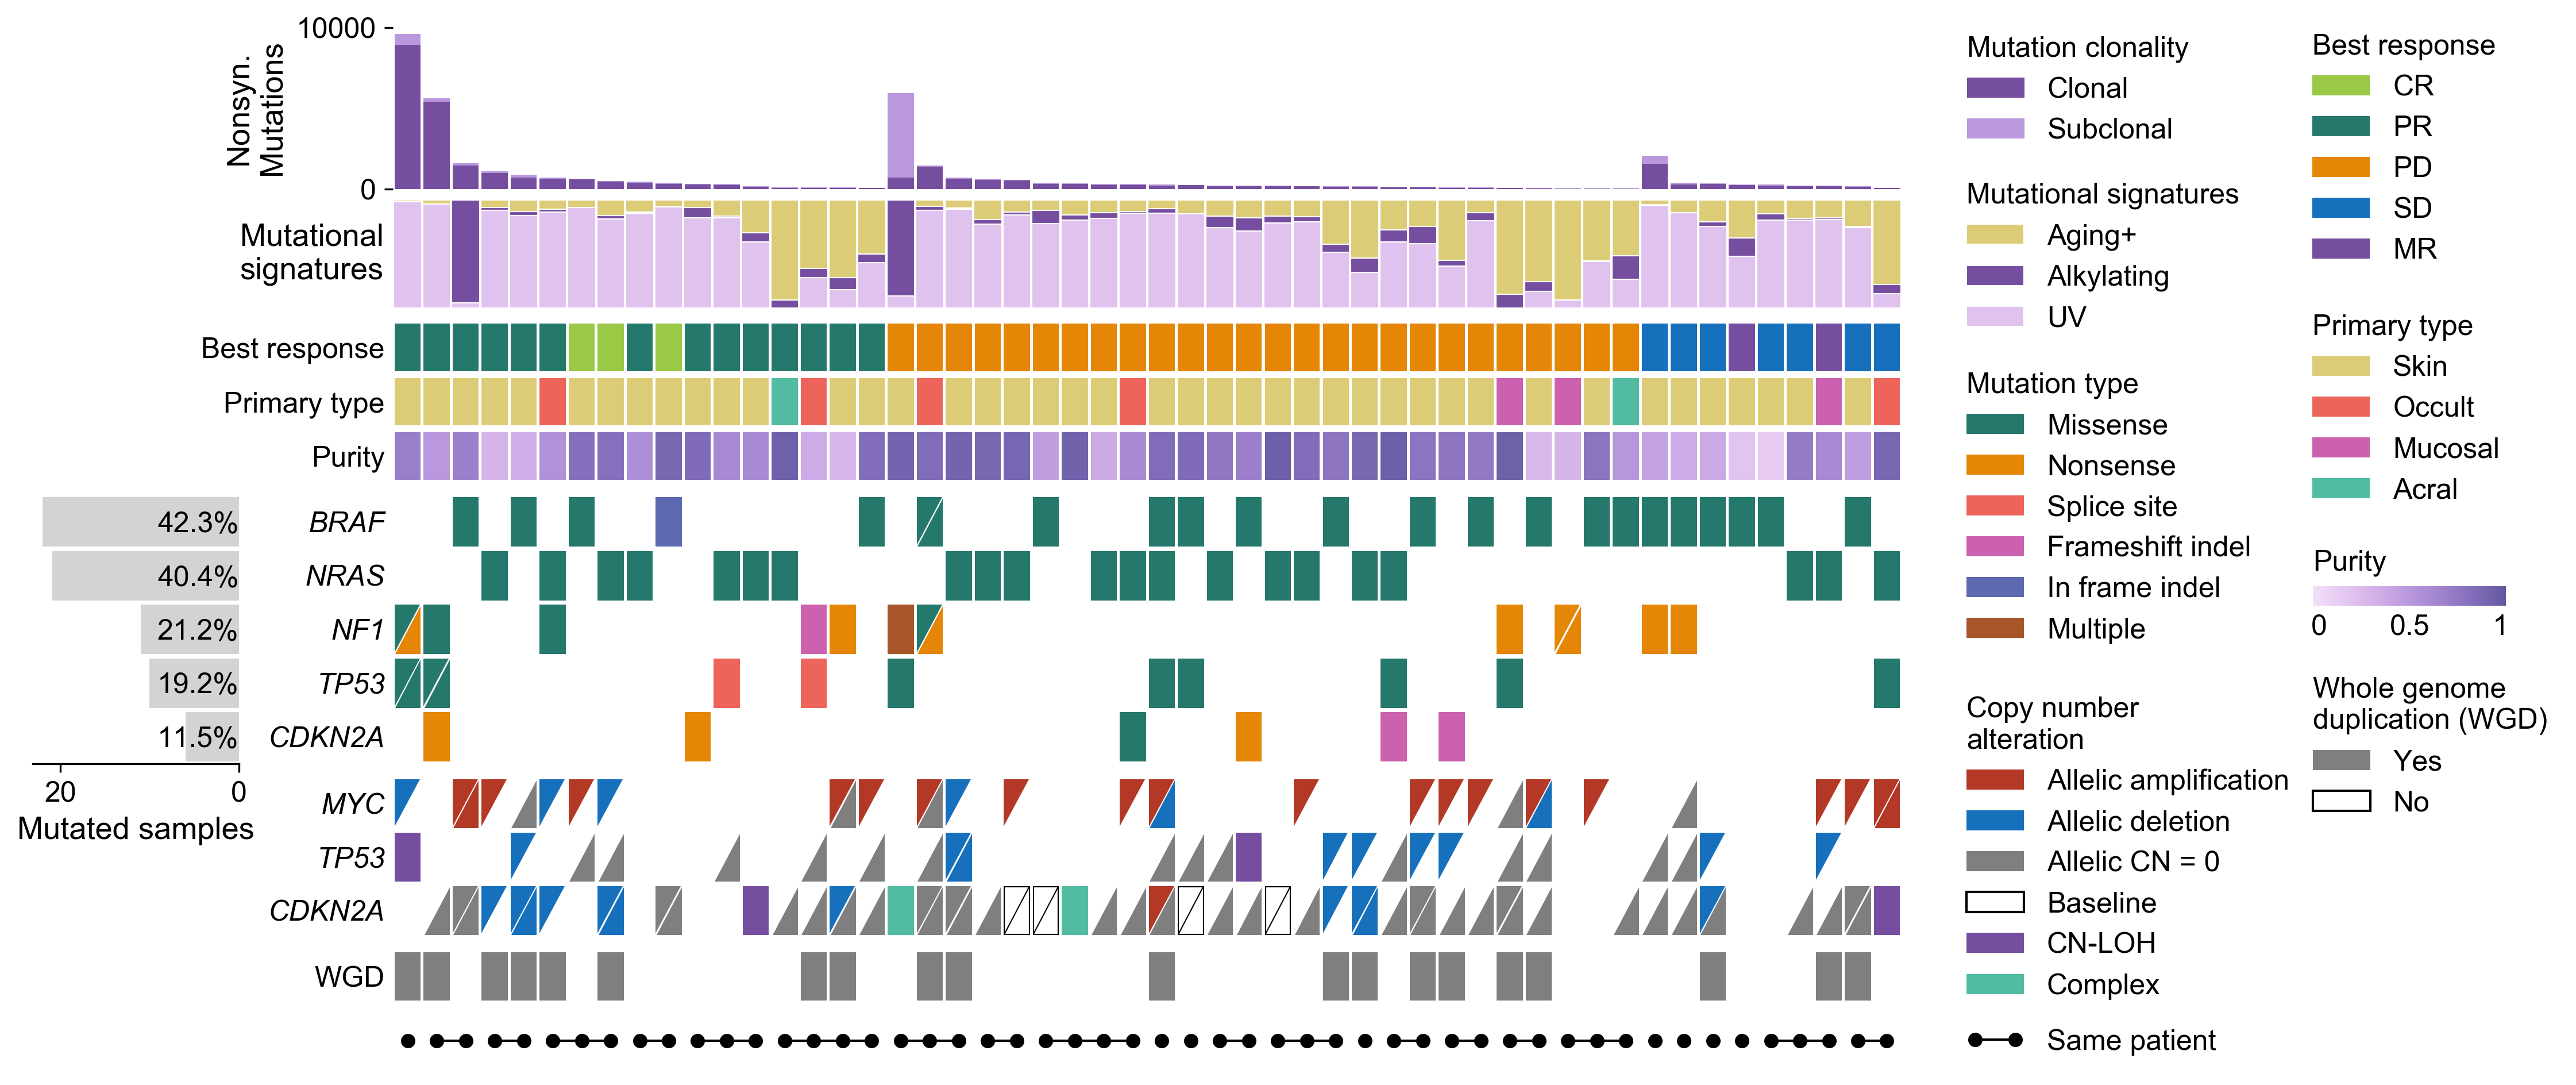
CoMut
CoMut is a Python library for creating comutation plots to visualize genomic and phenotypic information.
Installation
CoMut can be installed via pip
pip install comut
Colab Quickstart
For those who do not want to install Python or other packages, there is a Google Colab notebook where you can simply upload a MAF file and run the notebook to make a basic comut. This file is also available as a jupyter notebook for local use.
Citation
CoMut is now available on biorxiv https://www.biorxiv.org/content/10.1101/2020.03.18.997361v1. If you use CoMut in a paper, please cite:
Crowdis, J., He, M.X., Reardon, B., Van Allen, E.M. (2020). CoMut: Visualizing integrated molecular information with comutation plots. bioRxiv doi: 10.1101/2020.03.18.997361v1
Documentation
There is also a Documentation notebook that provides documentation for CoMut. It describes the fundamentals of creating comuts and provides the code used to generate the comut above.
Development
If you would like to report a bug or request a feature, please do so using the issues page
Dependencies
CoMut runs on python 3.6 or later. CoMut requires the following packages as dependencies (they will be installed along with CoMut if using pip)
numpy>=1.18.1
pandas>=0.25.3
palettable>=3.3.0
matplotlib>=3.3.1
Versions
0.0.3 - No code is changed, description updated for public release
0.0.2 - Introduce compatability for Python 3.6
0.0.1 - Initial release
Release history Release notifications | RSS feed


Download files
Download the file for your platform. If you're not sure which to choose, learn more about installing packages.
Source Distribution
Built Distribution
Filter files by name, interpreter, ABI, and platform.
If you're not sure about the file name format, learn more about wheel file names.
Copy a direct link to the current filters
File details
Details for the file comut-0.0.3.tar.gz.
File metadata
- Download URL: comut-0.0.3.tar.gz
- Upload date:
- Size: 18.3 kB
- Tags: Source
- Uploaded using Trusted Publishing? No
- Uploaded via: twine/3.1.1 pkginfo/1.5.0.1 requests/2.22.0 setuptools/46.0.0 requests-toolbelt/0.9.1 tqdm/4.41.1 CPython/3.7.3
File hashes
| Algorithm | Hash digest | |
|---|---|---|
| SHA256 |
8ed67d646766b5868de060d65b5535e2c906b6a3706830f37f8e6351e2f579d2
|
|
| MD5 |
c59d8a83b2f0d8f0b7d08c663f2d4caa
|
|
| BLAKE2b-256 |
dc2933b844c94cf85dc20e67c57ef164dcda5781565e2a1fb43694d478ba04af
|
File details
Details for the file comut-0.0.3-py3-none-any.whl.
File metadata
- Download URL: comut-0.0.3-py3-none-any.whl
- Upload date:
- Size: 18.3 kB
- Tags: Python 3
- Uploaded using Trusted Publishing? No
- Uploaded via: twine/3.1.1 pkginfo/1.5.0.1 requests/2.22.0 setuptools/46.0.0 requests-toolbelt/0.9.1 tqdm/4.41.1 CPython/3.7.3
File hashes
| Algorithm | Hash digest | |
|---|---|---|
| SHA256 |
7aac730bb894c356f25cddab1d1e5c39a8a2a3a593d0d10afd367aab8354baa3
|
|
| MD5 |
ea1f5bde630512284c87eab87815e8dd
|
|
| BLAKE2b-256 |
97fe631b83e3744c9d66b87c531ab8cceddbcdf8990f5f36174331d65c77c5fa
|


