

Plot complex-valued functions with style.









cplot helps plotting complex-valued functions in a visually appealing manner.
Install with
pip install cplot
and use as
import numpy as np

import cplot


def f(z):
    return np.sin(z**3) / z


plt = cplot.plot(
    f,
    (-2.0, +2.0, 400),
    (-2.0, +2.0, 400),
    # abs_scaling=lambda x: x / (x + 1),  # how to scale the lightness in domain coloring
    # contours_abs=2.0,
    # contours_arg=(-np.pi / 2, 0, np.pi / 2, np.pi),
    # emphasize_abs_contour_1: bool = True,
    # add_colorbars: bool = True,
    # add_axes_labels: bool = True,
    # saturation_adjustment: float = 1.28,
    # min_contour_length = None,
    # linewidth = None,
)
plt.show()
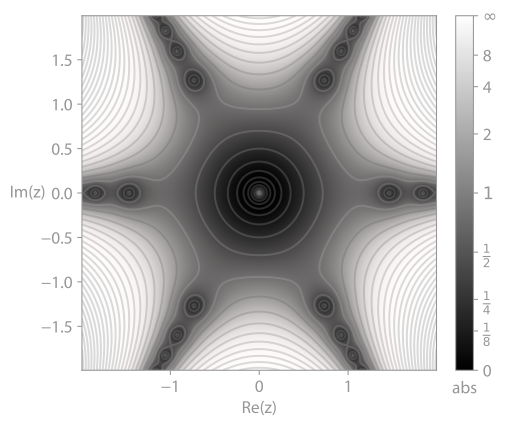
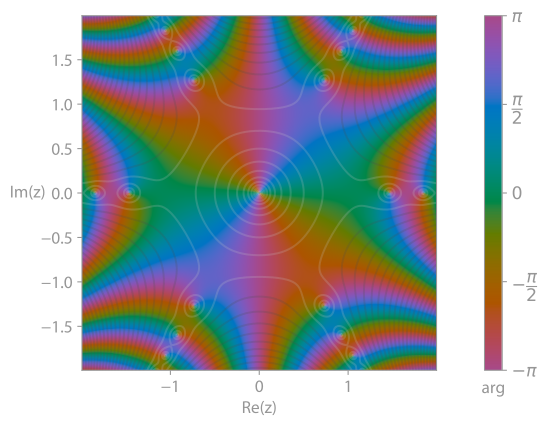
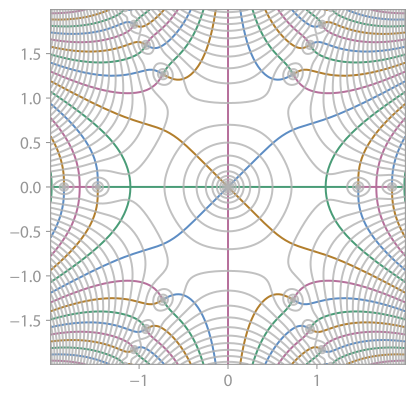
Historically, plotting of complex functions was in one of three ways
 |
 |
 |
|---|---|---|
| Only show the absolute value; sometimes as a 3D plot | Only show the phase/the argument in a color wheel (phase portrait) | Show contour lines for both arg and abs |
Combining all three of them gives you a cplot:
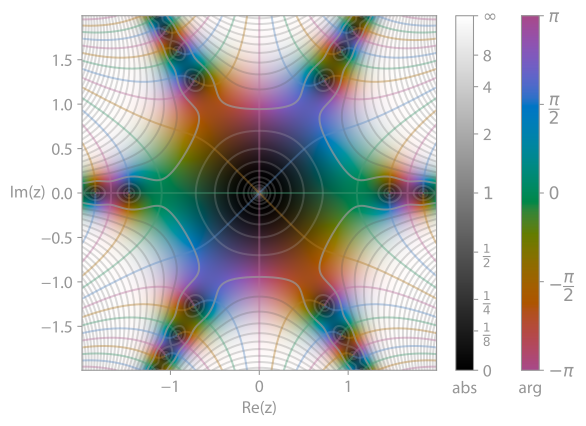
See also Wikipedia: Domain coloring.
Features of this software:
- cplot uses OKLAB, a perceptually uniform color space for the argument colors. This avoids streaks of colors occurring with other color spaces, e.g., HSL.
- The contour
abs(z) == 1is emphasized, other abs contours are at 2, 4, 8, etc. and 1/2, 1/4, 1/8, etc., respectively. This makes it easy to tell the absolte value precisely. - For
arg(z) == 0, the color is green, forarg(z) == pi/2it's blue, forarg(z) = -pi / 2it's orange, and forarg(z) = piit's pink.
Other useful functions:
# There is a tripcolor function as well for triangulated 2D domains
cplot.tripcolor(triang, z)

# The function get_srgb1 returns the SRGB1 triple for every complex input value.
# (Accepts arrays, too.)
z = 2 + 5j
val = cplot.get_srgb1(z)
Riemann sphere
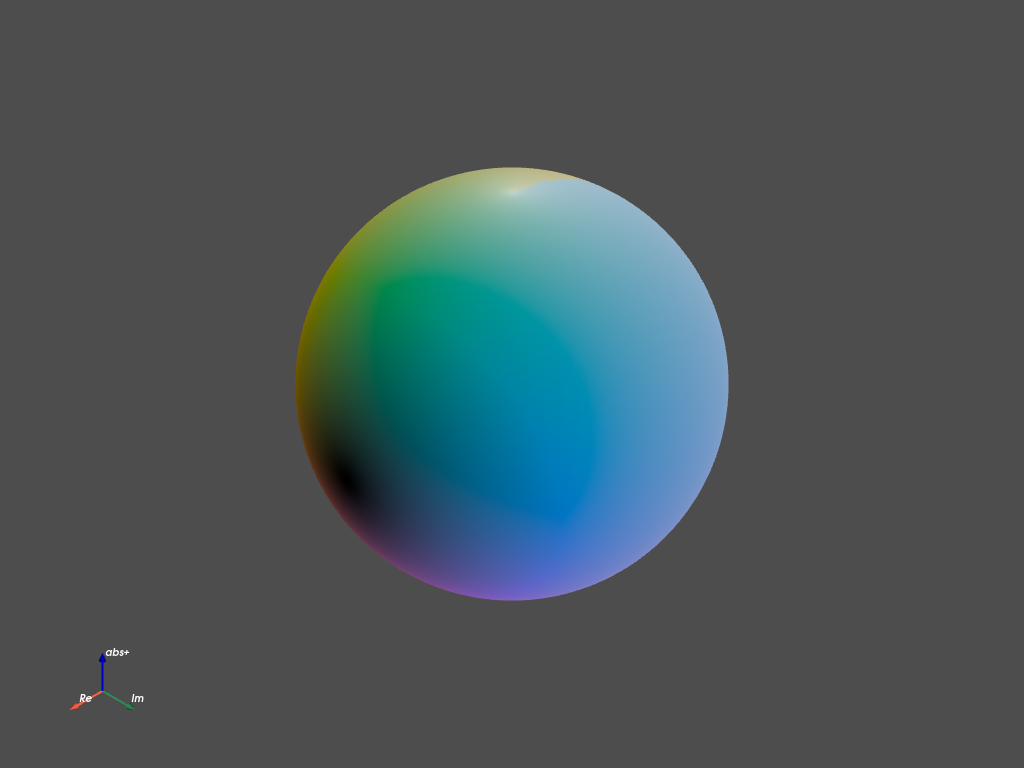
cplot can also plot functions on the Riemann sphere, a mapping of the complex plane to the unit ball.
import cplot
import numpy as np

cplot.riemann_sphere(np.log)
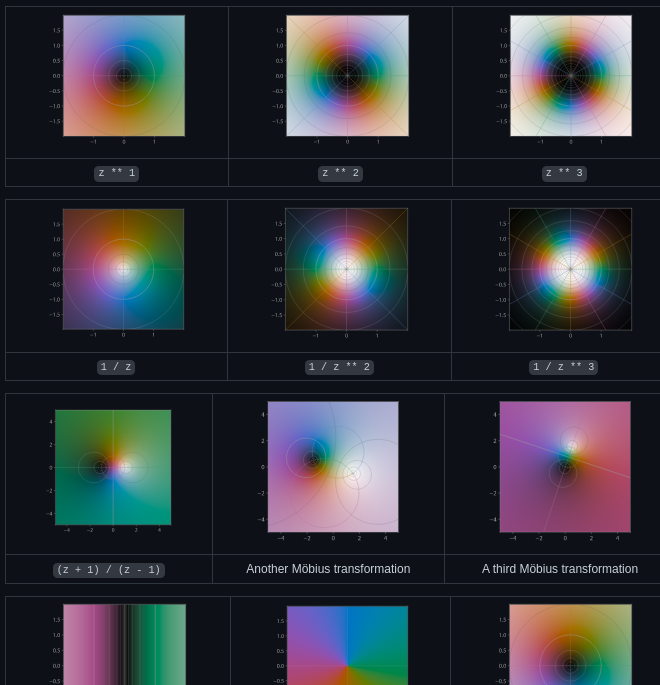
Gallery
Testing
To run the cplot unit tests, check out this repository and run
tox
Similar projects and further reading
- Tristan Needham, Visual Complex Analysis, 1997
- François Labelle, A Gallery of Complex Functions, 2002
- Douglas Arnold and Jonathan Rogness, Möbius transformations revealed, 2008
- Konstantin Poelke and Konrad Polthier, Lifted Domain Coloring, 2009
- Elias Wegert and Gunter Semmler, Phase Plots of Complex Functions: a Journey in Illustration, 2011
- Elias Wegert, Calendars Complex Beauties, 2011-
- Elias Wegert, Visual Complex Functions, 2012
- empet, Visualizing complex-valued functions with Matplotlib and Mayavi, Domain coloring method, 2014
- John D. Cook, Visualizing complex functions, 2017
- endolith, complex-colormap, 2017
- Anthony Hernandez, dcolor, 2017
- Juan Carlos Ponce Campuzano, DC gallery, 2018
- 3Blue1Brown, Winding numbers and domain coloring, 2018
- Ricky Reusser, Domain Coloring with Adaptive Contouring, 2019
- Ricky Reusser, Locally Scaled Domain Coloring, Part 1: Contour Plots, 2020
- David Lowry-Duda, Visualizing modular forms, 2020
License
This software is published under the GPL-3.0 license. In cases where the constraints of the GPL prevent you from using this software, feel free contact the author.
1 maintainer

Release files for cplot 0.9.3
For a detailed explanation of source distributions (sdists) and built distributions (wheels), please see the package formats documentation.
Source distribution (sdist)
| File | Size | Uploaded | |
|---|---|---|---|
| cplot-0.9.3.tar.gz | 52.3 kB | Details |
Built distribution (wheel)
| File | Interpreter | ABI | Platform | Reset |
|---|---|---|---|---|
| cplot-0.9.3-py3-none-any.whl | Python 3 | none | any | Details |
Total release size: 91.5 kB
Release files / cplot-0.9.3.tar.gz
| Download URL | cplot-0.9.3.tar.gz |
|---|---|
| Size | 52.3 kB |
| Tags | Source |
|
SHA-256 checksum How to use checksums |
5534dcb977ac01238be9633d2f3bf0e6079b8c56b3923c643648609421cb10d0
|
|
BLAKE2b-256 checksum How to use checksums |
12da5cf7f1db1fba8e4bbe84ba195005f743dc0262c0f23bf88c4a96dbb9e52a
|
| Upload date | |
|
Uploaded using Trusted Publishing? What is trusted publishing? |
No |
| Uploaded via |
twine/4.0.1 CPython/3.10.6
|
Release files / cplot-0.9.3-py3-none-any.whl
| Download URL | cplot-0.9.3-py3-none-any.whl |
|---|---|
| Size | 39.2 kB |
| Tags | Python 3 |
|
SHA-256 checksum How to use checksums |
f58ae94b9371a40ab4be4584ce7cc2cad9abe2eba6960e5cdd9ba34d4918b74b
|
|
BLAKE2b-256 checksum How to use checksums |
deff41cddc6e3f62e1a0522c2c958f5fc789b48bd6749040c3b8e7743c03e931
|
| Upload date | |
|
Uploaded using Trusted Publishing? What is trusted publishing? |
No |
| Uploaded via |
twine/4.0.1 CPython/3.10.6
|














