CLI Tools for Tabular Data - CSV analysis, validation, and beautiful display

Project description
🛠️ CSVise | CLI Tools for Tabular Data
💻 Setup
PyPI package (pip installation) coming soon.
💡 Features
Display & Validation
csvise display FILENAME [OPTIONS]
--display: Displays a formatted table output of the CSV data.--debug: Enables debug output for troubleshooting purposes, including information on incomplete data and type mismatches.-v: Activates verbose mode, provides detailed logs about script operations.-dl,--delimiter DELIMITER: Sets a custom delimiter for splitting fields in target CSV file.-stf,--save_to_file OUTPUT: Saves script output to a file (changeOUTPUTto desired file to save in).--rich: Use Rich formatting for enhanced CLI output with colors, tables, and panels. [default]--classic: Use classic plain text formatting.
Data Analysis & Statistics
csvise analyze FILENAME [OPTIONS]
--columns,-c: Comma-separated list of columns to analyze. If not specified, analyzes all columns.--correlations: Show correlation matrix for numeric columns.--outliers: Detect outliers in numeric columns.--distribution: Show value distribution for categorical columns.-v: Activates verbose mode.--classic: Use classic plain text formatting.
Data Cleaning Operations
csvise clean FILENAME [OPTIONS]
--remove-duplicates: Remove duplicate rows.--normalize-whitespace: Normalize whitespace in all columns.--standardize-case: Standardize text case (upper, lower, title, sentence).--fill-missing: Fill missing values using specified strategy (empty, mode, mean, median, custom).--fill-value: Custom value to use when filling missing values.--remove-empty-rows: Remove rows with specified fraction of empty cells (0.0 to 1.0).--output,-o: Output file for cleaned data.-v: Activates verbose mode.--classic: Use classic plain text formatting.
--help: Provides support with commands and basic documentation.--version: Displays current program version.
Custom Delimiter Example:
python3 csvtools.py data.csv -display -dl ";"
Displays a formatted table output of data.csv where the fields in raw data are separated by ; (semicolon).
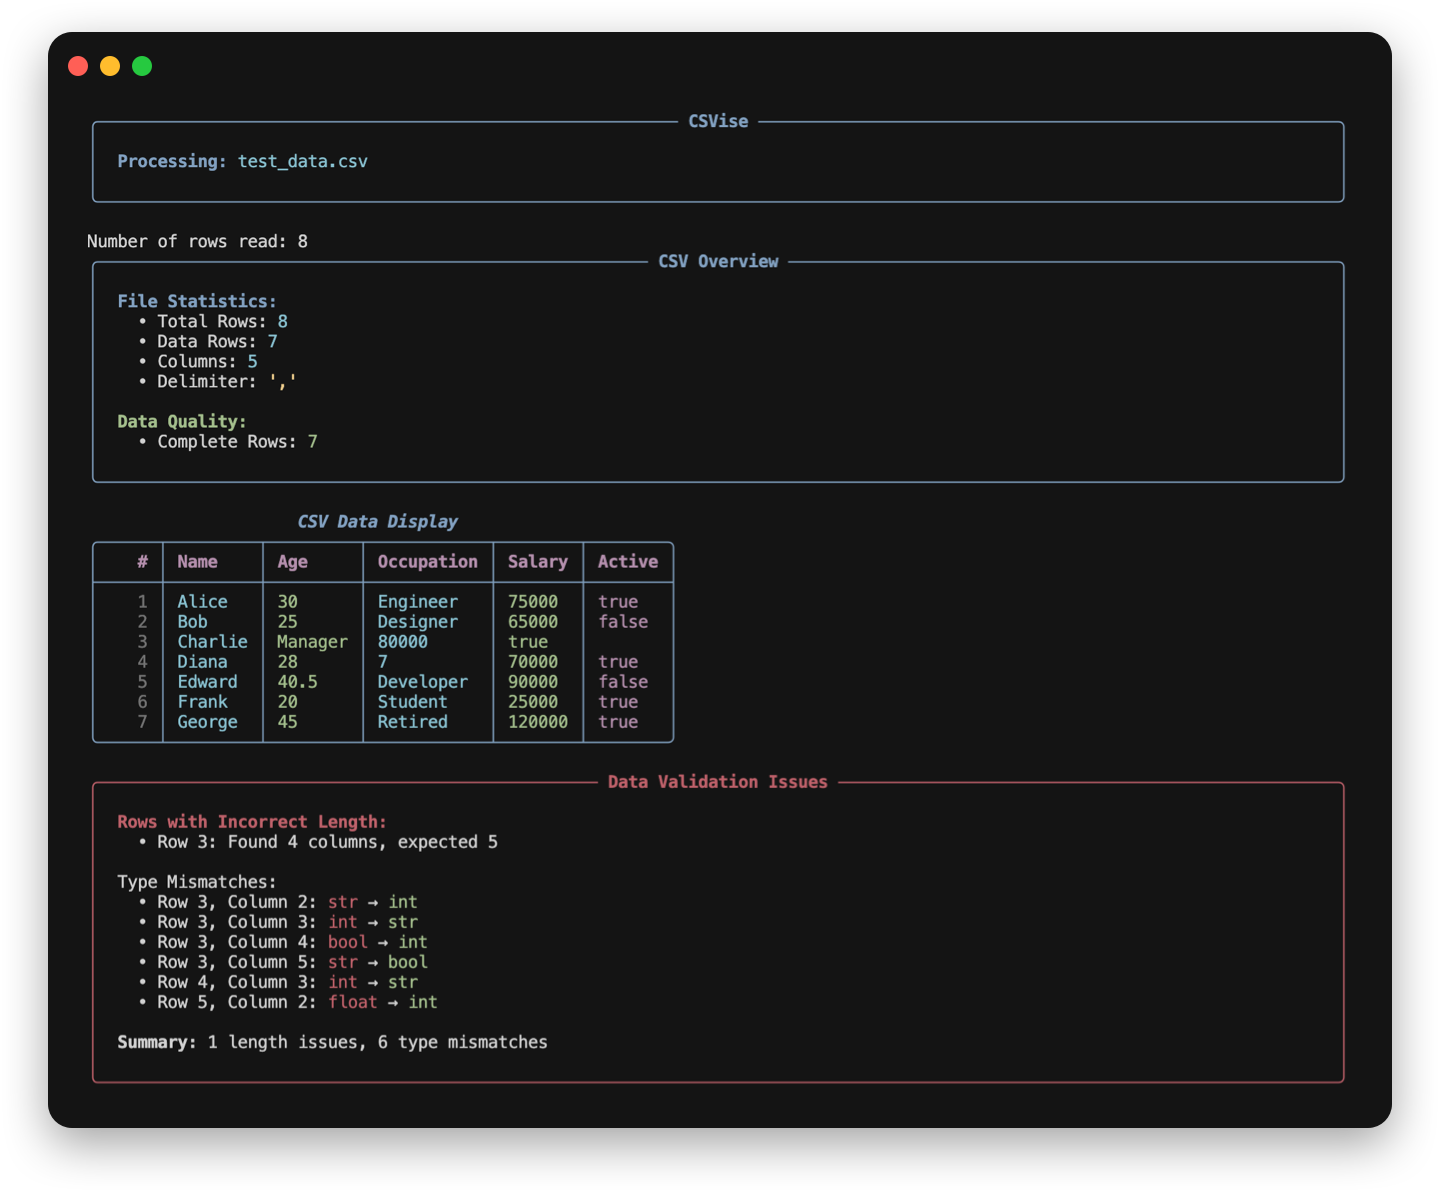
Rich UI Example (Default):
python3 csvtools.py data.csv --display --debug
Displays a beautifully formatted table with colors, panels, and enhanced visual feedback for data validation issues.
Classic Mode Example:
csvise display data.csv --display --classic --debug
Displays traditional plain text output for compatibility with scripts or environments that don't support Rich formatting.
Data Analysis Examples:
# Comprehensive analysis with correlations
csvise analyze data.csv --correlations

# Analyze specific columns only
csvise analyze data.csv --columns "Age,Salary,Department"

# Detect outliers in numeric columns
csvise analyze data.csv --outliers

# Show value distribution
csvise analyze data.csv --distribution
Data Cleaning Examples:
# Remove duplicates and normalize whitespace
csvise clean data.csv --remove-duplicates --normalize-whitespace

# Standardize case and fill missing values
csvise clean data.csv --standardize-case title --fill-missing mode

# Remove empty rows and save cleaned data
csvise clean data.csv --remove-empty-rows 0.5 --output cleaned_data.csv

# Complex cleaning pipeline
csvise clean data.csv --remove-duplicates --normalize-whitespace --standardize-case title --fill-missing mean --output cleaned_data.csv
⚙️ Configuration
Customize default behaviour of the script with csvtoolsConfig.json (ensure it is in the same directory as csvtools.py).
{
    // additional delimiters to automatically detect
    "additional_delimiters": ["|", ";", "###"],

    // -display flag prints table starting at this index
    "start_index": 1,

    // setting to null prints all rows
    "num_rows_to_print": null,

    // table display formatting customization
    "display_column_lines": true,
    "display_row_lines": false,

    "check_type_mismatches": true,

    "string_case": "default"  // options: "default", "upper", "lower"
}
Example Output
[VERBOSE] Detecting delimiter from sample row: Name,Age,Occupation

[VERBOSE] Delimiter detected: ,

[VERBOSE] Detected columns: ['Name', 'Age', 'Occupation']
[VERBOSE] Cleaning field: ' 30' -> '30'
[VERBOSE] Cleaning field: ' Engineer' -> 'Engineer'
[VERBOSE] Cleaning field: ' Designer' -> 'Designer'
[VERBOSE] Cleaning field: ' Manager' -> 'Manager'
[VERBOSE] Cleaning field: ' 28' -> '28'
[VERBOSE] Cleaning field: ' 7' -> '7'
[VERBOSE] Cleaning field: '  40.5 ' -> '40.5'
[VERBOSE] Cleaning field: ' Developer' -> 'Developer'
[VERBOSE] Cleaning field: ' 20  ' -> '20'
[VERBOSE] Cleaning field: ' Student' -> 'Student'
[VERBOSE] Cleaning field: '45 ' -> '45'
[VERBOSE] Cleaning field: '   Retired' -> 'Retired'

[VERBOSE] Cleaned rows: [['Alice', '30', 'Engineer'], ['Bob', '25', 'Designer'], ['Charlie', 'Manager'], ['Diana', '28', '7'], ['Edward', '40.5', 'Developer'], ['Frank', '20', 'Student'], ['George', '45', 'Retired']]
[VERBOSE] Formatted column display widths: [9, 9, 11]
[VERBOSE] Determining majority type from: ['str', 'str', 'str', 'str', 'str', 'str', 'str'] -> str (count: 7)
[VERBOSE] Determining majority type from: ['int', 'int', 'str', 'int', 'float', 'int', 'int'] -> int (count: 5)
[VERBOSE] Determining majority type from: ['str', 'str', 'str', 'int', 'str', 'str', 'str'] -> str (count: 6)

[VERBOSE] Expected types: ['str', 'float', 'str']

  | Name      | Age       | Occupation
--------------+-----------+-------------
1 | Alice     | 30        | Engineer
2 | Bob       | 25        | Designer
3 | Charlie   | Manager   |
4 | Diana     | 28        | 7
5 | Edward    | 40.5      | Developer
6 | Frank     | 20        | Student
7 | George    | 45        | Retired

ROWS WITH INCORRECT LENGTH:
Row 3 is of length 2, expected 3

ROWS WITH POTENTIAL TYPE MISMATCHES:
Row 3, Column 2: Found str, expected int
Row 4, Column 3: Found int, expected str

Total number of rows with incorrect length: 1
Total number of type mismatches: 2
🎨 Rich UI Integration
CSVise now features beautiful Rich-powered CLI output with:
- Color-coded Tables: Data types are color-coded (integers in green, floats in yellow, booleans in magenta)
- Information Panels: File statistics and validation issues displayed in styled panels
- Progress Indicators: Visual feedback during data processing
- Enhanced Error Messages: Beautiful error and success message formatting
- Type-based Highlighting: Automatic highlighting of data type mismatches
Rich vs Classic Mode
- Rich Mode (
--rich): Enhanced visual experience with colors, panels, and modern styling [default] - Classic Mode (
--classic): Traditional plain text output for compatibility
📊 Data Analysis & Statistics
CSVise provides comprehensive data analysis capabilities:
- Column Statistics: Mean, median, mode, min/max, standard deviation for numeric columns
- Data Quality Metrics: Completeness, consistency, and uniqueness scores
- Correlation Analysis: Find relationships between numeric columns
- Outlier Detection: Identify statistical outliers using IQR or z-score methods
- Value Distribution: Frequency analysis for categorical data
- Missing Data Analysis: Count and percentage of null/empty values per column
🧹 Data Cleaning Operations
Powerful data cleaning and transformation features:
- Duplicate Removal: Remove duplicate rows with flexible column selection
- Whitespace Normalization: Clean and standardize whitespace across all columns
- Case Standardization: Convert text to upper, lower, title, or sentence case
- Missing Value Handling: Fill missing values using mode, mean, median, or custom values
- Empty Row Removal: Remove rows with high percentages of empty cells
- Date Normalization: Standardize date formats across columns
- Data Export: Save cleaned data to new CSV files
🗓️ Upcoming Features
- Data normalization
- Duplicate row detection
- Interactive issue handling
- Pandas integration for data analysis
Release history Release notifications | RSS feed


Download files
Download the file for your platform. If you're not sure which to choose, learn more about installing packages.
Source Distribution
Built Distribution
Filter files by name, interpreter, ABI, and platform.
If you're not sure about the file name format, learn more about wheel file names.
Copy a direct link to the current filters
File details
Details for the file csvise-1.2.0.tar.gz.
File metadata
- Download URL: csvise-1.2.0.tar.gz
- Upload date:
- Size: 24.3 kB
- Tags: Source
- Uploaded using Trusted Publishing? No
- Uploaded via: twine/6.1.0 CPython/3.13.5
File hashes
| Algorithm | Hash digest | |
|---|---|---|
| SHA256 |
d30e217c1db0a38bd8336938a75f89ffae4deb67c5eb19367786885fcbcd9ea4
|
|
| MD5 |
876764cd42a4baabda9e39f2d2828f3f
|
|
| BLAKE2b-256 |
42968be37132b24944b9d189bdb6f40b65b8307f9b02b6b646eaf1deebdbd330
|
File details
Details for the file csvise-1.2.0-py3-none-any.whl.
File metadata
- Download URL: csvise-1.2.0-py3-none-any.whl
- Upload date:
- Size: 26.7 kB
- Tags: Python 3
- Uploaded using Trusted Publishing? No
- Uploaded via: twine/6.1.0 CPython/3.13.5
File hashes
| Algorithm | Hash digest | |
|---|---|---|
| SHA256 |
5288ec736f2665562bc6581da4de71a1631c323fe79c0d5806674f63238d24f2
|
|
| MD5 |
864eb5c9dfe6a70792db03d7cad1bcb7
|
|
| BLAKE2b-256 |
3ef32555108d49b34451220cafbf9166d43197053ee4fc8b79c47f25cb4b5bf7
|


