


Data analysis, Statistics and Process improvements (DaSPi)
Visualize and analyze your data with DaSPi. This package is designed for users who want to find relevant influencing factors in processes and validate improvements. This package offers many Six Sigma tools based on the following packages:
The goal of this package is to be easy to use and flexible so that it can be adapted to a wide array of data analysis tasks.
Why DaSPi?
There are great packages for data analysis and visualization in Python, such as Pandas, Seaborn, Altair, Statsmodels, Scipy, Pinguins. But most of the time they work not directly with each other. Wouldn't it be great if you could use all of these packages together in one place? That's where DaSPi comes in. DaSPi is a Python package that provides a unified interface for data analysis, statistics and visualization. It allows you to use all of the great packages mentioned above together in one place, making it easier to explore and understand your data.
Features
- Ease of Use: DaSPi is designed to be easy to use, even for beginners. It provides a simple and intuitive interface that makes it easy to get started with data analysis.
- Visualization: DaSPi provides a wide range of visualization options, including multivariate charts, joint charts, and useful precast charts. This makes it easy to explore and understand your data in a visual way.
- Statistics: DaSPi provides a wide range of statistical functions and tests, including hypothesis testing, confidence intervals, and regression analysis. This makes it easy to explore and understand your data in a statistical way.
- Open Source: DaSPi is open source, which means that it is free to use and modify. This makes it a great option for users who want to customize the package to their specific needs.
This Package contains following submodules:
- plotlib: Visualizations with Matplotlib, where the division by color, marker size or shape as well as rows and columns subplots are automated depending on the given categorical data. Any plots can also be combined, such as scatter with contour plot, violin with error bars or other creative combinations.
- anova: analysis of variance (ANOVA), which is used to compare the variance within and between of two or more groups, or the effects of different treatments on a response variable. It also includes a function for calculating the variance inflation factor (VIF) for linear regression models. The main class is LinearModel, which provides methods for fitting linear regression with interactions and automatically elimiinating insignificant variables.
- statistics: applied statistics, hypothesis test, confidence calculations and monte-carlo simulation. It also includes estimation for process capability and capability index.
- datasets: data for exersices. It includes different datasets that can be used for testing and experimentation.
Usage
Visualization
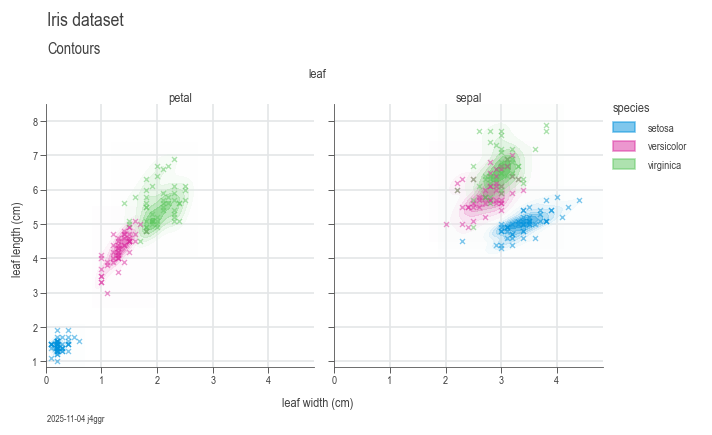
To use DaSPi, you can import the package and start exploring your data. Here is an example of how to use DaSPi to visualize a dataset:
import daspi as dsp
df = dsp.load_dataset('iris')

chart = dsp.MultivariateChart(
        source=df,
        target='length',
        feature='width',
        hue='species',
        col='leaf',
        markers=('x',)
    ).plot(
        dsp.GaussianKDEContour
    ).plot(
        dsp.Scatter
    ).label(
        feature_label='leaf width (cm)',
        target_label='leaf length (cm)',
    )
ANOVA
Do some ANOVA and statistics on a dataset. Run the example below in a Jupyther Notebook to see the results.
df = dsp.load_dataset('painkillers-dissolution')
model = dsp.LinearModel(
    source=df,
    target='dissolution',
    features=['employee', 'stirrer', 'brand', 'catalyst', 'water'],
    disturbances=['temperature', 'preparation'],
    order=2)

df_gof = pd.concat(model.recursive_elimination())

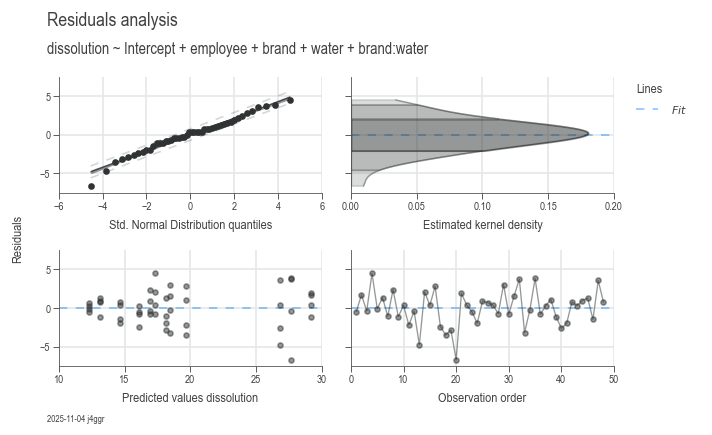
dsp.ResidualsCharts(model).plot().stripes().label(info=True)
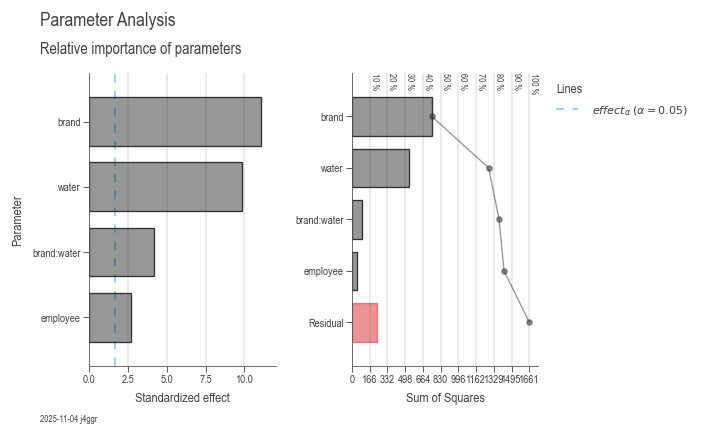
dsp.ParameterRelevanceCharts(model).plot().label(info=True)
model
Formula:
dissolution ~ 16.0792 + 2.3750 employee[T.B] + 0.8375 employee[T.C] + 10.7500 brand[T.OuchAway] - 3.8000 water[T.tap] - 5.7167 brand[T.OuchAway]:water[T.tap]
Model Summary
| Hierarchical | Least Parameter | P Least | S | AIC | R² | R² Adj | R² Pred |
|---|---|---|---|---|---|---|---|
| True | employee | 0.023298 | 2.374693 | 224.835935 | 0.857379 | 0.840400 | 0.813719 |
Parameter Statistics
| Coef | Std Err | T | P | CI Low | CI Upp | |
|---|---|---|---|---|---|---|
| Intercept | 16.079167 | 0.839581 | 19.151424 | 0.000000 | 14.384824 | 17.773509 |
| employee[T.B] | 2.375000 | 0.839581 | 2.828793 | 0.007133 | 0.680657 | 4.069343 |
| employee[T.C] | 0.837500 | 0.839581 | 0.997522 | 0.324224 | -0.856843 | 2.531843 |
| brand[T.OuchAway] | 10.750000 | 0.969464 | 11.088598 | 0.000000 | 8.793542 | 12.706458 |
| water[T.tap] | -3.800000 | 0.969464 | -3.919690 | 0.000321 | -5.756458 | -1.843542 |
| brand[T.OuchAway]:water[T.tap] | -5.716667 | 1.371030 | -4.169616 | 0.000149 | -8.483516 | -2.949817 |
Analysis of Variance
| Source | DF | SS | MS | F | P | n² |
|---|---|---|---|---|---|---|
| employee | 2 | 46.431667 | 23.215833 | 4.116891 | 0.023298 | 0.027960 |
| brand | 1 | 747.340833 | 747.340833 | 132.526821 | 0.000000 | 0.450027 |
| water | 1 | 532.000833 | 532.000833 | 94.340328 | 0.000000 | 0.320355 |
| brand:water | 1 | 98.040833 | 98.040833 | 17.385695 | 0.000149 | 0.059037 |
| Residual | 42 | 236.845000 | 5.639167 | nan | nan | 0.142621 |
Variance Inflation Factor
| DF | VIF | GVIF | Threshold | Collinear | Method | |
|---|---|---|---|---|---|---|
| Intercept | 1 | 5.000000 | 2.236068 | 2.236068 | True | R_squared |
| employee | 2 | 1.000000 | 1.000000 | 1.495349 | False | generalized |
| brand | 1 | 1.000000 | 1.000000 | 2.236068 | False | R_squared |
| water | 1 | 1.000000 | 1.000000 | 2.236068 | False | R_squared |
| brand:water | 1 | 1.000000 | 1.000000 | 2.236068 | False | single_order-2_term |
Process capability
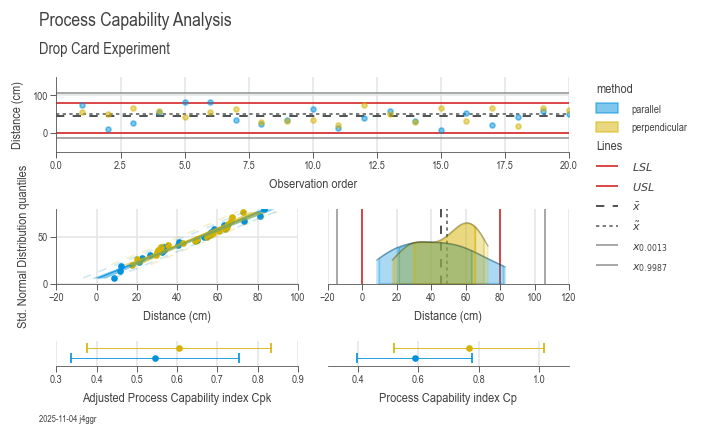
Analyze process variation and other key performance indicators for process capacity.
df = dsp.load_dataset('drop_card')
spec_limits = dsp.SpecLimits(0, float(df.loc[0, 'usl']))
target = 'distance'

chart = dsp.ProcessCapabilityAnalysisCharts(
        source=df,
        target=target,
        spec_limits=spec_limits,
        hue='method'
    ).plot(
    ).stripes(
    ).label(
        fig_title='Process Capability Analysis',
        sub_title='Drop Card Experiment',
        target_label='Distance (cm)',
        info=True
    )

samples_parallel = df[df['method']=='parallel'][target]
samples_series = df[df['method']=='perpendicular'][target]
df_e = pd.concat([
    dsp.ProcessEstimator(samples_parallel, spec_limits).describe(),
    dsp.ProcessEstimator(samples_series, spec_limits).describe()],
    axis=1,
    ignore_index=True,
).rename(
    columns={0: 'parallel', 1: 'perpendicular'}
)
print(df_e)
| parallel | perpendicular | |
|---|---|---|
| n_samples | 20 | 20 |
| n_missing | 0 | 0 |
| n_ok | 18 | 20 |
| n_nok | 2 | 0 |
| n_errors | 0 | 0 |
| ok | 90.00 % | 100.00 % |
| nok | 10.00 % | 0.00 % |
| nok_norm | 8.01 % | 3.73 % |
| nok_fit | 7.24 % | 5.77 % |
| min | 8.5 | 17.5 |
| max | 83.0 | 73.0 |
| R | 74.5 | 55.5 |
| mean | 42.935 | 48.485 |
| median | 40.75 | 52.5 |
| std | 22.666583 | 17.359489 |
| sem | 5.068402 | 3.8817 |
| dist_name | lognorm | logistic |
| p_ks | 0.964797 | 0.744326 |
| p_ad | 0.754044 | 0.098371 |
| excess | -0.900801 | -1.236078 |
| p_excess | 0.288757 | 0.072573 |
| skew | 0.19252 | -0.377538 |
| p_skew | 0.690373 | 0.438723 |
| strategy | norm | norm |
| lcl | -25.064748 | -3.593468 |
| ucl | 110.934748 | 100.563468 |
| lsl | 0 | 0 |
| usl | 80.0 | 80.0 |
| cp | 0.588237 | 0.768072 |
| cpk | 0.545076 | 0.605145 |
| Z | 1.635227 | 1.815434 |
| Z_lt | 0.135227 | 0.315434 |
About DaSPi
DaSPi was created and is actively maintained by Reto Jäggli, a Data Scientist at Festo Microtechnology AG. Much of the development happens during spare time, driven by a passion for making data analysis, statistics, and process improvement more accessible and integrated.
Contributions to DaSPi are very welcome! If you find bugs or have ideas for improvements, please report them or submit pull requests on the GitHub repository, where the full source code is also available for review.
Important Notice:
DaSPi is still under heavy development and may contain hidden bugs.
While every effort is made to ensure reliability, no warranty is provided.
The results obtained using DaSPi should be double-checked with other trusted statistical software whenever possible.
Where applicable, DaSPi acts as a convenient wrapper around well-established packages such as pandas, numpy, matplotlib, scipy, and statsmodels, leveraging their robustness and functionality.
1 maintainer

Metadata
1 maintainer
Release files for DaSPi 1.8.0
For a detailed explanation of source distributions (sdists) and built distributions (wheels), please see the package formats documentation.
Source distribution (sdist)
| File | Size | Uploaded | Provenance | Actions |
|---|---|---|---|---|
| daspi-1.8.0.tar.gz | 15.7 MB | Without provenance | Details for daspi-1.8.0.tar.gz |
Built distribution (wheel)
| File | Interpreter | ABI | Platform | Actions Reset |
|---|---|---|---|---|
| daspi-1.8.0-py3-none-any.whl | Python 3 | none | any | Details for daspi-1.8.0-py3-none-any.whl |
Total release size: 16.1 MB
Release files / daspi-1.8.0.tar.gz
| Download URL | daspi-1.8.0.tar.gz |
|---|---|
| Size | 15.7 MB |
| Tags | Source |
|
SHA-256 checksum How to use checksums |
c1c85afc60171433ebdf523825eeeb18d50c72a85fd3f7d567b23f4655775e8c
|
|
BLAKE2b-256 checksum How to use checksums |
9f582ddb0f909de537b26e6165314ed641f96ce9888db6cc86886189ba66a799
|
| Upload date | |
|
Uploaded using Trusted Publishing? What is trusted publishing? |
No |
| Uploaded via |
pdm/2.26.0 CPython/3.12.3 Windows/11
|
Release files / daspi-1.8.0-py3-none-any.whl
| Download URL | daspi-1.8.0-py3-none-any.whl |
|---|---|
| Size | 335.9 kB |
| Tags | Python 3 |
|
SHA-256 checksum How to use checksums |
0b112915cea1f9372d002ecbcc663a6318ff2bb7e0093389585b8a404256ed2e
|
|
BLAKE2b-256 checksum How to use checksums |
af99dffd3f1e11185a3202dccd0b811d1a07194391ef495ce7ce194c5f592f55
|
| Upload date | |
|
Uploaded using Trusted Publishing? What is trusted publishing? |
No |
| Uploaded via |
pdm/2.26.0 CPython/3.12.3 Windows/11
|
Security for DaSPi 1.8.0
Provenance
Provenance describes where a file came from. On PyPI, provenance is shared via attestations, which provide a verifiable record of the build or publishing details. View details, limitations and caveats.
No provenance found
None of the files in this release were uploaded with provenance metadata.
A note on package security
PyPI is a repository for distributing packages, not a service for auditing them. While third-party security researchers and our staff do their best to detect and remove malicious packages, PyPI cannot guarantee the quality, security or suitability of any given package.
To learn more about protecting yourself from malicious actors, visit our package security documentation.














