


DaSPi — Process Analytics & Six Sigma in Python
DaSPi helps engineers analyze and improve processes using statistical workflows.
🎯 The Problem
Process analysis in practice is fragmented:
- Excel is error-prone and hard to scale
- Minitab / JMP are expensive and closed
- Python tools (pandas, scipy, statsmodels) are powerful but disconnected
👉 Engineers spend more time combining tools than improving processes.
✅ The Solution
DaSPi provides integrated workflows for process analytics:
- Capability analysis (Cp, Cpk)
- Root cause analysis (ANOVA, regression)
- Statistical process control (SPC)
- Professional visualization
All in one consistent and intuitive interface.
🚀 Four Flagship Workflows
DaSPi provides four ready-to-use workflows that cover the complete quality cycle. Each workflow produces visual output + interpretation in under 20 lines of code.
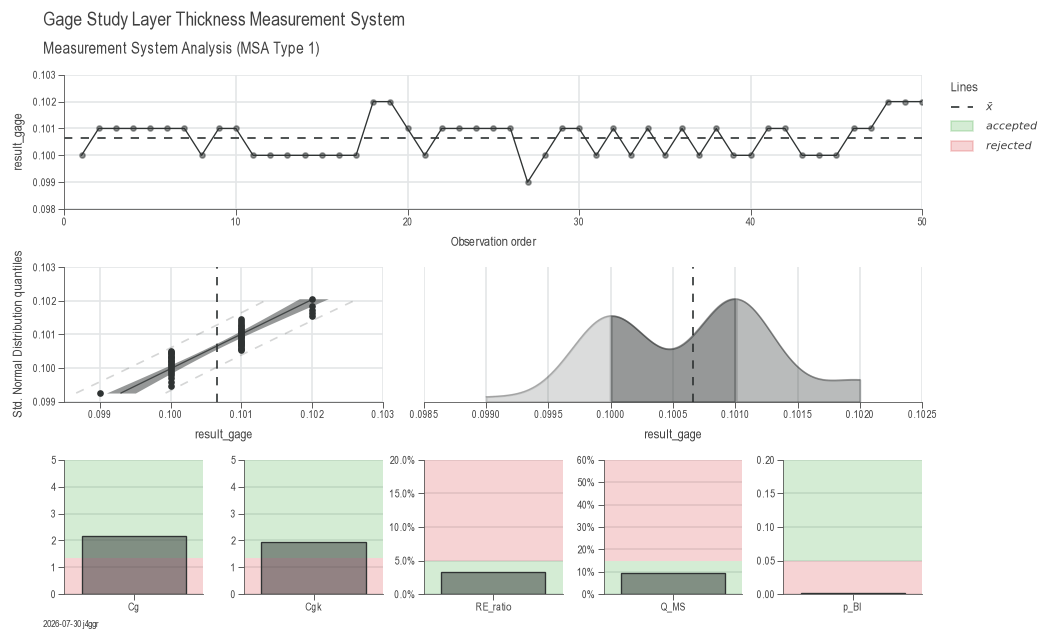
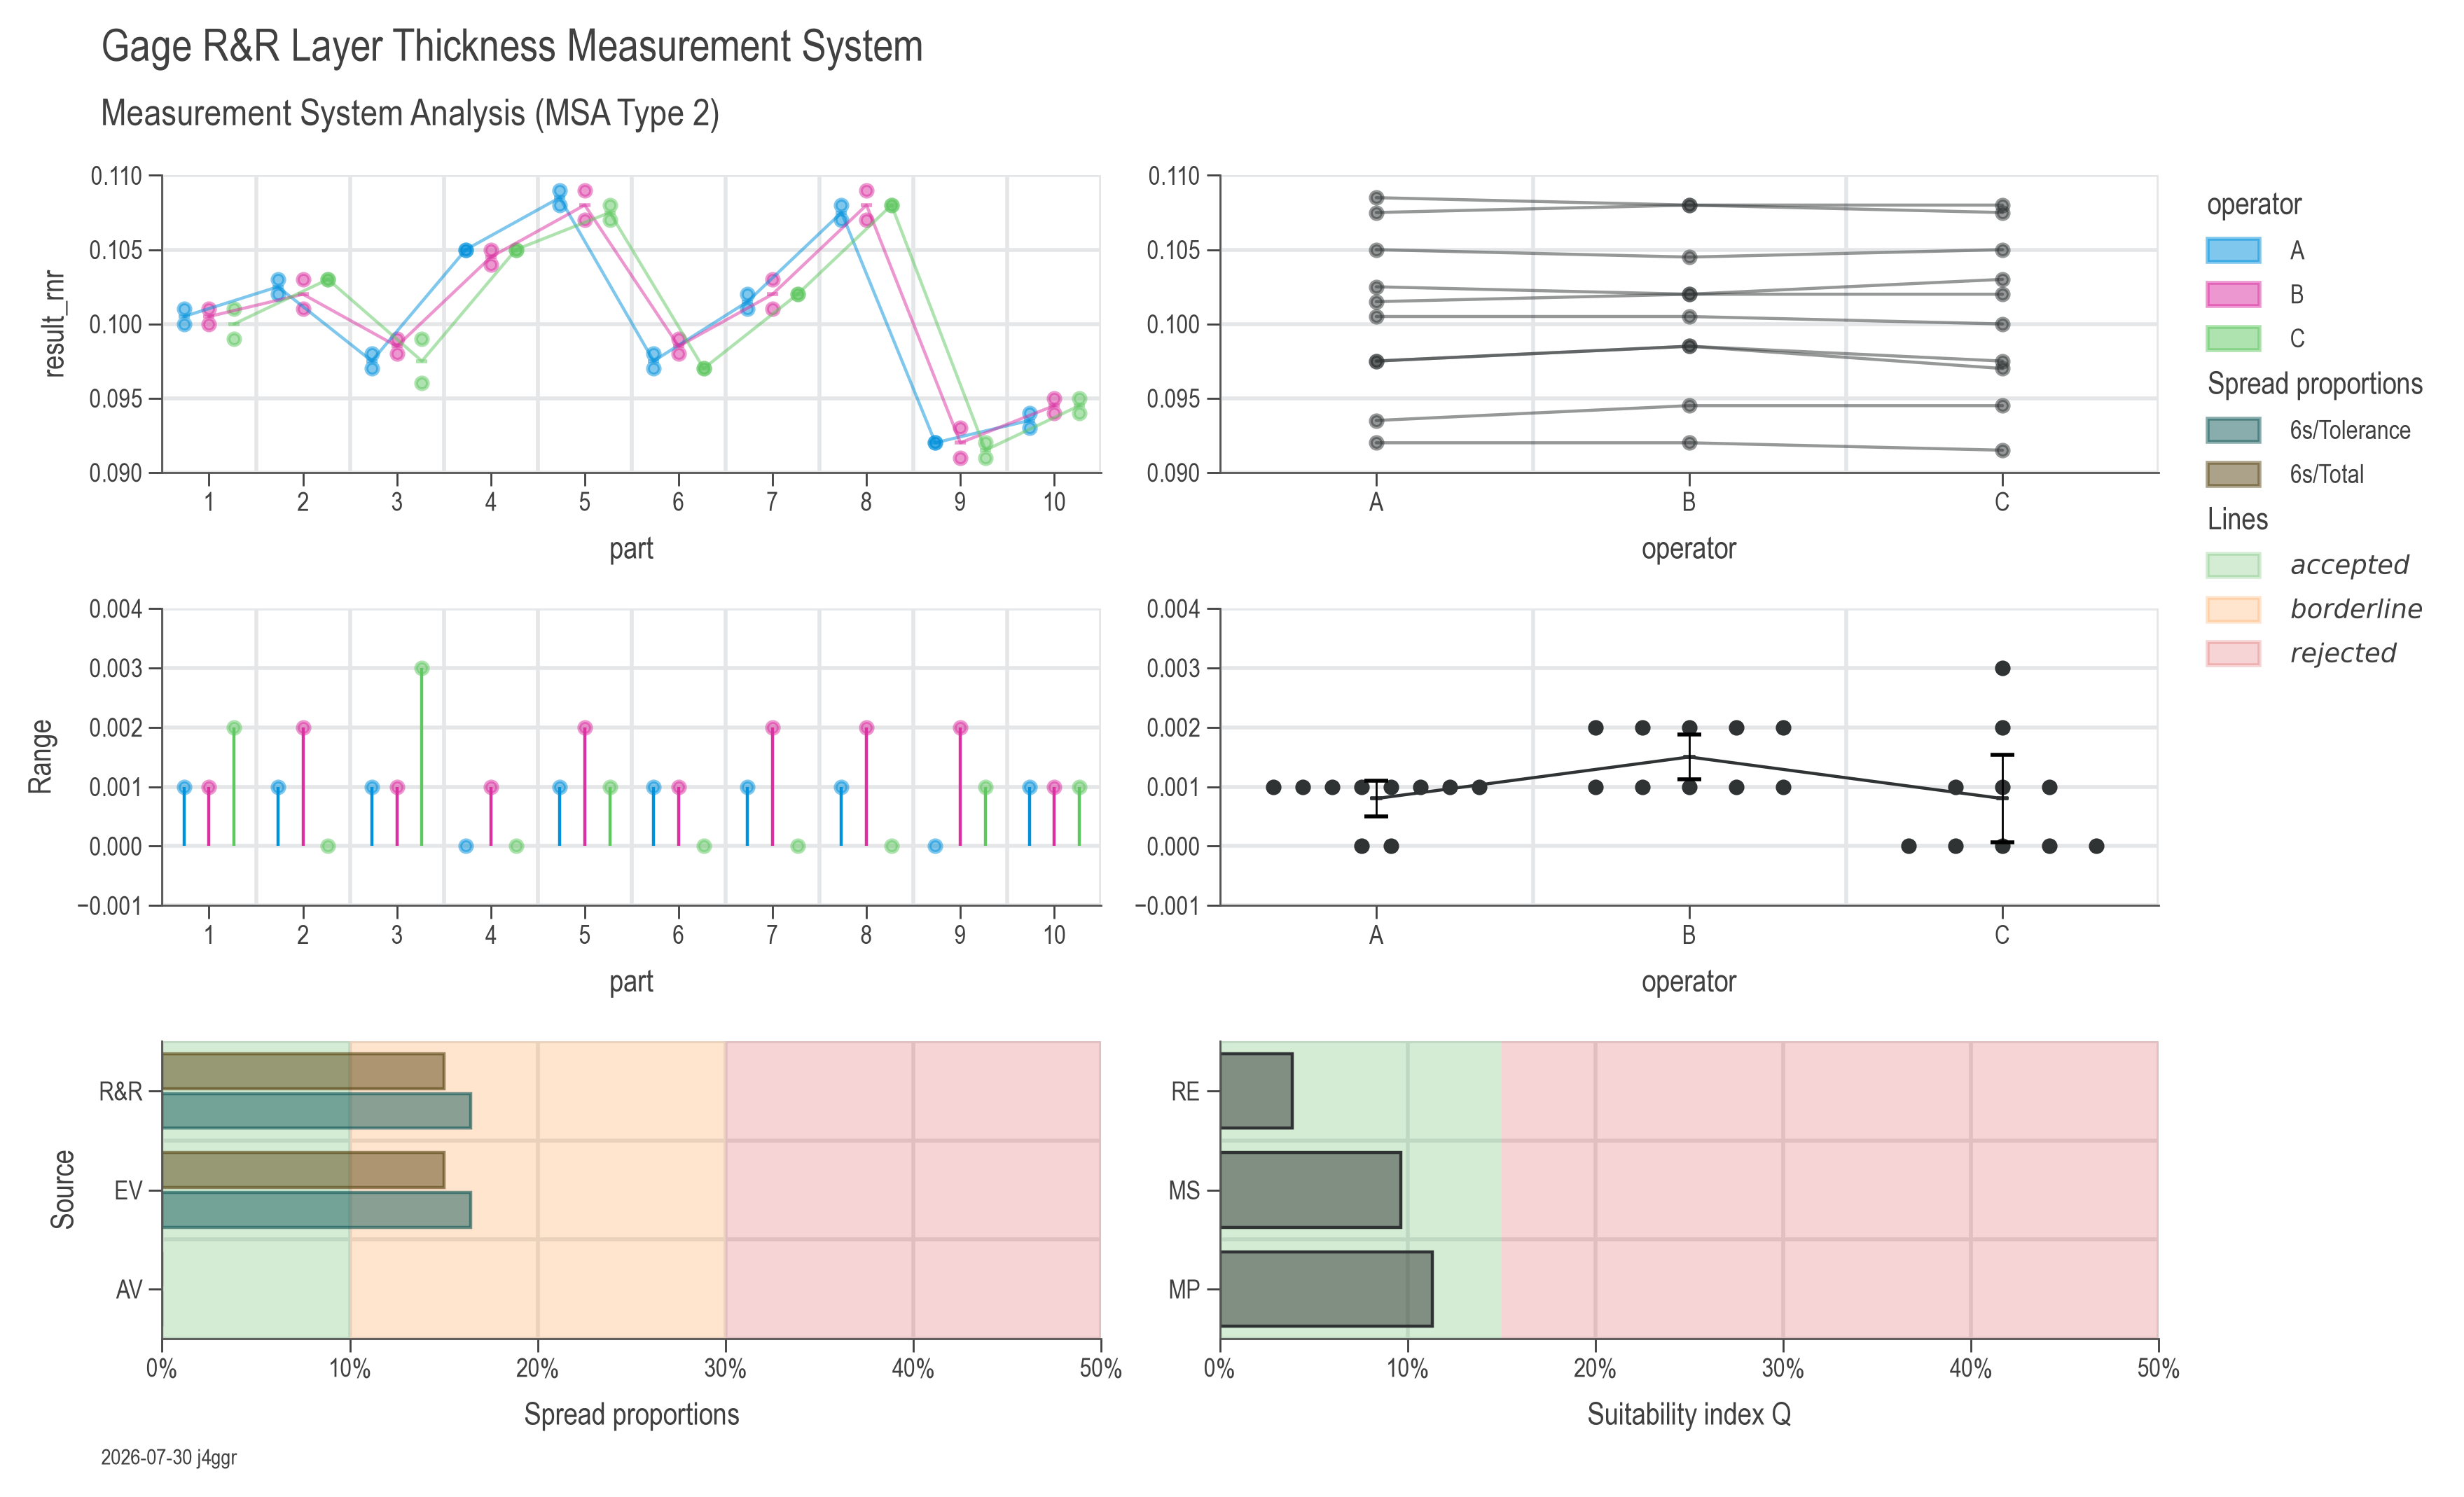
📏 Workflow 1: Gage R&R Analysis
Verify your measurement system is capable before analyzing process data.
import daspi as dsp

# Load data
df = dsp.load_dataset("grnr_layer_thickness")

# Step 1: Evaluate the gage itself (MSA Type 1)
gage = dsp.GageStudyModel(
    source=df,
    target="result_gage",
    reference="reference",
    u_cal=df["U_cal"][0],
    tolerance=df["tolerance"][0],
    resolution=df["resolution"][0]
)

# Step 2: Evaluate repeatability & reproducibility (MSA Type 2)
model = dsp.GageRnRModel(
    source=df,
    target="result_rnr",
    part="part",
    gage=gage,
    u_av="operator"  # Operator variation
)

# Step 3: Visualize complete analysis
chart_gage = dsp.GageStudyCharts(
        gage,
        stretch_figsize=1.5
    ).plot(
    ).stripes(
    ).label(
        fig_title='Gage Study Layer Thickness Measurement System',
        sub_title='Measurement System Analysis (MSA Type 1)',
        info=True)

chart_rnr = dsp.GageRnRCharts(
        model,
        spread_accepted_limit=0.1,   # 10% threshold for acceptance
        spread_rejected_limit=0.3,   # 30% threshold for rejection
        u_accepted_limit=0.15,       # 15% uncertainty threshold
        stretch_figsize=1.5
    ).plot(
    ).stripes(  # Adds acceptance zones
    ).label(
        fig_title='Gage R&R Layer Thickness Measurement System',
        sub_title='Measurement System Analysis (MSA Type 2)',
        info=True)
Output: Comprehensive measurement system evaluation with repeatability (EV), reproducibility (AV), variance components, ANOVA tables, and capability indices (Cg, Cgk).
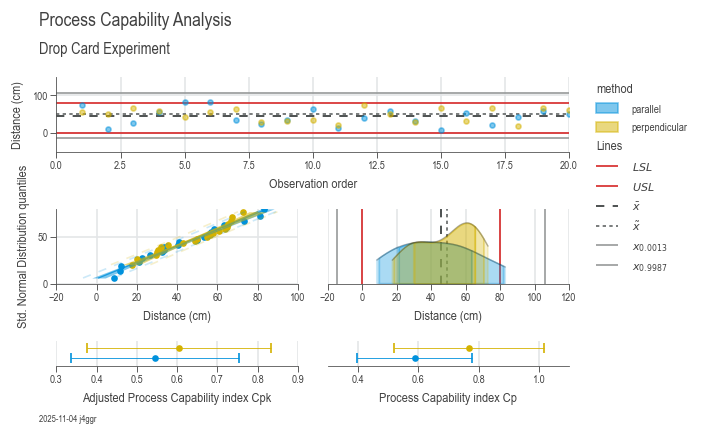
📊 Workflow 2: Process Capability Analysis
Evaluate if your process meets specifications.
import daspi as dsp

# Load data
df = dsp.load_dataset("drop_card")
spec_limits = dsp.SpecLimits(0, float(df.loc[0, "usl"]))

# Analyze capability
chart = dsp.ProcessCapabilityAnalysisCharts(
    source=df,
    target="distance",
    spec_limits=spec_limits,
    hue="method"
).plot().stripes().label(
    fig_title="Process Capability Analysis of Drop Card Data",
    sub_title="Drop Card Distance Comparison between Two Methods",
    target_label="Distance s (cm)",
    info=True)

chart.show()
Output: 5-panel analysis with Cp, Cpk, Pp, Ppk, distribution plots, and statistical interpretation.
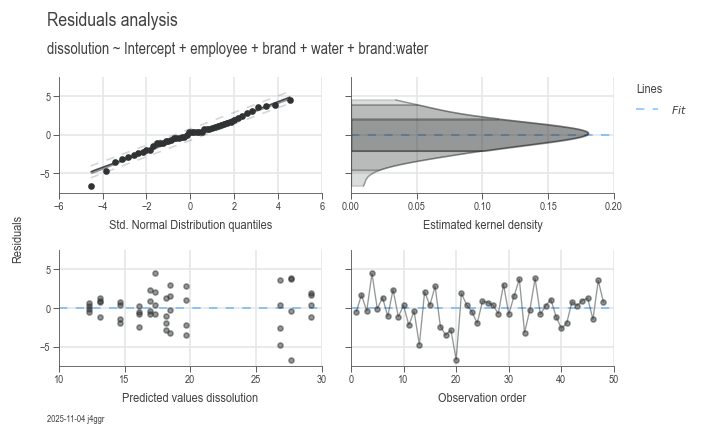
🔍 Workflow 3: Root Cause Analysis
Identify which factors significantly impact your process.
import daspi as dsp

# Load data
df = dsp.load_dataset("painkillers-dissolution")

# Fit model with automatic factor selection
model = dsp.LinearModel(
    source=df,
    target="dissolution",
    factors=["employee", "brand", "water", "catalyst"],
    covariates=["temperature"],
    order=2,
)

# Perform recursive elimination to select significant factors
df_gof = pd.concat(model.recursive_elimination())

# Visualize results
chart_res = dsp.ResidualsCharts(model).plot().stripes().label(info=True)
chart_param = dsp.ParameterRelevanceCharts(model).plot().stripes().label(info=True)
Output: Residual diagnostics + parameter effects with ANOVA tables and significance tests.
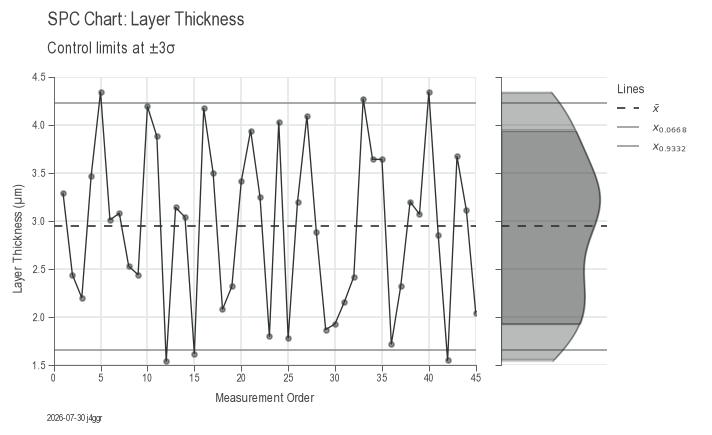
📈 Workflow 4: Statistical Process Control (SPC)
Monitor process stability and detect out-of-control conditions.
import daspi as dsp

# Load process data
df = dsp.load_dataset("grnr_spc")

# Create control chart
chart = dsp.JointChart(
        source=df,
        target='result',
        feature=('measurement_order', ''),
        nrows=1,
        ncols=2,
        width_ratios=[4, 1],
        sharey=True,
    ).plot(
        dsp.Scatter
    ).plot(
        dsp.Line,
        on_last_axes=True,
    ).plot(
        dsp.GaussianKDE,
        hide_axis='feature',
        visible_spines='target',
    ).stripes(
        mean=True,
        control_limits=True,    # UCL/LCL at 3-sigma
        agreement=3,            # 3-sigma agreement lines
        strategy='norm',        # Use normal distribution for control limits
    ).label(
        fig_title='SPC Chart: Layer Thickness',
        sub_title='Control limits at ±3σ',
        target_label='Layer Thickness (µm)',
        feature_label=('Measurement Order', ''),
        info=True
    )

chart.show()
Output: Control chart with mean, control limits (UCL/LCL), specification limits, and trend analysis.
🏭 Use Cases
- Manufacturing: Monitor tolerances and reduce defects
- Quality Engineering: Automate Six Sigma DMAIC workflows
- Process Optimization: Identify key drivers of variation
- Data Analysts: Unify statistics and visualization in one tool
📊 Example Outputs
MSA1: Gage Study (Single Reference)
MSA2: Gage R&R (Repeatability & Reproducibility)
Process Capability Analysis
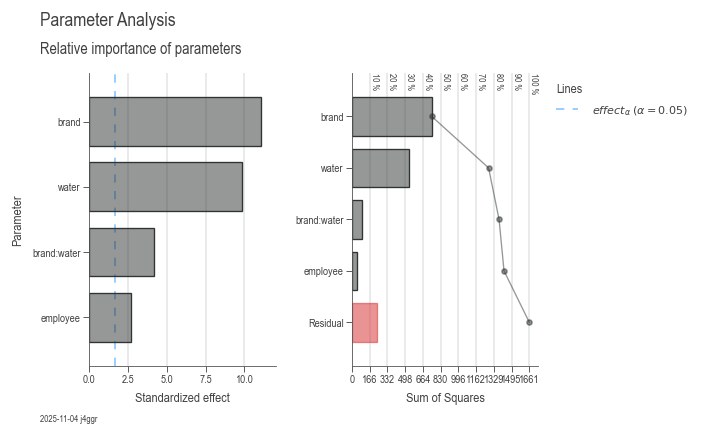
Root Cause Analysis (ANOVA)
formula:
dissolution ~ 26.8292 + 2.3750employee[T.B] + 0.8375employee[T.C] - 10.7500brand[T.ZapPain] - 9.5167water[T.tap] + 5.7167*brand[T.ZapPain]:water[T.tap]
Model Summary:
| hierarchical | least_parameter | p_least | s | aic | r2 | r2_adj | r2_pred | |
|---|---|---|---|---|---|---|---|---|
| 0 | True | employee | 0.023298 | 2.374693 | 224.835935 | 0.857379 | 0.840400 | 0.813719 |
Parameter statistics:
| coef | std err | t | p | ci_low | ci_upp | |
|---|---|---|---|---|---|---|
| Intercept | 26.829167 | 0.839581 | 31.955433 | 0.000000 | 25.134824 | 28.523509 |
| employee[T.B] | 2.375000 | 0.839581 | 2.828793 | 0.007133 | 0.680657 | 4.069343 |
| employee[T.C] | 0.837500 | 0.839581 | 0.997522 | 0.324224 | -0.856843 | 2.531843 |
| brand[T.ZapPain] | -10.750000 | 0.969464 | -11.088598 | 0.000000 | -12.706458 | -8.793542 |
| water[T.tap] | -9.516667 | 0.969464 | -9.816417 | 0.000000 | -11.473125 | -7.560208 |
| brand[T.ZapPain]:water[T.tap] | 5.716667 | 1.371030 | 4.169616 | 0.000149 | 2.949817 | 8.483516 |
Analysis of variance:
| Typ-I | DF | SS | MS | F | p | n2 |
|---|---|---|---|---|---|---|
| employee | 2 | 46.431667 | 23.215833 | 4.116891 | 0.023298 | 0.027960 |
| brand | 1 | 747.340833 | 747.340833 | 132.526821 | 0.000000 | 0.450027 |
| water | 1 | 532.000833 | 532.000833 | 94.340328 | 0.000000 | 0.320355 |
| brand:water | 1 | 98.040833 | 98.040833 | 17.385695 | 0.000149 | 0.059037 |
| Residual | 42 | 236.845000 | 5.639167 | nan | nan | 0.142621 |
Variance inflation factor:
| DF | VIF | GVIF | Threshold | Collinear | Method | |
|---|---|---|---|---|---|---|
| Intercept | 1 | 5.000000 | 2.236068 | 2.236068 | True | R_squared |
| employee | 2 | 1.000000 | 1.000000 | 1.495349 | False | generalized |
| brand | 1 | 1.000000 | 1.000000 | 2.236068 | False | R_squared |
| water | 1 | 1.000000 | 1.000000 | 2.236068 | False | R_squared |
| brand:water | 1 | 1.000000 | 1.000000 | 2.236068 | False | single_order-2_term |
SPC: Control Chart with Mean, UCL/LCL, Specification Limits
🚀 Installation
pip install daspi
📚 Documentation
- User Guide — Complete tutorials for each workflow
- API Reference — Detailed documentation
- 3S Methodology — Structured problem-solving
🔧 Technical Features
- Centralized configuration — Manage language, username, and styles globally
- Multivariate visualization — Explore complex relationships
- Linear models & ANOVA — Statistical inference made simple
- Hypothesis testing — Confidence intervals and p-values
- Monte Carlo simulation — Assess uncertainty
- Process capability — Cp, Cpk, Pp, Ppk calculations
⚙️ Built on Proven Libraries
DaSPi leverages the Python scientific stack:
- pandas — Data manipulation
- numpy — Numerical computing
- matplotlib — Visualization
- scipy — Statistical functions
- statsmodels — Advanced statistics
👤 About
DaSPi is created and maintained by Reto Jäggli, Data Scientist at Festo Microtechnology AG.
The project is driven by a passion to make process analytics and Six Sigma workflows more accessible in Python.
⚠️ Disclaimer
DaSPi is under active development and may contain bugs.
Results should be validated with trusted statistical tools when required.
🤝 Feedback & Contributions
If you use DaSPi in real-world process analysis:
👉 I would love to hear your use case.
Feedback, ideas, and contributions are very welcome.
1 maintainer

Metadata
1 maintainer
Release files for DaSPi 2.4.0
For a detailed explanation of source distributions (sdists) and built distributions (wheels), please see the package formats documentation.
Source distribution (sdist)
| File | Size | Uploaded | Provenance | Actions |
|---|---|---|---|---|
| daspi-2.4.0.tar.gz | 17.4 MB | Without provenance | Details for daspi-2.4.0.tar.gz |
Built distribution (wheel)
| File | Interpreter | ABI | Platform | Actions Reset |
|---|---|---|---|---|
| daspi-2.4.0-py3-none-any.whl | Python 3 | none | any | Details for daspi-2.4.0-py3-none-any.whl |
Total release size: 17.8 MB
Release files / daspi-2.4.0.tar.gz
| Download URL | daspi-2.4.0.tar.gz |
|---|---|
| Size | 17.4 MB |
| Tags | Source |
|
SHA-256 checksum How to use checksums |
03e292d5b96926ac3dc0b8bf3f6fbe4c595da9a30d325965f482c171fcb30d5d
|
|
BLAKE2b-256 checksum How to use checksums |
2eea9b1b9d0a6d8272525a11d6aa6879192d15dbb0cb321527d4fd3c632c9cde
|
| Upload date | |
|
Uploaded using Trusted Publishing? What is trusted publishing? |
No |
| Uploaded via |
pdm/2.29.0 CPython/3.12.3 Windows/11
|
Release files / daspi-2.4.0-py3-none-any.whl
| Download URL | daspi-2.4.0-py3-none-any.whl |
|---|---|
| Size | 384.8 kB |
| Tags | Python 3 |
|
SHA-256 checksum How to use checksums |
82cd727459b87e7a03f6022b2c4f3ef9524474cc2c6d20903379cc618cee8b84
|
|
BLAKE2b-256 checksum How to use checksums |
09504fe6c9690687b1570174f6d5c1a78bf0b4c13de07354eed86b3bf4856c18
|
| Upload date | |
|
Uploaded using Trusted Publishing? What is trusted publishing? |
No |
| Uploaded via |
pdm/2.29.0 CPython/3.12.3 Windows/11
|
Security for DaSPi 2.4.0
Provenance
Provenance describes where a file came from. On PyPI, provenance is shared via attestations, which provide a verifiable record of the build or publishing details. View details, limitations and caveats.
No provenance found
None of the files in this release were uploaded with provenance metadata.
A note on package security
PyPI is a repository for distributing packages, not a service for auditing them. While third-party security researchers and our staff do their best to detect and remove malicious packages, PyPI cannot guarantee the quality, security or suitability of any given package.
To learn more about protecting yourself from malicious actors, visit our package security documentation.














