
A simple and easy-to-use Python benchmarking library
Verified details
These details have been verified by PyPIProject links
GitHub Statistics
Maintainers

Project description
EasyBench







A simple and easy-to-use Python benchmarking library.
Features
- Three flexible benchmarking styles (decorator, class-based, and command-line)
- Measure both execution time and estimated memory usage (see limitations)
- Visualization of benchmark results as boxplots for analyzing distribution and outliers
- Parametrized benchmarks to compare the same function with different input sizes
- A pytest-like fixture system for easy test data setup
- Complete lifecycle hooks (setup/teardown) for fine-grained benchmark control
- Switch between normal function execution and benchmarked execution on demand
- Customizable benchmark configuration with sorting and formatting options
- Command-line tool to run multiple benchmarks at once
- Multiple output formats (text tables, CSV, JSON, pandas.DataFrame)
- Extensible reporting system for custom output destinations
Installation
pip install easybench
Optional Dependencies
EasyBench supports optional dependencies for additional features:
# Install with visualization and analysis support
pip install easybench[all]
The all option includes:
matplotlib: For visualization and plotting benchmark resultsseaborn: For enhanced statistical visualizationspandas: For outputting benchmark results as DataFramestqdm: For progress tracking during benchmark execution
Quick Start
There are 3 ways to benchmark with easybench:
-
@benchdecoratorfrom easybench import bench # Add @bench with function parameters @bench(item=123, big_list=lambda: list(range(1_000_000))) def add_item(item, big_list): big_list.append(item)
- When you need fresh data for each trial, use a function or lambda to generate new data on demand.
(likelambda: list(range(1_000_000))in the above)
- When you need fresh data for each trial, use a function or lambda to generate new data on demand.
-
EasyBenchclassfrom easybench import EasyBench, BenchConfig class BenchListOperation(EasyBench): # Benchmark configuration bench_config = BenchConfig( trials=10, memory=True, sort_by="avg" ) # Setup for each trial def setup_trial(self): self.big_list = list(range(1_000_000)) # Benchmark methods (must start with bench_) def bench_append(self): self.big_list.append(123) # You can define multiple benchmark methods def bench_pop(self): self.big_list.pop() if __name__ == "__main__": # Run benchmark BenchListOperation().bench()
-
easybenchcommand-
Create a
benchmarksdirectory -
Put
bench_*.pyscripts in the directory:from easybench import fixture # Fixture for each trial @fixture(scope="trial") def big_list(): return list(range(1_000_000)) # Benchmark functions (must start with bench_) def bench_append(big_list): big_list.append(123) # You can define multiple benchmark functions def bench_pop(big_list): big_list.pop()
-
Run
easybenchcommandeasybench --trials 10 --memory --sort-by avg
-
Example of benchmark results:
-
Single benchmark
Benchmark Results (5 trials): Function Avg Time (s) Min Time (s) Max Time (s) ---------------------------------------------- add_item 0.002393 0.000939 0.007362 -
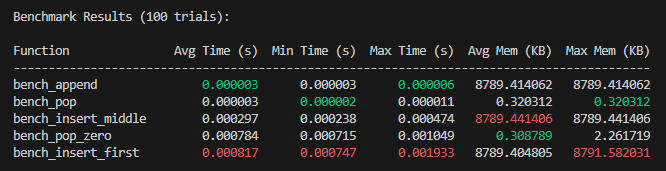
Multiple benchmarks
-
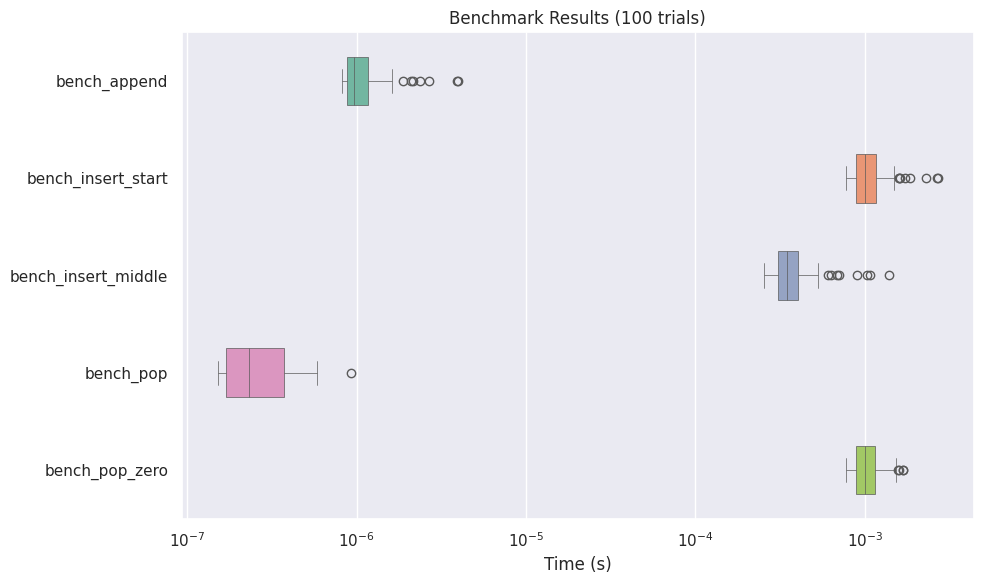
Boxplot Visualization
-
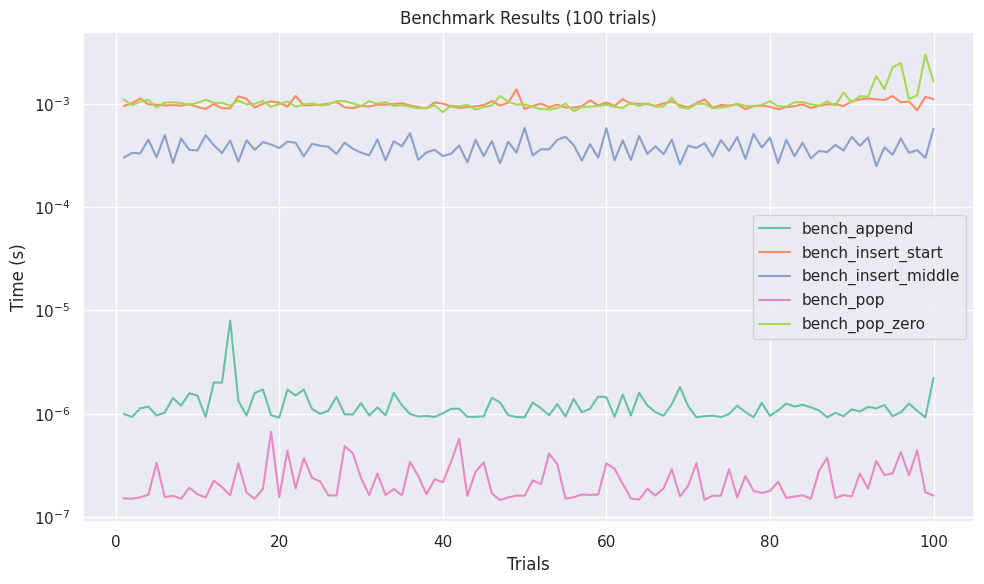
Lineplot Visualization
Usage
Decorator-based Benchmarks (@bench decorator)
Basic usage
The @bench decorator provides the simplest way to benchmark a function:
from easybench import bench

# Add @bench with function parameters
@bench(item=123, big_list=list(range(1_000_000)))
def add_item(item, big_list):
    big_list.append(item)
Fresh data
In the example above, big_list is created once and the same list is used for all trials.
When you need fresh data for each trial, use a function or lambda to generate new data on demand:
from easybench import bench

# Create a new list for each trial
@bench(item=-1, big_list=lambda: list(range(1_000_000)))
def append(item, big_list):
    big_list.append(item)
Function parameters (@bench.fn_params)
Sometimes you may want to use functions as parameters.
In such cases, use the @bench.fn_params decorator:
def pop_first(some_list):
    """Remove the first element from the list"""
    some_list.pop(0)

@bench(big_list=list(range(1_000_000)))
@bench.fn_params(func=pop_first)
def apply_function(big_list, func):
    func(big_list)
Configuration (@bench.config)
To customize benchmark settings, use the @bench.config decorator:
@bench(big_list=list(range(10_000_000)))
@bench.config(trials=10, memory=True)
def pop_last(big_list):
    big_list.pop()
- Place the
@bench.configdecorator before (below) other bench decorators.
Main configuration options:
trials: Number of trials (default:5)memory: Also measure memory usageFalse: Disable memory measurement (default)True: Show memory in kilobytes"B","KB","MB","GB": Show memory in bytes, kilobytes, megabytes, or gigabytes
time: Specify time measurement unit"s": Display time in seconds (default)"ms": Display time in milliseconds"μs"or"us": Display time in microseconds"ns": Display time in nanoseconds"m": Display time in minutes
- For other options, see "Configuration Options" below
Multiple parameter sets (BenchParams)
When you want to benchmark a function with multiple parameter sets,
you can pass a list of parameter sets created with BenchParams to the @bench decorator:
from easybench import bench, BenchParams

# Define parameter sets
small = BenchParams(
    name="Small",                                 # Parameter set name
    params={"lst": lambda: list(range(10_000))},  # Parameters for @bench
)
large = BenchParams(
    name="Large",
    params={"lst": lambda: list(range(1_000_000))}
)

# Benchmark with multiple parameter sets
@bench([small, large])
def pop_first(lst):
    return lst.pop(0)
On-demand benchmarking
If you want to run the benchmark only when needed, use the .bench() method:
@bench
def append_item(item, big_list):
    big_list.append(item)
    return len(big_list)

# Run as a normal function (without benchmarking)
result = append_item(3, list(range(1_000_000)))

# Run with benchmarking
result = append_item.bench(3, list(range(1_000_000)))
print(result)  # 10000001
- By default, the benchmark runs for
1trial. - To run multiple trials, specify the
bench_trialsparameter:result = append_item.bench(3, list(range(1_000_000)), bench_trials=10)
- When running multiple trials, the
.bench()method returns the value from the first trial.result = append_item.bench(3, [1,2,3], bench_trials=10) print(result) # 4
Class-based Benchmarks (EasyBench class)
For comparing multiple benchmarks or more complex setups, the class-based approach is useful:
from easybench import EasyBench, BenchConfig

class BenchListOperation(EasyBench):

    # Benchmark configuration
    bench_config = BenchConfig(
        trials=10,     # Number of trials
        memory=True,   # Measure memory usage
        sort_by="avg"  # Sort by average time
    )

    # Runs before each trial
    def setup_trial(self):
        self.big_list = list(range(10_000_000))

    # Benchmark methods (must start with bench_)
    def bench_append(self):
        self.big_list.append(-1)

    def bench_insert_start(self):
        self.big_list.insert(0, -1)

if __name__ == "__main__":
    BenchListOperation().bench()
How to use the class-based approach:
- Create a class that inherits from
EasyBench - Configure benchmark settings with the
bench_configclass variable - Prepare for each trial in the
setup_trialmethod - Methods starting with
bench_will be benchmarked - Call the
bench()method to execute the benchmarksbench()displays the results on screen and returns a dictionary of measured value
Lifecycle Methods
In class-based benchmarks, you can use the following lifecycle methods:
class BenchExample(EasyBench):
    def setup_class(self):
        # Run once before all benchmarks in the class
        pass

    def teardown_class(self):
        # Run once after all benchmarks in the class
        pass

    def setup_function(self):
        # Run before each benchmark function
        pass

    def teardown_function(self):
        # Run after each benchmark function
        pass

    def setup_trial(self):
        # Run before each trial
        pass

    def teardown_trial(self):
        # Run after each trial
        pass
Parametrized Benchmarks (parametrize decorator)
You can run the same benchmark method with different parameter sets using the parametrize decorator:
from easybench import BenchParams, EasyBench, parametrize

class BenchListOperations(EasyBench):
    # Define parameter sets with BenchParams
    small_params = BenchParams(
        name="Small List",
        params={"size": 10_000}
    )

    large_params = BenchParams(
        name="Large List",
        params={"size": 1_000_000}
    )

    # Apply parametrize decorator with a list of parameter sets
    @parametrize([small_params, large_params])
    def bench_create_list(self, size):
        return list(range(size))

if __name__ == "__main__":
    BenchListOperations().bench()
This will run the benchmark with each parameter set and include the parameter set name in the results:
Benchmark Results (5 trials):

Function                         Avg Time (s) Min Time (s) Max Time (s)
--------------------------------------------------------------------
bench_create_list (Small List)   0.000442     0.000309     0.000855
bench_create_list (Large List)   0.092680     0.062617     0.129535
Fixtures (fixture decorator)
To provide common test data, you can use pytest-style fixtures:
from easybench import EasyBench, fixture

# Define a fixture
@fixture(scope="trial")
def big_list():
    return list(range(10_000_000))

class BenchListOperation(EasyBench):
    # Receive the fixture as an argument
    def bench_append(self, big_list):
        big_list.append(-1)

    def bench_insert_start(self, big_list):
        big_list.insert(0, -1)

if __name__ == "__main__":
    BenchListOperation().bench()
The scope parameter of the fixture decorator specifies the lifetime of the fixture:
"trial": Created for each trial (default)"function": Created once per benchmark function"class": Created once per benchmark class
Configuration Options
The following settings are available in the BenchConfig class:
from easybench import BenchConfig, EasyBench, customize

class MyBenchmark(EasyBench):
    bench_config = BenchConfig(
        trials=5,            # Number of trials
        warmups=2,           # Number of warmup trials before actual measurement
        sort_by="avg",       # Sort criterion
        reverse=False,       # Sort order (False=ascending, True=descending)
        memory="MB",         # Enable memory measurement and show in megabytes
        color=True,          # Use color output in results
        show_output=False,   # Display function return values
        loops_per_trial=1,   # Number of function executions per trial (see explanation below)
        reporters=[],        # Custom reporters (see explanation below)
        progress=True,       # Enable progress tracking with tqdm
    )

    # You can also customize settings for individual methods
    @customize(loops_per_trial=1000)
    def bench_fast_operation(self):
        # This method uses 1000 loops per trial
        pass
Sorting options (sort_by):
"def": Definition order (default)"avg": Average execution time"min": Minimum execution time"max": Maximum execution time"avg_memory": Average memory usage (whenmemory=True)"max_memory": Maximum memory usage (whenmemory=True)
Memory measurement options (memory):
False: Disable memory measurement (default)True: Enable memory measurement and display in kilobytes"B": Display memory usage in bytes"KB": Display memory usage in kilobytes"MB": Display memory usage in megabytes"GB": Display memory usage in gigabytes
Time measurement options (time):
"s": Display time in seconds (default)"ms": Display time in milliseconds"μs"or"us": Display time in microseconds"ns": Display time in nanoseconds"m": Display time in minutes
Progress tracking options (progress):
False: Disable progress tracking (default)True: Enable progress tracking using tqdm- Custom function: Use a custom progress tracking function that follows the tqdm interface
Improving Measurement Accuracy with warmups
When benchmarking, the initial runs might be affected by various factors like code compilation,
cache warmup, or other system effects. To get more stable and accurate measurements, you can
use the warmups parameter to specify how many trial runs should be performed before the actual
measurement begins:
@bench
@bench.config(trials=5, warmups=3, time="ms")
def my_function():
    # This function will be run 3 times as warmup (results discarded)
    # before the 5 actual trials that are measured
    # ...
How warmups works:
- Before actual measurements begin, the function is executed
warmupstimes - Each warmup is a complete trial execution including setup_trial/teardown_trial
- Results from warmup trials are discarded and not included in measurements
- After warmups are complete, regular trials begin with results being recorded
When to use:
- For functions that need JIT compilation to reach optimal performance
- When the system needs time to "warm up" caches or reach steady state
- When you notice that the first few runs consistently show different performance characteristics
Improving Timer Precision with loops_per_trial
In environments with poor timer resolution (e.g., certain virtual machines or systems where time.perf_counter() has limited precision), you may need to run a function multiple times to get meaningful timing results.
The loops_per_trial parameter allows you to specify how many times a function should be executed in a single timing measurement (trial):
# Measure the average time it takes to append the number 1 to a list
# that initially contains 100 elements, repeated 1000 times
# (Note: the same list instance is used throughout the 1000 append operations)
# Repeat this process 500 times to perform the benchmark
@bench(small_list=lambda: list(range(100)))
@bench.config(trials=500, loops_per_trial=1000, time="us")
def append_item(small_list):
    small_list.append(1)
How loops_per_trial works:
- The function is executed
loops_per_trialtimes in a loop within a single timing measurement (trial) - The total execution time is divided by
loops_per_trialto get the average time per execution - This provides more accurate measurements for very fast operations where individual timing would be affected by timer resolution limits
When to use:
- For very fast operations (microsecond or nanoseconds)
- In environments with poor timer precision
- When you notice high variability in timing results for simple operations
Memory Measurement Limitations
EasyBench uses Python's built-in tracemalloc module to measure memory usage.
This has some important limitations:
tracemalloconly tracks memory allocations made through Python's memory manager- Memory allocated by C extensions (like NumPy, Pandas, or other native libraries) often bypasses Python's memory manager and won't be accurately measured
- The reported memory usage reflects Python objects only, not the total process memory consumption
For applications heavily using C extensions, consider using external profilers like
memory_profileror system monitoring tools for more accurate measurements.
Command Line Interface (easybench command)
To run multiple benchmarks at once, use the easybench command:
easybench [options] [path]
- By default, it runs files named
bench_*.pyin thebenchmarksdirectory - You can specify either a directory containing benchmark files or a specific benchmark file
- Benchmark scripts must follow these rules:
- For class-based benchmarks, class names should start with
Bench - For function-based benchmarks, function names should start with
bench_
- For class-based benchmarks, class names should start with
Command Options
easybench [--trials N] [--memory] [--sort-by METRIC] [--reverse] [--no-color] [--show-output] [path]
--trials N: Number of trials (default: 5)--memory: Enable memory measurement--sort-by METRIC: Sort criterion (def/avg/min/max/avg_memory/max_memory)--reverse: Sort results in descending order--no-color: Disable colored output--show-output: Display function return valuespath: Directory containing benchmark files or a specific benchmark file (default: "benchmarks")
Function-based Benchmark Example
Example of a function-based benchmark to be run from the command line:
# Filename: benchmarks/bench_list_operations.py
from easybench import fixture

@fixture(scope="trial")
def big_list():
    return list(range(10_000_000))

def bench_append(big_list):
    """Append an element to the end of the list"""
    big_list.append(-1)

def bench_insert_start(big_list):
    """Insert an element at the beginning of the list"""
    big_list.insert(0, -1)
Save this file in the benchmarks folder and run the easybench command to benchmark both functions and compare the results:
easybench --trials 10 --memory
Advanced Usage
Custom Output (Formatter and Reporter)
EasyBench uses a mechanism called Reporter to output benchmark results. By default, ConsoleReporter is used.
ConsoleReporter is a reporter that outputs data to the console screen, and by default formats the data in tabular form (TableFormatter). In EasyBench, you can change both the Formatter (output format) and the Reporter (output method) to enable various forms of output.
Using Reporters
To use reporters, set them as a list in the reporters parameter of your benchmark configuration (BenchConfig or @bench.config). Since reporters is a list, you can specify multiple output methods simultaneously.
There are three ways to specify reporters:
-
As a string: Specify the reporter name as a string
"console": Standard tabular console output"simple": Simple console output"plot"or"boxplot": Visualization with boxplot"lineplot": Visualization with lineplot"*.csv"or"*.json": File output
-
With arguments: Specify in the format
(reporter_name, parameter_dict) -
As Reporter objects: Directly specify an instance of a Reporter class
-
Usage example
from easybench import BenchConfig
from easybench.reporters import FileReporter

# Multiple output formats with different specification methods
config = BenchConfig(
    reporters=[
        "console",                                  # Specified as string
        ("simple", {"metric": "min"}),              # Specified with arguments
        ("plot", {"log_scale": False}),             # Plot with arguments
        "results.csv",                              # Specified as file path
        FileReporter("results.json"),               # Specified as object
    ]
)

# Simpler configurations
bench_config = BenchConfig(reporters=["console"])       # Console output only
bench_config = BenchConfig(reporters=["plot"])          # Boxplot only

bench_config = BenchConfig(reporters=["output.csv"])    # CSV file output only
Creating Custom Reporters
For advanced use cases, you can create custom reporters:
from easybench.reporters import (
    Reporter, TableFormatter, JSONFormatter, CSVFormatter
)

# Custom reporter example - sends results to a web API
class WebAPIReporter(Reporter):
    def __init__(self, api_url, auth_token):
        super().__init__(JSONFormatter())  # Use JSON format
        self.api_url = api_url
        self.auth_token = auth_token

    def _send(self, formatted_output):
        # Send formatted results to an API endpoint
        import requests
        headers = {"Authorization": f"Bearer {self.auth_token}"}
        requests.post(self.api_url, headers=headers, json=formatted_output)

# Use with BenchConfig
bench_config = BenchConfig(
    reporters=[
        ConsoleReporter(),  # Still show in console
        WebAPIReporter("https://api.example.com/benchmarks", "my_token")
    ]
)
Boxplot Visualization (BoxPlotFormatter)
You can visualize benchmark results as boxplots, which is useful for analyzing distribution and outliers across multiple trials:
from easybench import BenchConfig, EasyBench
from easybench.visualization import BoxPlotFormatter, PlotReporter


class BenchList(EasyBench):
    bench_config = BenchConfig(
        trials=100,
        reporters=[
            PlotReporter(
                BoxPlotFormatter(
                    showfliers=True,           # Show outliers
                    log_scale=True,            # Use logarithmic scale
                    engine="seaborn",          # Use seaborn as plotting engine
                    orientation="horizontal",  # Horizontal or vertical orientation
                    width=0.5,                 # Box width (passed directly to seaborn's boxplot)
                    linewidth=0.5,             # Line width (passed directly to seaborn's boxplot)
                )
            )
        ],
    )

    def setup_trial(self):
        self.big_list = list(range(1_000_000))

    def bench_append(self):
        self.big_list.append(-1)

    def bench_insert_start(self):
        self.big_list.insert(0, -1)

    def bench_insert_middle(self):
        self.big_list.insert(len(self.big_list) // 2, -1)

    def bench_pop(self):
        self.big_list.pop()

    def bench_pop_zero(self):
        self.big_list.pop(0)


if __name__ == "__main__":
    import seaborn as sns

    # Optional seaborn style settings
    sns.set_theme(style="darkgrid", palette="Set2")
    BenchList().bench()
Main BoxPlotFormatter options
showfliers: Whether to show outliers (default:True)log_scale: Whether to use logarithmic scale (default:False)data_limit: Specify axis data range (e.g.,(0, 0.01))trim_outliers: Percentile for trimming outliers (0.0 to 0.5)winsorize_outliers: Percentile for winsorizing outliers (0.0 to 0.5)figsize: Figure size (default:(10, 6))engine: Plotting engine ("matplotlib"or"seaborn")orientation: Boxplot orientation ("vertical"or"horizontal")
PlotReporter options
formatter: Plot formatter to use (e.g.,BoxPlotFormatter)show: Whether to display the plot on screen (default:True)save_path: File path to save the plotdpi: Image resolution (default:100)
To use boxplots, you need to install matplotlib:
pip install matplotlib
If you want to use the seaborn engine, also install seaborn:
pip install seaborn
License
Project details
Verified details
These details have been verified by PyPIProject links
GitHub Statistics
Maintainers
Release history Release notifications | RSS feed


Download files
Download the file for your platform. If you're not sure which to choose, learn more about installing packages.
Source Distribution
Built Distribution
Filter files by name, interpreter, ABI, and platform.
If you're not sure about the file name format, learn more about wheel file names.
Copy a direct link to the current filters
File details
Details for the file easybench-0.1.22.tar.gz.
File metadata
- Download URL: easybench-0.1.22.tar.gz
- Upload date:
- Size: 336.8 kB
- Tags: Source
- Uploaded using Trusted Publishing? Yes
- Uploaded via: twine/6.1.0 CPython/3.10.18
File hashes
| Algorithm | Hash digest | |
|---|---|---|
| SHA256 |
ebedb18eedf8c46cfa88716be999ae7ea6c21a5adaa92569fed057f2d78ea629
|
|
| MD5 |
b394589f3ba6109bafe06c387a1b7648
|
|
| BLAKE2b-256 |
5fd55ce07cccdb525b6aa39091d1a7107ece4d3d1af7833da1ac397fd71c67f2
|
File details
Details for the file easybench-0.1.22-py3-none-any.whl.
File metadata
- Download URL: easybench-0.1.22-py3-none-any.whl
- Upload date:
- Size: 37.6 kB
- Tags: Python 3
- Uploaded using Trusted Publishing? Yes
- Uploaded via: twine/6.1.0 CPython/3.10.18
File hashes
| Algorithm | Hash digest | |
|---|---|---|
| SHA256 |
30c5b6371dd3b07ff8592fabddfa657422c24a255d6394f431d719ed7d2db2ac
|
|
| MD5 |
8b07c952fe7c16bf96e1a8fb841e74c4
|
|
| BLAKE2b-256 |
5d3d411664f2a8d3fa6e54e1e86eff94a730f6da514b97cb611ad83c17dd21e7
|






