Finance plotting

Project description
Finance Plot
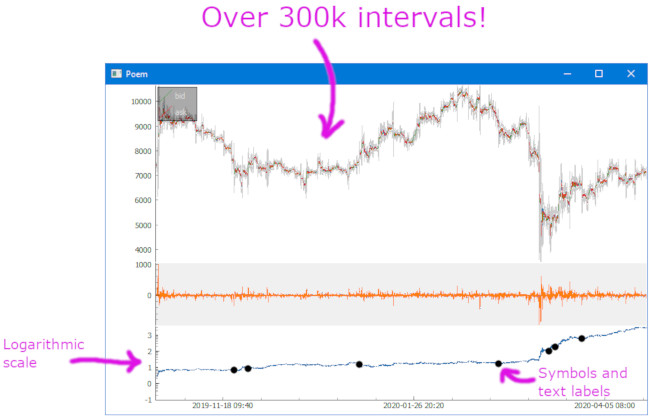
Finance Plotter, or finplot, is a performant library with a clean api to help you with your backtesting. It's optionated with good defaults, so you can start doing your work without having to setup plots, colors, scales, autoscaling, keybindings, handle panning+vertical zooming (which all non-finance libraries have problems with). And best of all: it can show hundreds of thousands of datapoints without batting an eye.


Features
- Great performance compared to mpl_finance, plotly and Bokeh
- Clean api
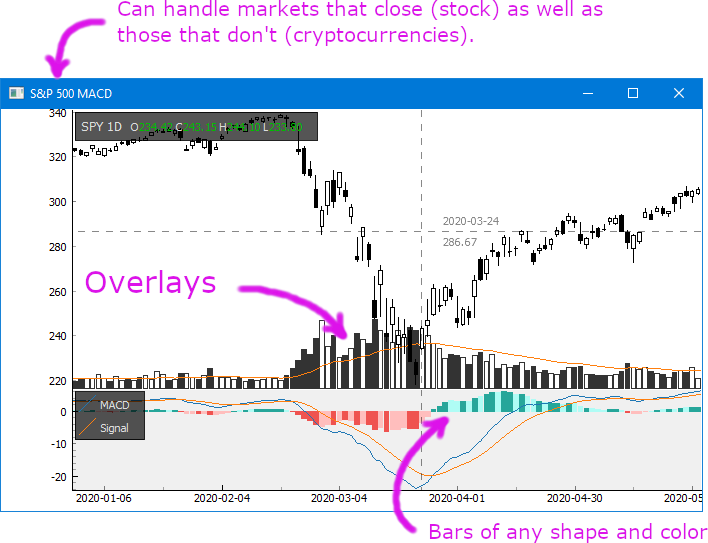
- Works with both stocks as well as cryptocurrencies on any time resolution
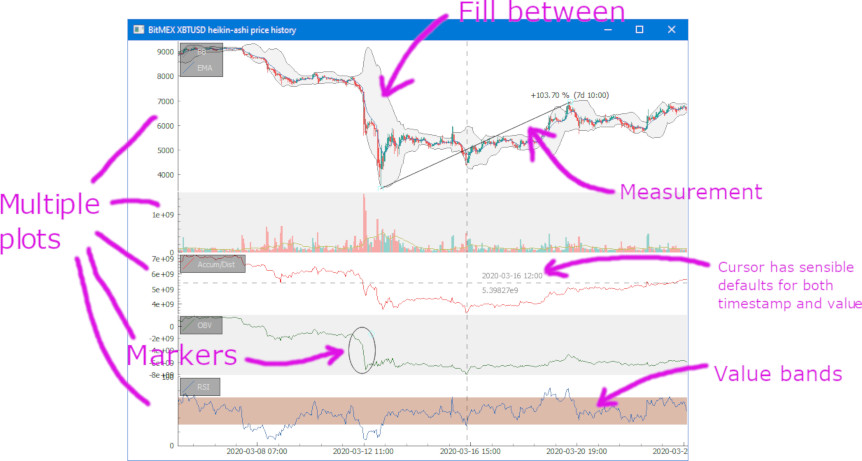
- Show as many charts as you want on the same time axis, zoom on all of them at once
- Auto-reload position where you were looking last run
- Overlays, fill between, value bands, symbols, labels, legend, volume profile, heatmaps, etc.
- Can show real-time updates, including orderbook. Save screenshot.
- Comes with a dozen great examples.
What it is not
finplot is not a web app. It does not help you create an homebrew exchange. It does not work with Jupyter Labs.
It is only intended for you to do backtesting in. That is not to say that you can't create a ticker or a trade widget yourself. The library is based on the eminent pyqtgraph, which is fast and flexible, so feel free to hack away if that's what you want.
Easy installation
$ pip install finplot
Example
It's straight-forward to start using. This shows every daily candle of Apple since the 80'ies:
import finplot as fplt
import yfinance

df = yfinance.download('AAPL')
fplt.candlestick_ochl(df[['Open', 'Close', 'High', 'Low']])
fplt.show()
Example 2
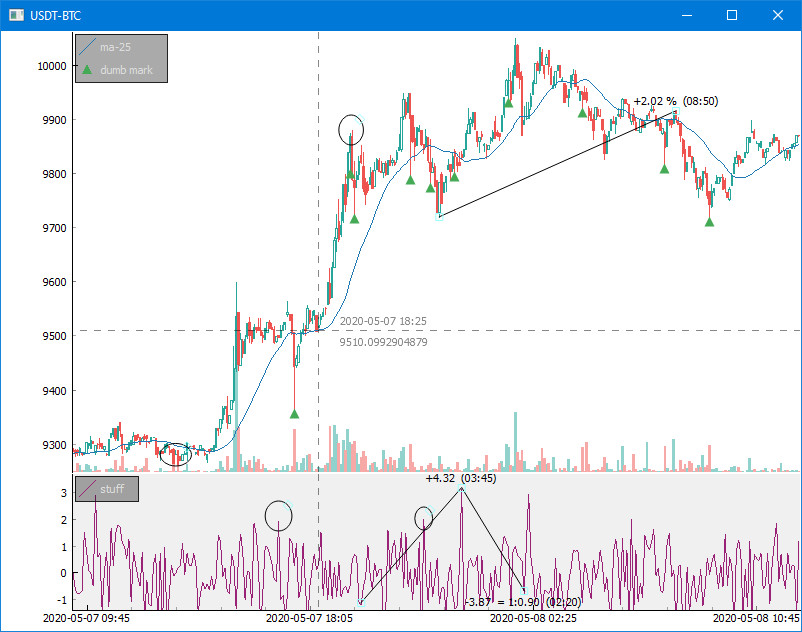
This 25-liner pulls some BitCoin data off of Bittrex and shows the above:
import finplot as fplt
import numpy as np
import pandas as pd
import requests

# pull some data
symbol = 'USDT-BTC'
url = 'https://bittrex.com/Api/v2.0/pub/market/GetTicks?marketName=%s&tickInterval=fiveMin' % symbol
data = requests.get(url).json()

# format it in pandas
df = pd.DataFrame(data['result'])
df = df.rename(columns={'T':'time', 'O':'open', 'C':'close', 'H':'high', 'L':'low', 'V':'volume'})
df = df.astype({'time':'datetime64[ns]'})

# create two axes
ax,ax2 = fplt.create_plot(symbol, rows=2)

# plot candle sticks
candles = df[['time','open','close','high','low']]
fplt.candlestick_ochl(candles, ax=ax)

# overlay volume on the top plot
volumes = df[['time','open','close','volume']]
fplt.volume_ocv(volumes, ax=ax.overlay())

# put an MA on the close price
fplt.plot(df['time'], df['close'].rolling(25).mean(), ax=ax, legend='ma-25')

# place some dumb markers on low wicks
lo_wicks = df[['open','close']].T.min() - df['low']
df.loc[(lo_wicks>lo_wicks.quantile(0.99)), 'marker'] = df['low']
fplt.plot(df['time'], df['marker'], ax=ax, color='#4a5', style='^', legend='dumb mark')

# draw some random crap on our second plot
fplt.plot(df['time'], np.random.normal(size=len(df)), ax=ax2, color='#927', legend='stuff')
fplt.set_y_range(-1.4, +3.7, ax=ax2) # hard-code y-axis range limitation

# restore view (X-position and zoom) if we ever run this example again
fplt.autoviewrestore()

# we're done
fplt.show()
Real-time examples
Included in this repo are a 40-liner Bitfinex example and a slightly longer BitMEX websocket example, which both update in realtime with Bitcoin/Dollar pulled from the exchange. A more complicated example show real-time updates and interactively varying of asset, time scales, indicators and color scheme.
finplot is mainly intended for backtesting, so the API is clunky for real-time applications. The examples/complicated.py was written a result of popular demand.
MACD, Parabolic SAR, RSI, volume profile and others
There are plenty of examples that show different indicators.
| Indicator | Example |
|---|---|
| MACD | S&P 500 |
| RSI | Analyze |
| SMA | Analyze 2 |
| EMA | Analyze |
| TD sequential | Bitfinex |
| Bollinger bands | BitMEX |
| Parabolic SAR | BitMEX |
| Heikin ashi | Analyze |
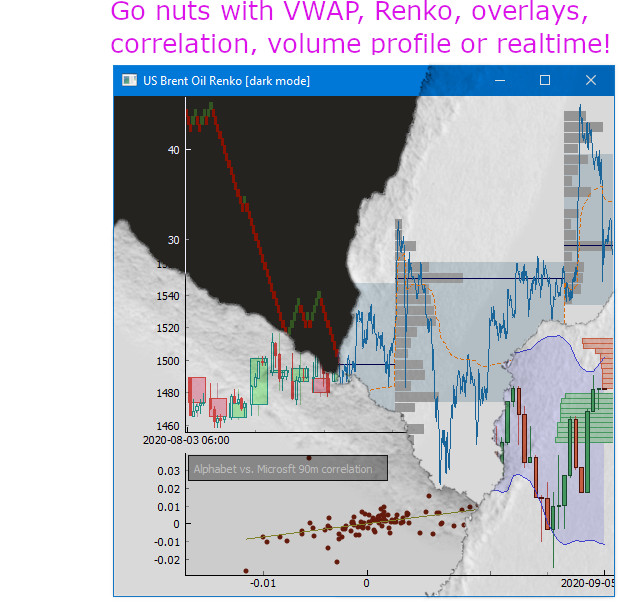
| Renko | Renko dark mode |
| Accumulation/distribution | Analyze |
| On balance volume | Analyze |
| Heat map | Heatmap |
| Volume profile | Volume profile |
| VWAP | Volume profile |
| Period returns | Analyze 2 |
| Asset correlation | Overlay correlate |
| Lines | Bitcoin long term |
| ms time resolution | Line |
For interactively modifying what indicators are shown, see examples/complicated.py.
Snippets
Background color
# finplot uses no background (i.e. white) on even rows and a slightly different color on odd rows.
# Set your own before creating the plot.
fplt.background = '#ff0' # yellow
fplt.odd_plot_background = '#f0f' # purple
fplt.plot(df.Close)
fplt.show()
Unordered time series
finplot requires time-ordered time series - otherwise you'll get a crosshair and an X-axis showing the millisecond epoch instead of the actual time. See my comment here and issue 50 for more info.
It is also imperative that you either put your datetimes in your index, or in the first column. If your
datetime is in the first column, you normally want to have a zero-based range index,
df.reset_index(drop=True), before plotting.
Restore the zoom at startup
# By default finplot shows all or a subset of your time series at startup. To store/restore zoom position:
fplt.autoviewrestore()
fplt.show() # will load zoom when showing, and save zoom when closing
Time zone
# Pandas normally reads datetimes in UTC time zone.
# finplot by default use the local time zone of your computer (for crosshair and X-axis)
from dateutil.tz import gettz
fplt.display_timezone = gettz('Asia/Jakarta')

# ... or in UTC = "display same as timezone-unaware data"
import datetime
finplot.display_timezone = datetime.timezone.utc
Scatter plot with X-offset
To offset your scatter markers (say 0.2 time intervals to the left), see my comment here.
Align X-axes
See issue 27, and possibly (rarely a problem) issue 4.
Disable zoom/pan sync between axes
# finplot assumes all your axes are in the same time span. To decouple the zoom/pan link, use:
ax2.decouple()
Move viewport along X-axis (and autozoom)
Use fplt.set_x_pos(xmin, xmax, ax). See
examples/animate.py.
Place Region of Interest (ROI) markers
For placing ellipses, see issue 57. For drawing lines, see examples/line.py. (Interactively use Ctrl+drag for lines and Ctrl+mbutton-drag for ellipses.)
More than one Y-axis in same viewbox
fplt.candlestick_ochl(df2[['Open','Close','High','Low']], ax=ax.overlay(scale=1.0, yaxis='linear'))
The scale parameter means it goes all the way to the top of the axis (volume normally stays at the bottom).
The yaxis parameter can be one of False (hidden which is default), 'linear' or 'log'.
See issue 52 for more info.
Plot non-timeseries
finplot is made for plotting time series. To plot something different use ax.disable_x_index(). See second
axis of examples/overlay-correlate.py.
Custom crosshair and legend
S&P500 example shows how to set crosshair texts and update legend text+color as a result of mouse hover.
Custom axes ticks
To use your own labels on the X-axis see comment on issue 50.
If you want to roll your own Y-axis, inherit fplt.YAxisItem.
Saving screenshot
See examples/line.py. To keep screenshot in RAM see issue 28.
For creating multiple screenshots see issue 71.
Scaling plot heights
See issue 56. Changing the default window size can be
achieved by setting fplt.winw = 900; fplt.winh = 500; before creating your plot.
Threading
See issue 55.
Titles on axes
See issue 41. To show grid and further adapt axes, etc:
ax.set_visible(crosshair=False, xaxis=False, yaxis=True, xgrid=True, ygrid=True)
Fixing auto-zoom on realtime updates
See issue 131.
Beep
fplt.play_sound('bot-happy.wav') # Ooh! Watch me - I just made a profit!
Keys
Esc, Home, End, g, Left arrow, Right arrow. Ctrl+drag.
Missing snippets
Plot valign on mouse hover, update an orderbook, etc.
Coffee
For future support and features, consider a small donation.
BTC: bc1qk8m8yh86l2pz4eypflchr0tkn5aeud6cmt426m
ETH: 0x684d7d4C52ed428AE9a36B2407ba909D896cDB67
Release history Release notifications | RSS feed


Download files
Download the file for your platform. If you're not sure which to choose, learn more about installing packages.
Source Distribution
Built Distribution
Filter files by name, interpreter, ABI, and platform.
If you're not sure about the file name format, learn more about wheel file names.
Copy a direct link to the current filters
File details
Details for the file finplot-1.7.tar.gz.
File metadata
- Download URL: finplot-1.7.tar.gz
- Upload date:
- Size: 38.0 kB
- Tags: Source
- Uploaded using Trusted Publishing? No
- Uploaded via: twine/3.2.0 pkginfo/1.6.1 requests/2.25.0 setuptools/49.2.1 requests-toolbelt/0.9.1 tqdm/4.54.1 CPython/3.9.0
File hashes
| Algorithm | Hash digest | |
|---|---|---|
| SHA256 |
d2e8f874914b77546be1cc6e6e46515d5db49af474e16daf20d3c479dc96c4bc
|
|
| MD5 |
2b16589405b5d9ac3e808642040ccda1
|
|
| BLAKE2b-256 |
08abbbfd285e582ac90f9cb0209f5e7b743351badc2e70770f239da4431d5073
|
File details
Details for the file finplot-1.7-py3-none-any.whl.
File metadata
- Download URL: finplot-1.7-py3-none-any.whl
- Upload date:
- Size: 33.8 kB
- Tags: Python 3
- Uploaded using Trusted Publishing? No
- Uploaded via: twine/3.2.0 pkginfo/1.6.1 requests/2.25.0 setuptools/49.2.1 requests-toolbelt/0.9.1 tqdm/4.54.1 CPython/3.9.0
File hashes
| Algorithm | Hash digest | |
|---|---|---|
| SHA256 |
51892bc3aa81b23114974eea19785eddbcd8b13671db9725105a32c83b0580d6
|
|
| MD5 |
f45df41a9f4b0e7117bf0e148bfa6d4e
|
|
| BLAKE2b-256 |
07bc6b5555bb993d33040a7ac5dd70cef4867a716bb73d3f071acac93aa955b1
|


