
Local-first visual debugger for Python agents.
One HTML file. No cloud, no account. See LLM calls, tool calls, branches, errors, tokens, and cost.



Part of the Loom stack — local HTML traces for long-running agent loops.
Stack products: loom-run (dev) · loom-ops (ops) — --trace via loom-runner or @trace.
New: static context — possible vs actual execution
flow-xray now shows not just what happened in a run, but the nearby paths the source code allowed.
from flow_xray import trace
from flow_xray.static_index import build_index

result = trace.run(agent, query)
index = build_index([__file__])
result.to_html("trace.html", static_index=index)
Open trace.html and click "Show static context" in the Graph view:
- untaken branches (e.g. a tool that was never selected this run) render as dashed ghost nodes
- calls the static pass couldn't see — dynamic dispatch, decorators, monkey-patching — are marked runtime-only, not silently dropped
- click any node to see its static callers, static callees, and blast radius next to the usual runtime detail panel
This answers questions a plain runtime trace can't: was this the only branch that could have run, and what depends on the function that just broke? See examples/static_context_demo.py for a runnable scenario with a failing branch, an untaken alternative, and a dynamic call.
Loom stack
Overview: kroq86.github.io/loom-stack — packages, flow, audience, quick start.
The stack is a pyramid, not five equal frameworks. Tail-call optimization is the primitive, runner is the durable runtime, xray is the microscope, and the apps prove the stack in real workflows.
| Layer | Project | Job |
|---|---|---|
| Primitive | loom-tailcalls | Make async recursive/state-machine loops stack-safe |
| Runtime kernel | loom-runner | Make those loops durable, resumable, idempotent |
| Microscope | flow-xray ← this repo | Show what actually happened in one offline HTML trace |
| Proof app | loom-run | Chat agent reference implementation |
| Proof app | loom-ops | Ops/runbook agent reference implementation |
@tailrec agent loop  →  loom-runner run/resume  →  --trace trace.html
     (shape)                  (durability)              (flow-xray)
This repo is the microscope. It does not provide durability or agent
orchestration; it shows what actually happened. Use standalone with @trace,
or via loom-runner --trace / loom-run /
loom-ops --trace — no cloud account
required. Ecosystem: ECOSYSTEM.md
from flow_xray import trace

@trace
def call_llm(prompt):
    return openai.chat(prompt)

@trace
def agent(query):
    plan = call_llm(f"plan: {query}")
    return call_llm(f"answer based on: {plan}")

result = trace.run(agent, "weather in Tokyo?")
result.to_html("trace.html")
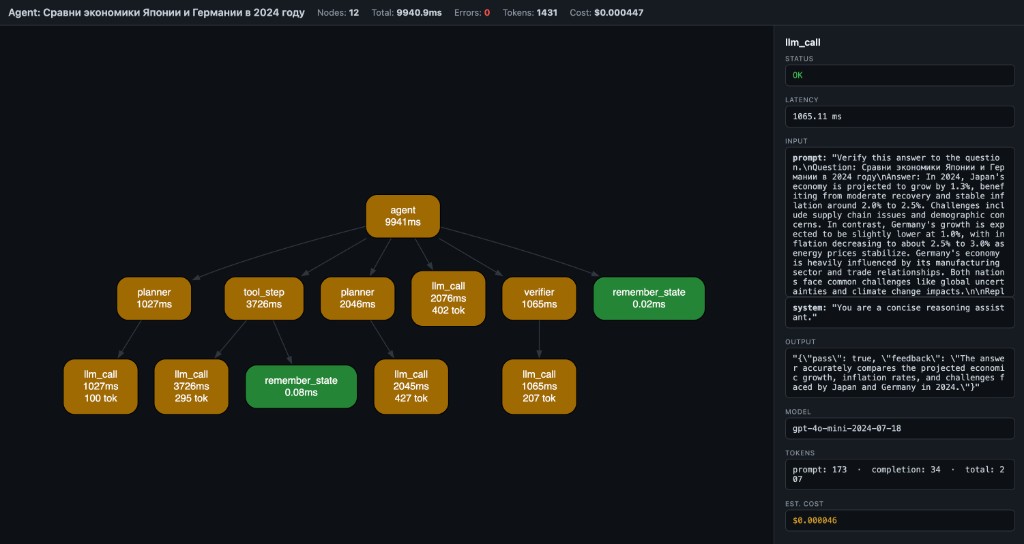
Open trace.html — you get a local debug artifact with:
- LLM calls
- tool calls
- branches and nested steps
- errors and retries
- tokens and estimated cost
- graph, timeline, overview, and raw trace views
No server, no account, no log viewer — one local HTML file.
The main use case
Your agent's final answer looks fine, but you do not trust the middle.
You want to see:
- which LLM calls happened
- which tool calls ran
- where the run branched or nested
- where an error or retry happened
- where tokens and cost accumulated
flow-xray is built for that exact debugging job.
Who this is for
flow-xray is most useful for:
- LangGraph users who want local tracing without hosted tooling
- LangChain users debugging tool calls and intermediate steps
- developers building Python tool-calling agents
- people who want one local trace artifact they can inspect or share after redaction
Install
pip install flow-xray
30-second quickstart
Create demo_trace.py:
from flow_xray import trace

@trace
def fetch_profile(user_id):
    return {"id": user_id, "plan": "pro"}

@trace
def answer_question(user_id):
    profile = fetch_profile(user_id)
    return f"user {profile['id']} is on {profile['plan']}"

result = trace.run(answer_question, 42)
result.to_html("demo_trace.html")
Run it:
python demo_trace.py
Open demo_trace.html in your browser. You should see one root node (answer_question) and one child node (fetch_profile).
When to use what
Use trace.run(...) when
- you control the function call directly
- you want the clearest Python API
- you want full control over arguments and return values
- you are tracing inside tests, scripts, notebooks, or app code
from flow_xray import trace

@trace
def pipeline(x):
    return x * 2

result = trace.run(pipeline, 5)
result.to_html("pipeline.html")
Use flow-xray run ... when
- you already have a Python script on disk
- you want a quick local trace without editing much code
- the traced calls already happen at module scope when the file is executed
flow-xray run my_agent.py --html trace.html
Usage
Decorator + trace.run
from flow_xray import trace

@trace
def step_a(x):
    return x + 1

@trace
def pipeline(x):
    return step_a(x) * 2

result = trace.run(pipeline, 5)
result.to_html("pipeline.html")
CLI
flow-xray run my_agent.py --html trace.html
The script must use @trace on the functions you want captured.
CLI onboarding
flow-xray run executes the file inside a trace session, but it does not enter if __name__ == "__main__" blocks.
That means:
- if your traced function call happens at module scope,
flow-xray runcan capture it directly - if your traced function call only happens inside
main()guarded byif __name__ == "__main__", the CLI may produce0 nodes
If you hit 0 nodes, use one of these fixes:
- Move a traced demo call to module scope for local debugging.
- Call
trace.run(...)inside the script instead. - Keep using the Python API directly from a small wrapper script.
Example that works with flow-xray run:
from flow_xray import trace

@trace
def step():
    return 1

step()
Example that will usually show 0 nodes with flow-xray run:
from flow_xray import trace

@trace
def step():
    return 1

if __name__ == "__main__":
    step()
Async support
@trace works with async def out of the box. Use trace.arun(...)
when you are already in async code:
import asyncio
from flow_xray import trace

@trace
async def call_api(query):
    await asyncio.sleep(0.1)  # simulate async I/O
    return {"answer": query}

@trace
async def agent(query):
    result = await call_api(query)
    return result["answer"]

result = await trace.arun(agent, "hello")
result.to_html("async_trace.html")
Token / cost tracking
Token usage and estimated cost are auto-extracted from OpenAI response objects, or you can set them manually:
@trace
def call_llm(prompt):
    resp = openai.chat.completions.create(...)
    trace.meta(model=resp.model,
               prompt_tokens=resp.usage.prompt_tokens,
               completion_tokens=resp.usage.completion_tokens)
    return resp.choices[0].message.content
Tracing a service: every request, on disk, with issues
trace.run captures one script run. For a service, keep a capture per request /
job and let flow-xray flag problems:
from flow_xray import TraceStore, trace
from flow_xray.asgi import TraceMiddleware

trace.configure(max_value_chars=100_000)          # keep full prompts
store = TraceStore("traces", retention_days=7, max_llm_calls=3)

app.add_middleware(TraceMiddleware, store=store)  # FastAPI / Starlette / any ASGI

with store.capture("job", "reindex", trace_id="job-42"):   # workers, scripts
    reindex()
flow-xray report traces --issues # recent runs: duration, LLM calls, tokens, issues, HTML path
Built-in issue checks: errors (reported where raised), slow nodes, calls repeated with
identical inputs, too many model calls; add your own with TraceStore(rules=[...]).
Redaction and share-safe traces
Use decorator options when a trace may contain secrets or bulky payloads:
from flow_xray import trace

@trace(redact={"api_key", "authorization"}, capture_output=False)
def call_service(api_key, payload):
    ...
redact={...}masks matching argument names and nested dict keys as[redacted]capture_output=Falsekeeps the real return value in Python, but stores[redacted]in the HTML trace
Safety and sharing
flow-xray serializes trace data into the generated HTML file.
By default, that can include:
- function names
- bound inputs
- outputs
- exceptions
- attached
trace.meta(...)fields - token and cost metadata
Use the privacy controls when you want a trace that is safer to share:
redact={...}hides matching input names and nested dict keys as[redacted]capture_output=Falsekeeps the real Python return value, but writes[redacted]into the HTML trace
Treat trace files as local debugging artifacts unless you have explicitly reviewed or redacted their contents. A trace is generally safer to share when you have:
- redacted secrets, auth headers, API keys, or user data
- hidden sensitive outputs with
capture_output=False - checked the generated HTML once before posting it publicly
Why not LangSmith or plain logs?
Use flow-xray when you want
- local-first debugging
- one HTML file you can open immediately
- graph and timeline views, not only logs
- no account and no hosted tracing requirement
Use plain logs when you want
- quick event-level debugging
- a tiny amount of output
- no structured trace at all
Use hosted tracing tools when you want
- team dashboards
- long-term trace storage
- production monitoring
- centralized evaluation workflows
flow-xray is best when your question is:
What actually happened inside this Python agent run, locally, right now?
What you see
- Nodes = function calls (name + latency + tokens)
- Edges = caller → callee
- Green = OK, Red = error, Yellow = slow (>1s)
- Header = total nodes, latency, tokens, estimated cost
- Click a node → side panel shows inputs, output, error, timing, model, tokens, cost
Why this exists
Langfuse, Helicone, LangSmith — they give you timelines and logs.
But when your agent pipeline branches, retries, or chains 6 tools — you don't need another table. You need a graph.
flow-xray is not an agent framework. It's the layer below them — like Chrome DevTools is to browsers.
Docs
Compatibility
- Python 3.10, 3.11, 3.12, 3.13, 3.14 — tested
- Sync and async functions — both supported
- Any Python code — not limited to LLM calls; works with any function you decorate
- Frameworks — works alongside LangGraph, CrewAI, OpenAI SDK, or plain Python
How it works
@trace wraps functions (sync and async). When called inside a trace.run() session (or flow-xray run CLI), it records:
- function name
- bound arguments
- return value or exception
- wall-clock latency
- token usage and estimated cost (auto or manual)
- parent/child relationships (call stack → DAG)
result.to_html() embeds the trace as JSON in a self-contained HTML page that renders via WASM Graphviz (CDN, works offline after first load).
The trace viewer also includes search, zoom/reset controls, and copy-details for the currently selected node.
Also included
Scalar autodiff core (micrograd-style Value graph with DOT/JSON export and stepping debugger) lives under flow-xray dot CLI and from flow_xray import Value. See examples/ and plan.md.
License
MIT
1 maintainer

Metadata
1 maintainer
Release files for flow-xray 0.4.0
For a detailed explanation of source distributions (sdists) and built distributions (wheels), please see the package formats documentation.
Source distribution (sdist)
| File | Size | Uploaded | |
|---|---|---|---|
| flow_xray-0.4.0.tar.gz | 43.3 kB | Details |
Built distribution (wheel)
| File | Interpreter | ABI | Platform | Reset |
|---|---|---|---|---|
| flow_xray-0.4.0-py3-none-any.whl | Python 3 | none | any | Details |
Total release size: 93.1 kB
Release files / flow_xray-0.4.0.tar.gz
| Download URL | flow_xray-0.4.0.tar.gz |
|---|---|
| Size | 43.3 kB |
| Tags | Source |
|
SHA-256 checksum How to use checksums |
ac5a0c62836e4622ef511f202eea4f7080c139182303c71c6265d20aa681e7f0
|
|
BLAKE2b-256 checksum How to use checksums |
7b7470e4ca4e9b70fd2f49d1c557853e943bbf3f5b059f485e5ec873e1e75d0a
|
| Upload date | |
|
Uploaded using Trusted Publishing? What is trusted publishing? |
No |
| Uploaded via |
twine/7.0.0 CPython/3.13.14
|
Release files / flow_xray-0.4.0-py3-none-any.whl
| Download URL | flow_xray-0.4.0-py3-none-any.whl |
|---|---|
| Size | 49.7 kB |
| Tags | Python 3 |
|
SHA-256 checksum How to use checksums |
007560bb7d627ab3ef3656d0a5f32abc7c1164baff98cfd8c5b0636cf536090c
|
|
BLAKE2b-256 checksum How to use checksums |
c6ac6da558dda3184f3f6612990c8b2325bb7df76166ea4eaecde235546197f9
|
| Upload date | |
|
Uploaded using Trusted Publishing? What is trusted publishing? |
No |
| Uploaded via |
twine/7.0.0 CPython/3.13.14
|














