
foldmetrics: unified confidence metrics & interface contacts for structure-prediction models
| Testing |  |
|---|---|
| Package |    |
| Meta |   |
Download statistics: PyPI totals (Pepy).
🧬 What is it?
foldmetrics ingests the raw output folders of the mainstream structure
predictors — AlphaFold2 / AlphaFold-Multimer, ColabFold, AlphaFold3, Boltz,
Chai-1, Protenix, OpenDDE, HelixFold3, SeedFold — and computes a consistent set of quality metrics for
monomers and complexes (protein, nucleic acid and small-molecule ligands),
for a single model or whole batches:
| Metric | What it tells you | Source |
|---|---|---|
ptm, iptm |
global / interface predicted TM-score | read from tool output |
ranking_score |
tool-native model ranking (AF3 ranking_score, Boltz confidence_score, Chai aggregate_score, AF2 ranking_confidence) |
read from tool output |
plddt_mean |
mean per-token pLDDT | computed |
iplddt |
mean pLDDT over interface residues (contact atoms within 8 Å across chains) | computed |
pae_mean, ipae_mean |
mean PAE (all off-diagonal / inter-chain blocks) | computed |
ipsae |
interface score from PAE with per-residue d0 (Dunbrack 2025) | computed |
pdockq |
interface score from contacts + pLDDT (Bryant 2022) | computed |
pdockq2 |
interface score from contacts + pLDDT + PAE (Zhu 2023) | computed |
lis |
Local Interaction Score from PAE (Kim 2024) | computed |
dockq |
true interface accuracy vs a reference structure (Basu & Wallner 2016) | computed |
Beyond scores it extracts confident interface contacts (with ready-to-open PyMOL/ChimeraX sessions) and renders publication-oriented figures.
Point it at whatever the engine wrote — its own output tree, untouched. To produce those predictions in the first place, foldrunner enumerates the pairs, computes each MSA once and drives all of these engines from one panel; its output is what foldmetrics reads here.
📦 Installation
pip install foldmetrics
That is the whole install: every metric, DockQ included, the interface
contacts, and the figures — the structure panel is drawn by a built-in
ribbon renderer on every platform. For ray-traced PyMOL cartoons, contact
views and .pse sessions, add the one optional extra:
pip install "foldmetrics[pymol]"
Works on Linux, macOS and Windows: it installs
pymol-open-source-whl,
an unofficial build of the unmodified open-source PyMOL (Schrödinger's own
PyPI package is alpha-only and its macOS wheels do not import; verified here
on Linux and macOS). A PyMOL from Homebrew or conda-forge is found just as
well.
Development install — adds pytest, ruff and the official DockQ package,
which serves only as the reference the built-in implementation is tested
against:
git clone https://github.com/ChiaChunL/foldmetrics.git
cd foldmetrics
pip install -e ".[dev]"
⚡ Quickstart
CLI (foldmetrics, short alias fmx):
Every command below runs as-is from a clone, against the bundled real
examples — swap examples/data for your own prediction folders or files:
# score everything (tools are auto-detected and can be mixed)
fmx score examples/data -o metrics.tsv --interfaces interfaces.tsv --plot plots/

# one metric only — every metric name is also a subcommand
fmx ipsae examples/data
fmx score examples/data --metrics ipsae,pdockq2,lis

# campaign view: aggregate seeds/samples per target and tool
fmx score preds/ --by-target summary_by_target.tsv

# confident interface contacts: table + figure + PyMOL/ChimeraX sessions
fmx contacts examples/data/af3_server -o contacts.tsv --plot plots/

# DockQ: the AlphaFold2 model against the AlphaFold-Server model as reference
fmx dockq examples/data/af2_multimer --ref examples/data/af3_server/fold_barnase_barstar_s318_model_0.cif

# what would be scored?
fmx detect examples/data
Python:
import foldmetrics as fmx

df = fmx.evaluate("examples/data")  # one row per model
print(df[["model", "tool", "iptm", "ipsae", "pdockq2"]].round(3))
#                                model       tool   iptm  ipsae  pdockq2
#           model_1_multimer_v3_pred_0 alphafold2  0.937  0.897    0.952
#                    mpro_nirmatrelvir alphafold3  0.970  0.836      NaN
#    fold_barnase_barstar_s318_model_0 alphafold3  0.930  0.890    0.944
#              barnase_barstar_model_0      boltz  0.959  0.935    0.939

dfi = fmx.evaluate_interfaces("examples/data")  # one row per chain pair
agg = fmx.aggregate_by_target(df)  # one row per target+tool over all models
pred = fmx.load_predictions("examples/data")[0]
contacts = fmx.find_contacts(pred, dist_cutoff=8.0, pae_cutoff=12.0)
More recipes live in examples/ — real example predictions are included there, so every command runs as-is straight after cloning.
🛠️ Command-line reference
paths accepts anything: a directory (scanned recursively; different
tools can be mixed freely), one specific model file, or several paths at
once.
| Option | Commands | Meaning |
|---|---|---|
paths |
all | prediction files and/or directories to process |
--tool NAME |
all | restrict to one tool (colabfold, alphafold2, alphafold3, boltz, chai, protenix, opendde, helixfold3, seedfold); default auto-detects |
-o, --out FILE |
score, metric subcommands, contacts, dockq | write the result table; format follows the extension (.tsv/.csv/.json) |
--interfaces FILE |
score, metric subcommands | also write the per chain-pair table |
--metrics LIST |
score | report only these metrics, e.g. --metrics ipsae,pdockq2 |
--by-target [FILE] |
score | also print (and optionally write) the per-target/tool aggregate over seeds and samples |
--target-pattern REGEX |
score | rewrite the inferred target from a regex, to unify job names that differ between tools |
--plot DIR |
score, metric subcommands, contacts | write figures into DIR (contacts also writes a .pml) |
--pae-cutoff Å |
score family (default 10, for ipSAE) · contacts (default 12; negative disables) | PAE confidence threshold |
--dist-cutoff Å |
score family, contacts (default 8) | contact-atom distance threshold |
--renderer {auto,pymol,ribbon,trace} |
score family, plot, contacts | structure panel: PyMOL cartoon when available, else the built-in ribbon |
--format {png,pdf,svg} / --dpi N |
plot | figure file format and resolution |
--ref FILE |
dockq | reference structure to compare against (required) |
--mapping A:A,B:D |
dockq | model:reference chain pairing |
--best-mapping |
dockq | try every chain assignment, keep the best (homo-multimers) |
--small-molecule |
dockq | also score small-molecule ligand poses |
--no-align / --capri-peptide |
dockq | pair residues by numbering instead of by alignment · CAPRI peptide criteria |
fmx <command> --help prints the complete option list for any command.
Shell tab-completion is available via pip install "foldmetrics[completion]"
followed by activate-global-python-argcomplete.
Screening many seeds and samples
Large campaigns produce many models per complex. --by-target collapses
them into one row per target and tool — model count, mean/std/max ipTM
and ipSAE, best pDockQ2, and the name of the best model (by
ranking_score, else ipSAE, else ipTM):
         target       tool  n_models                         best_model  iptm_mean  iptm_std  ipsae_mean  ipsae_max
barnase_barstar alphafold3        16 barnase_barstar_seed-1030_sample-2      0.930     0.000       0.888      0.893
The standard deviations show how stable the prediction is across seeds —
a low mean with high spread is a very different situation from a
consistently low one. The same table is available in Python as
fmx.aggregate_by_target(df).
The target is inferred from the job directory, so tools that were given
different job names for the same complex (1brs here, 1brs_barnase_barstar
there) land in different rows. --target-pattern reduces the names to the
part that identifies the complex, which puts every method back on one row:
fmx score runs/ --target-pattern '^(\w{4})' --by-target by_target.tsv
The first capturing group becomes the new target; names the pattern does
not match are left alone. In Python: fmx.apply_target_pattern(df, pattern).
🖼️ Visualization
--plot DIR (on score and every metric subcommand) or the plot
subcommand renders figures that adapt automatically to the shape of the
batch:
| Input shape | Figures written into DIR |
|---|---|
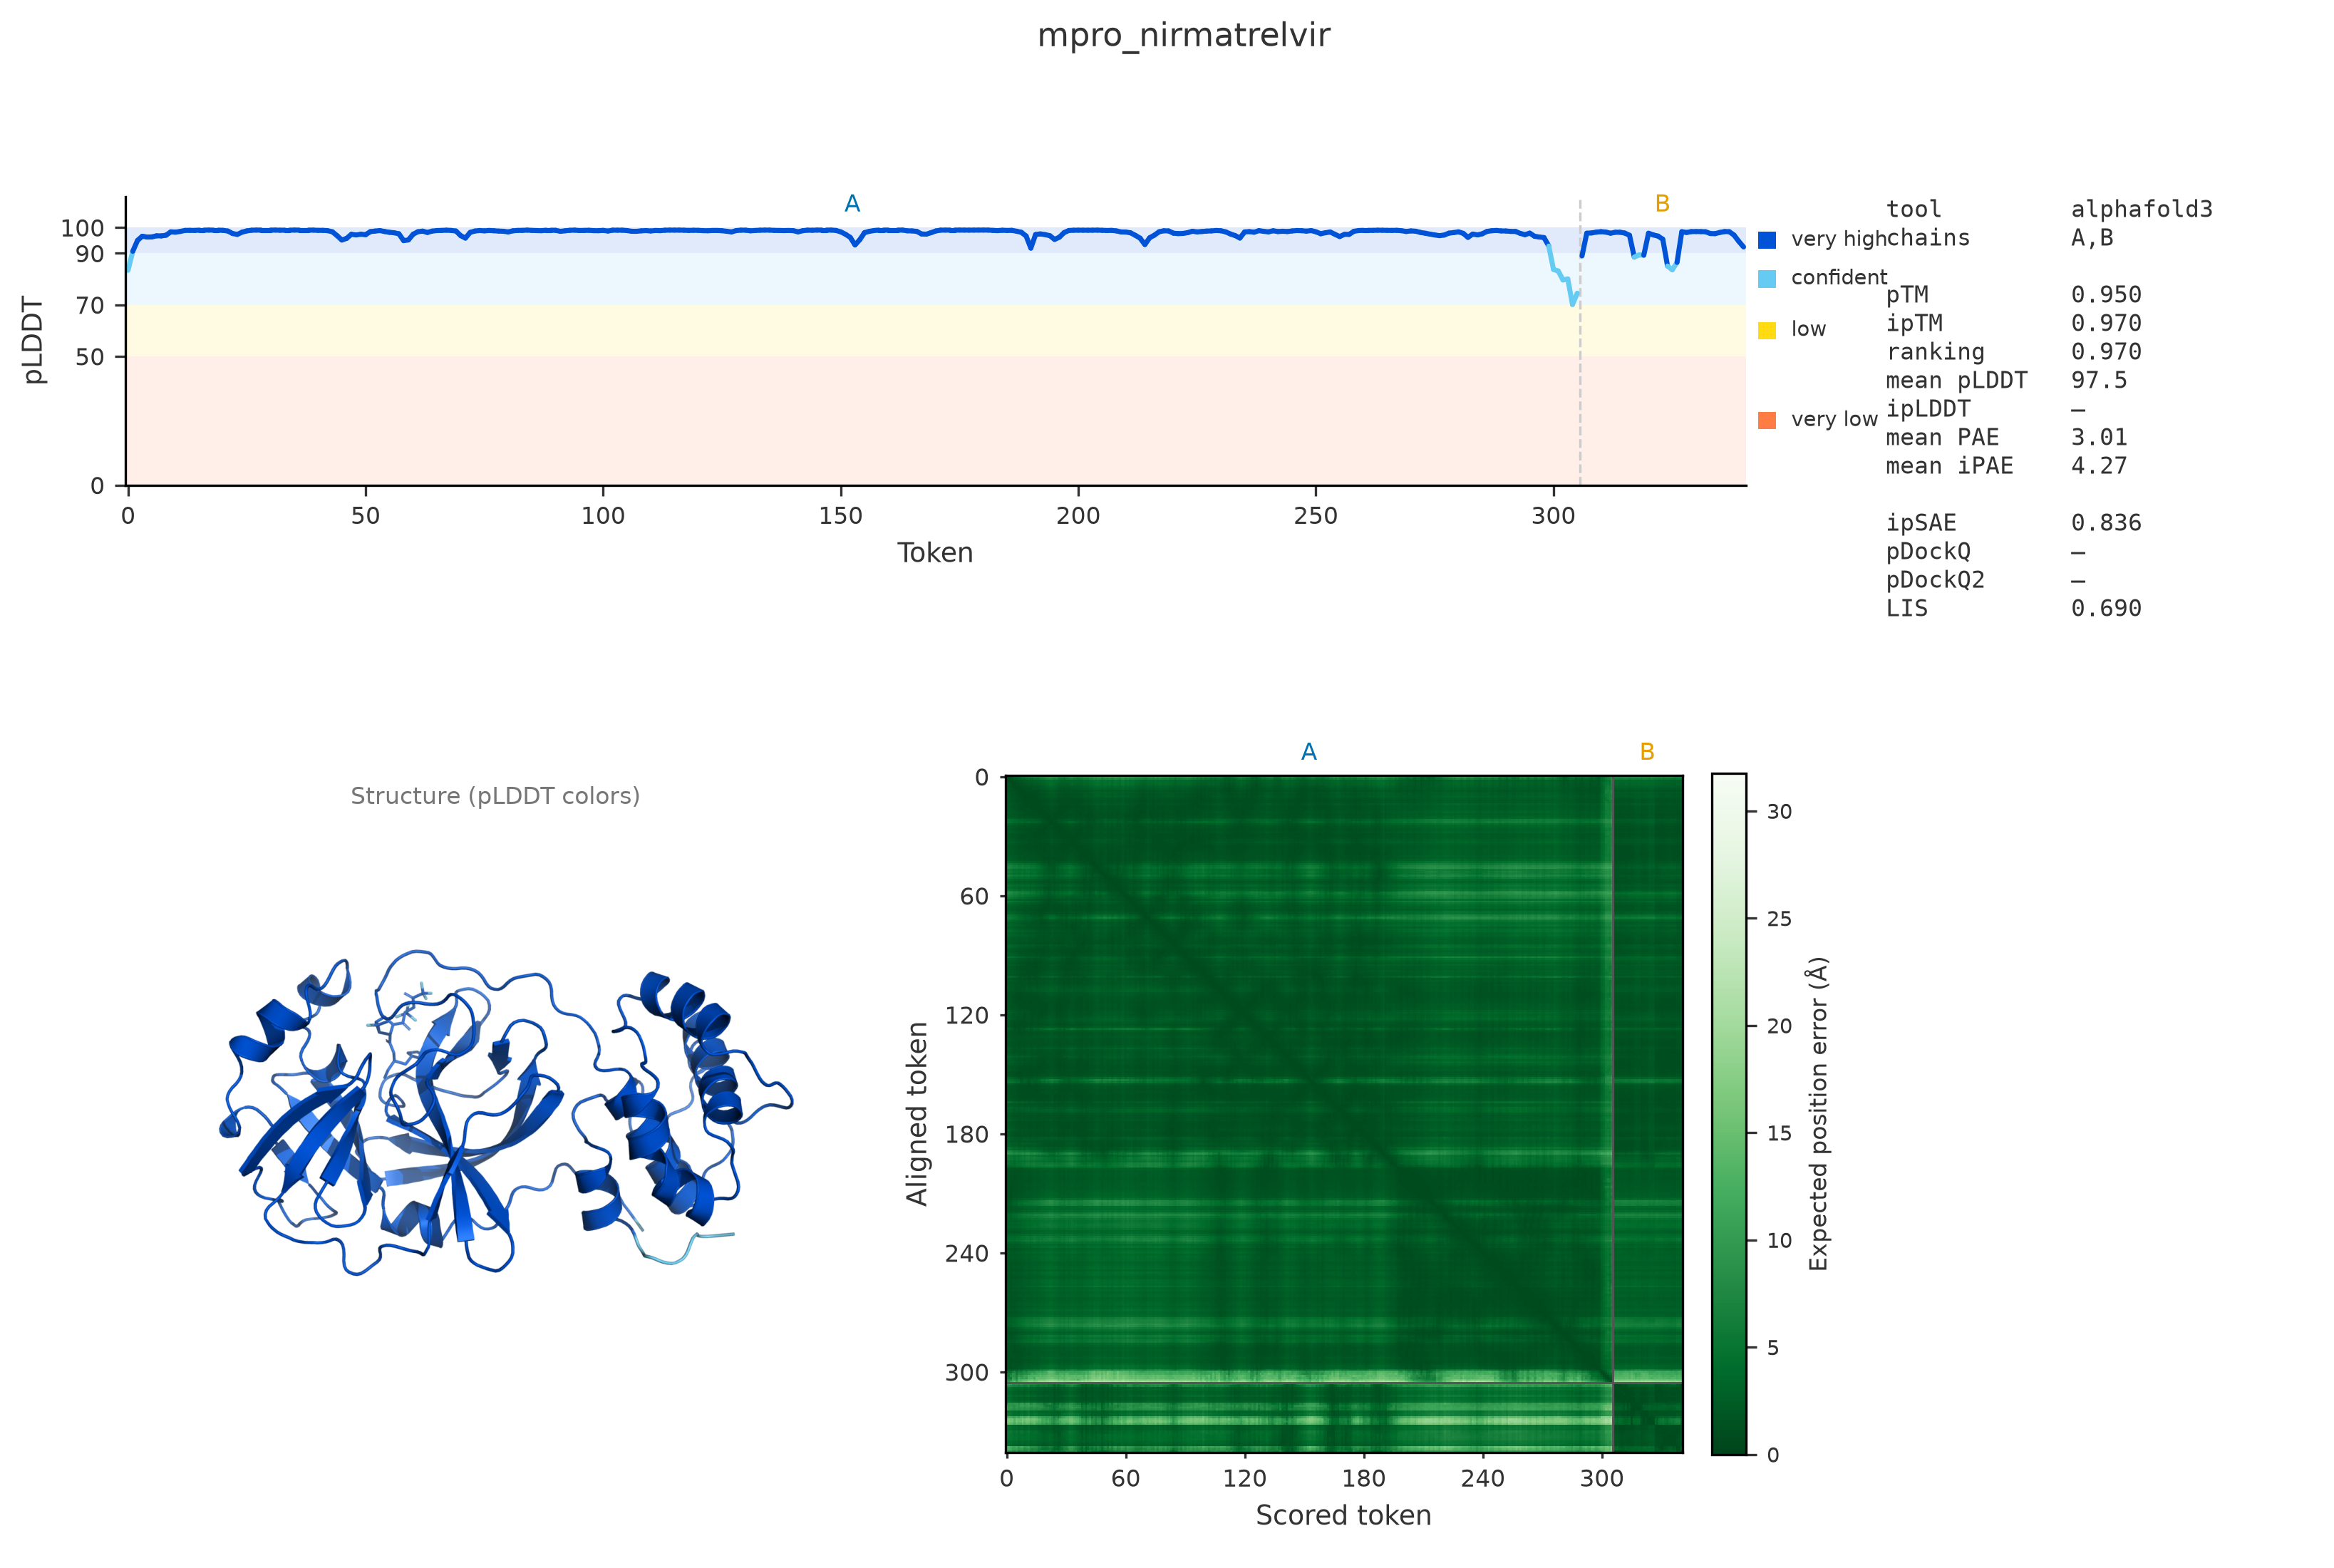
| every model | <model>.png — pLDDT-colored structure + pLDDT track + PAE heatmap + metrics panel |
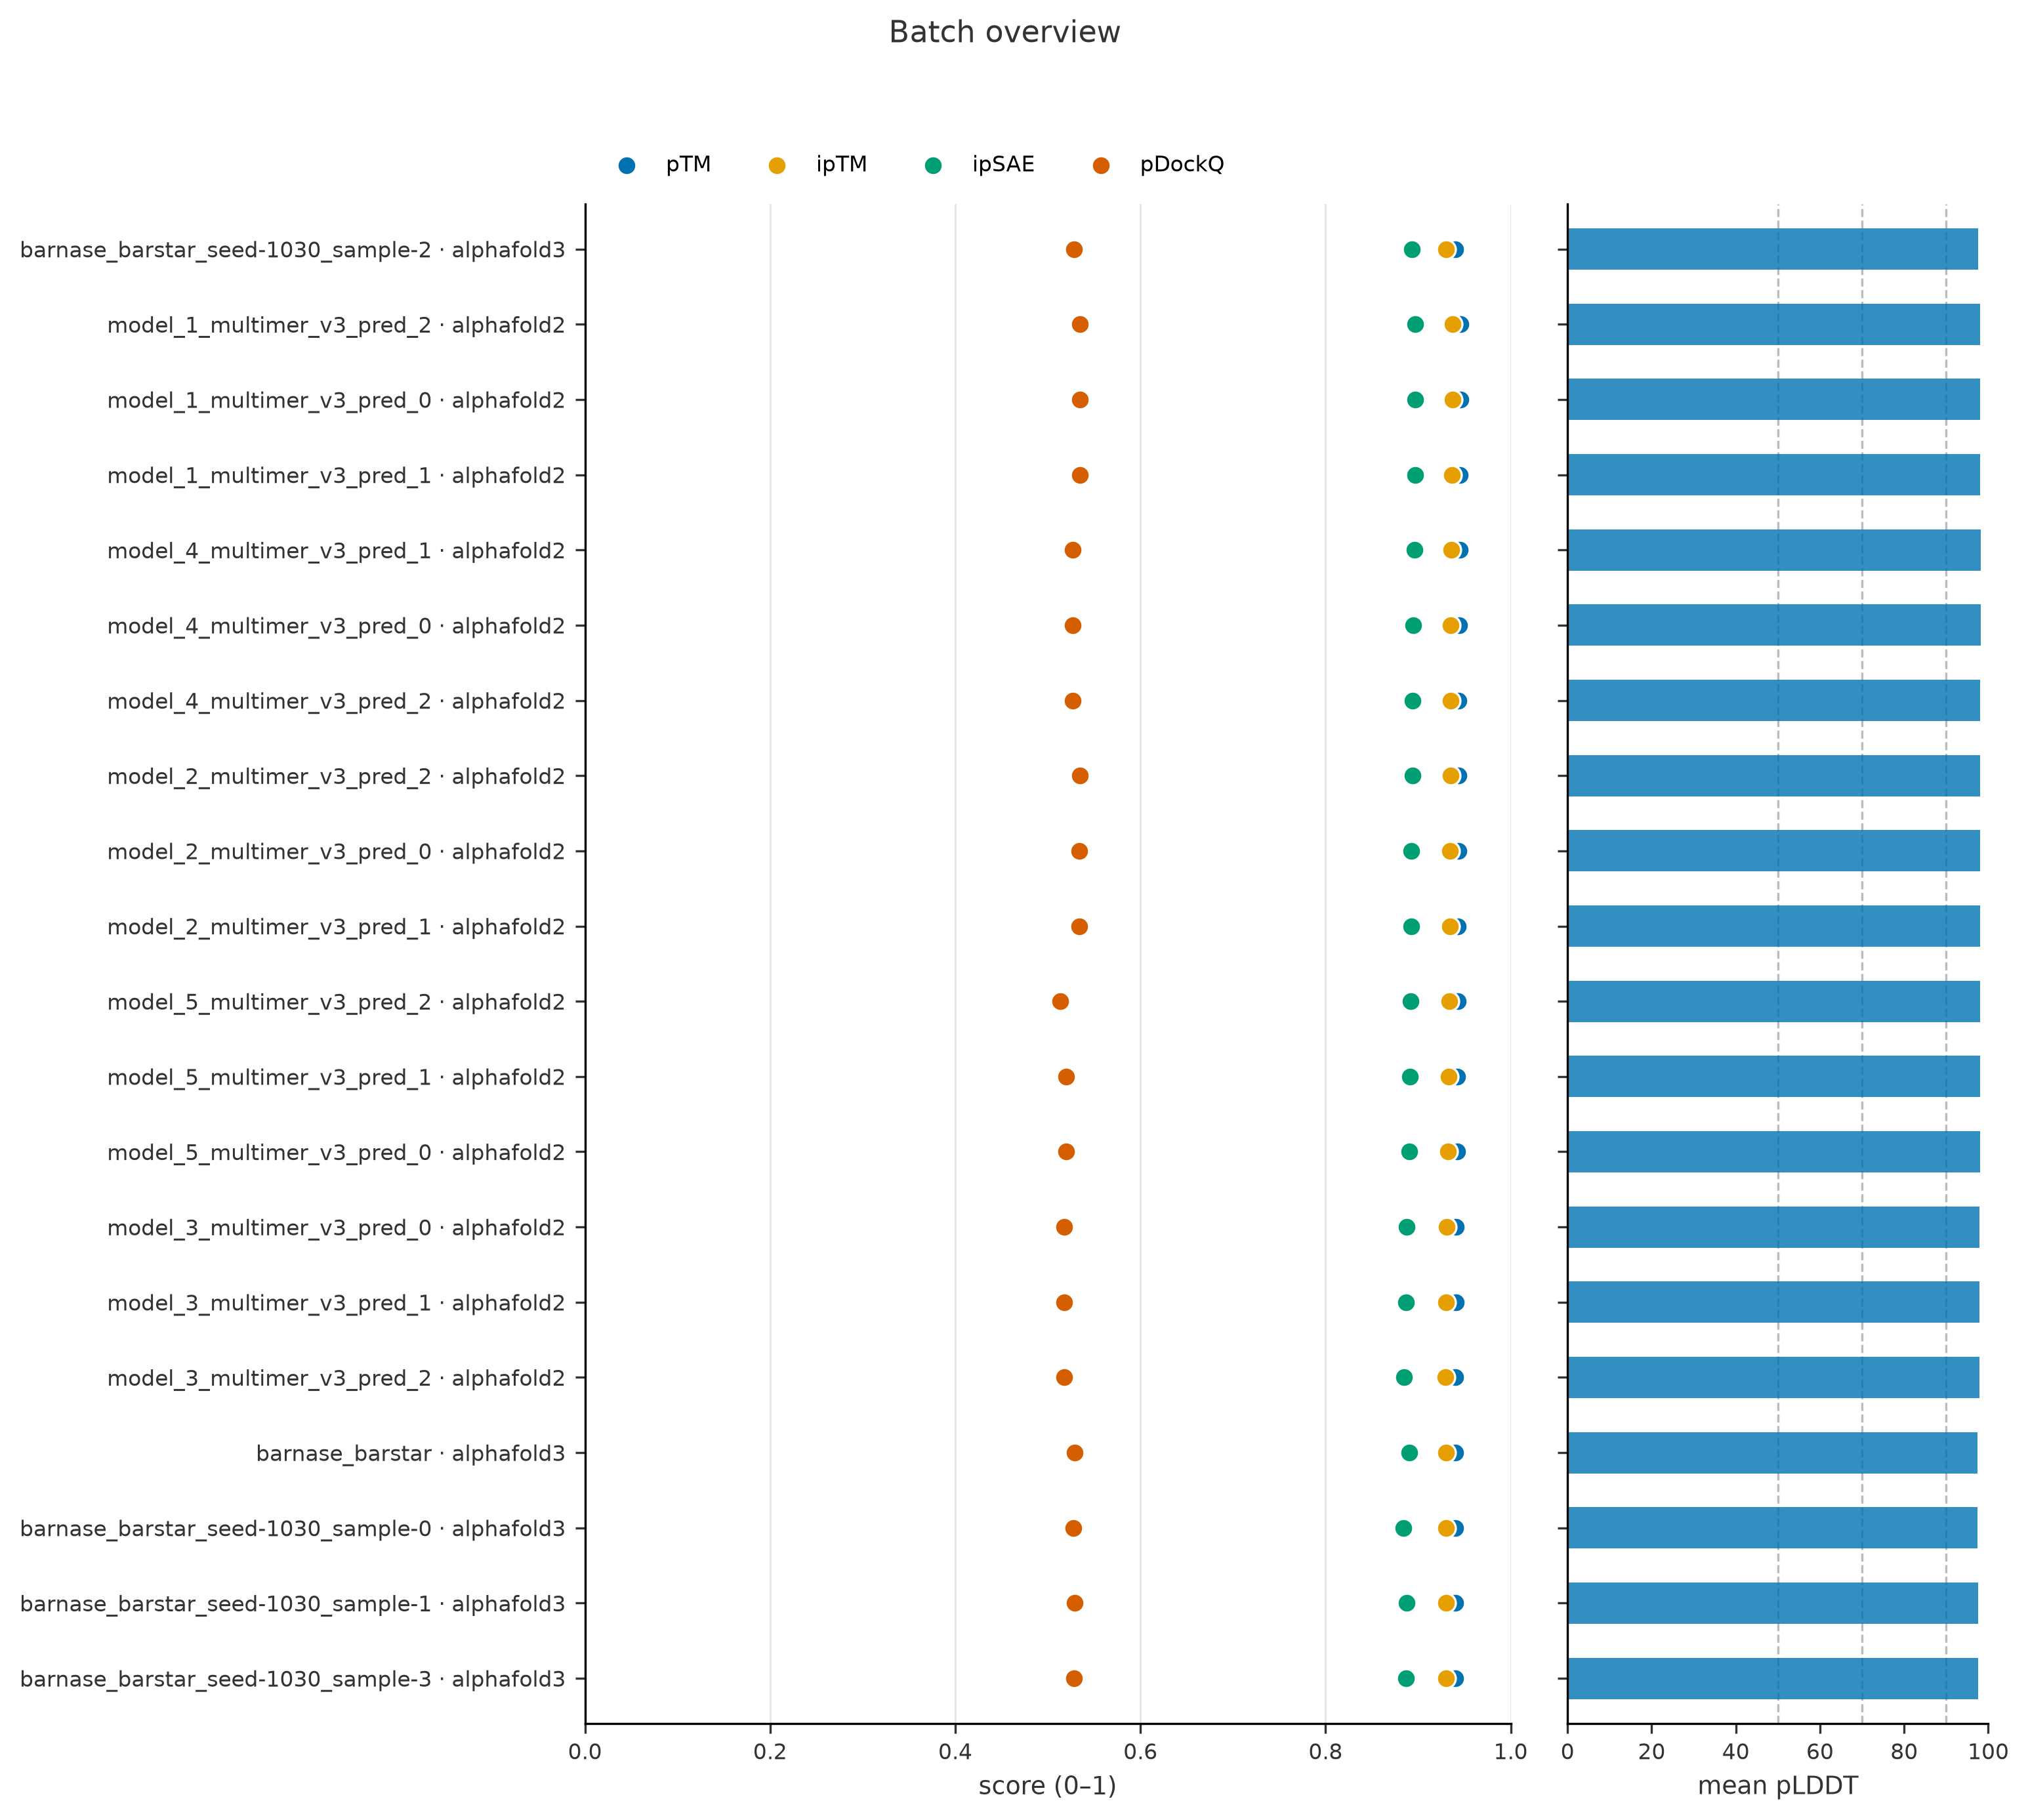
| more than one model | plus batch_overview.png — ranked confidence dot plot + mean pLDDT bars |
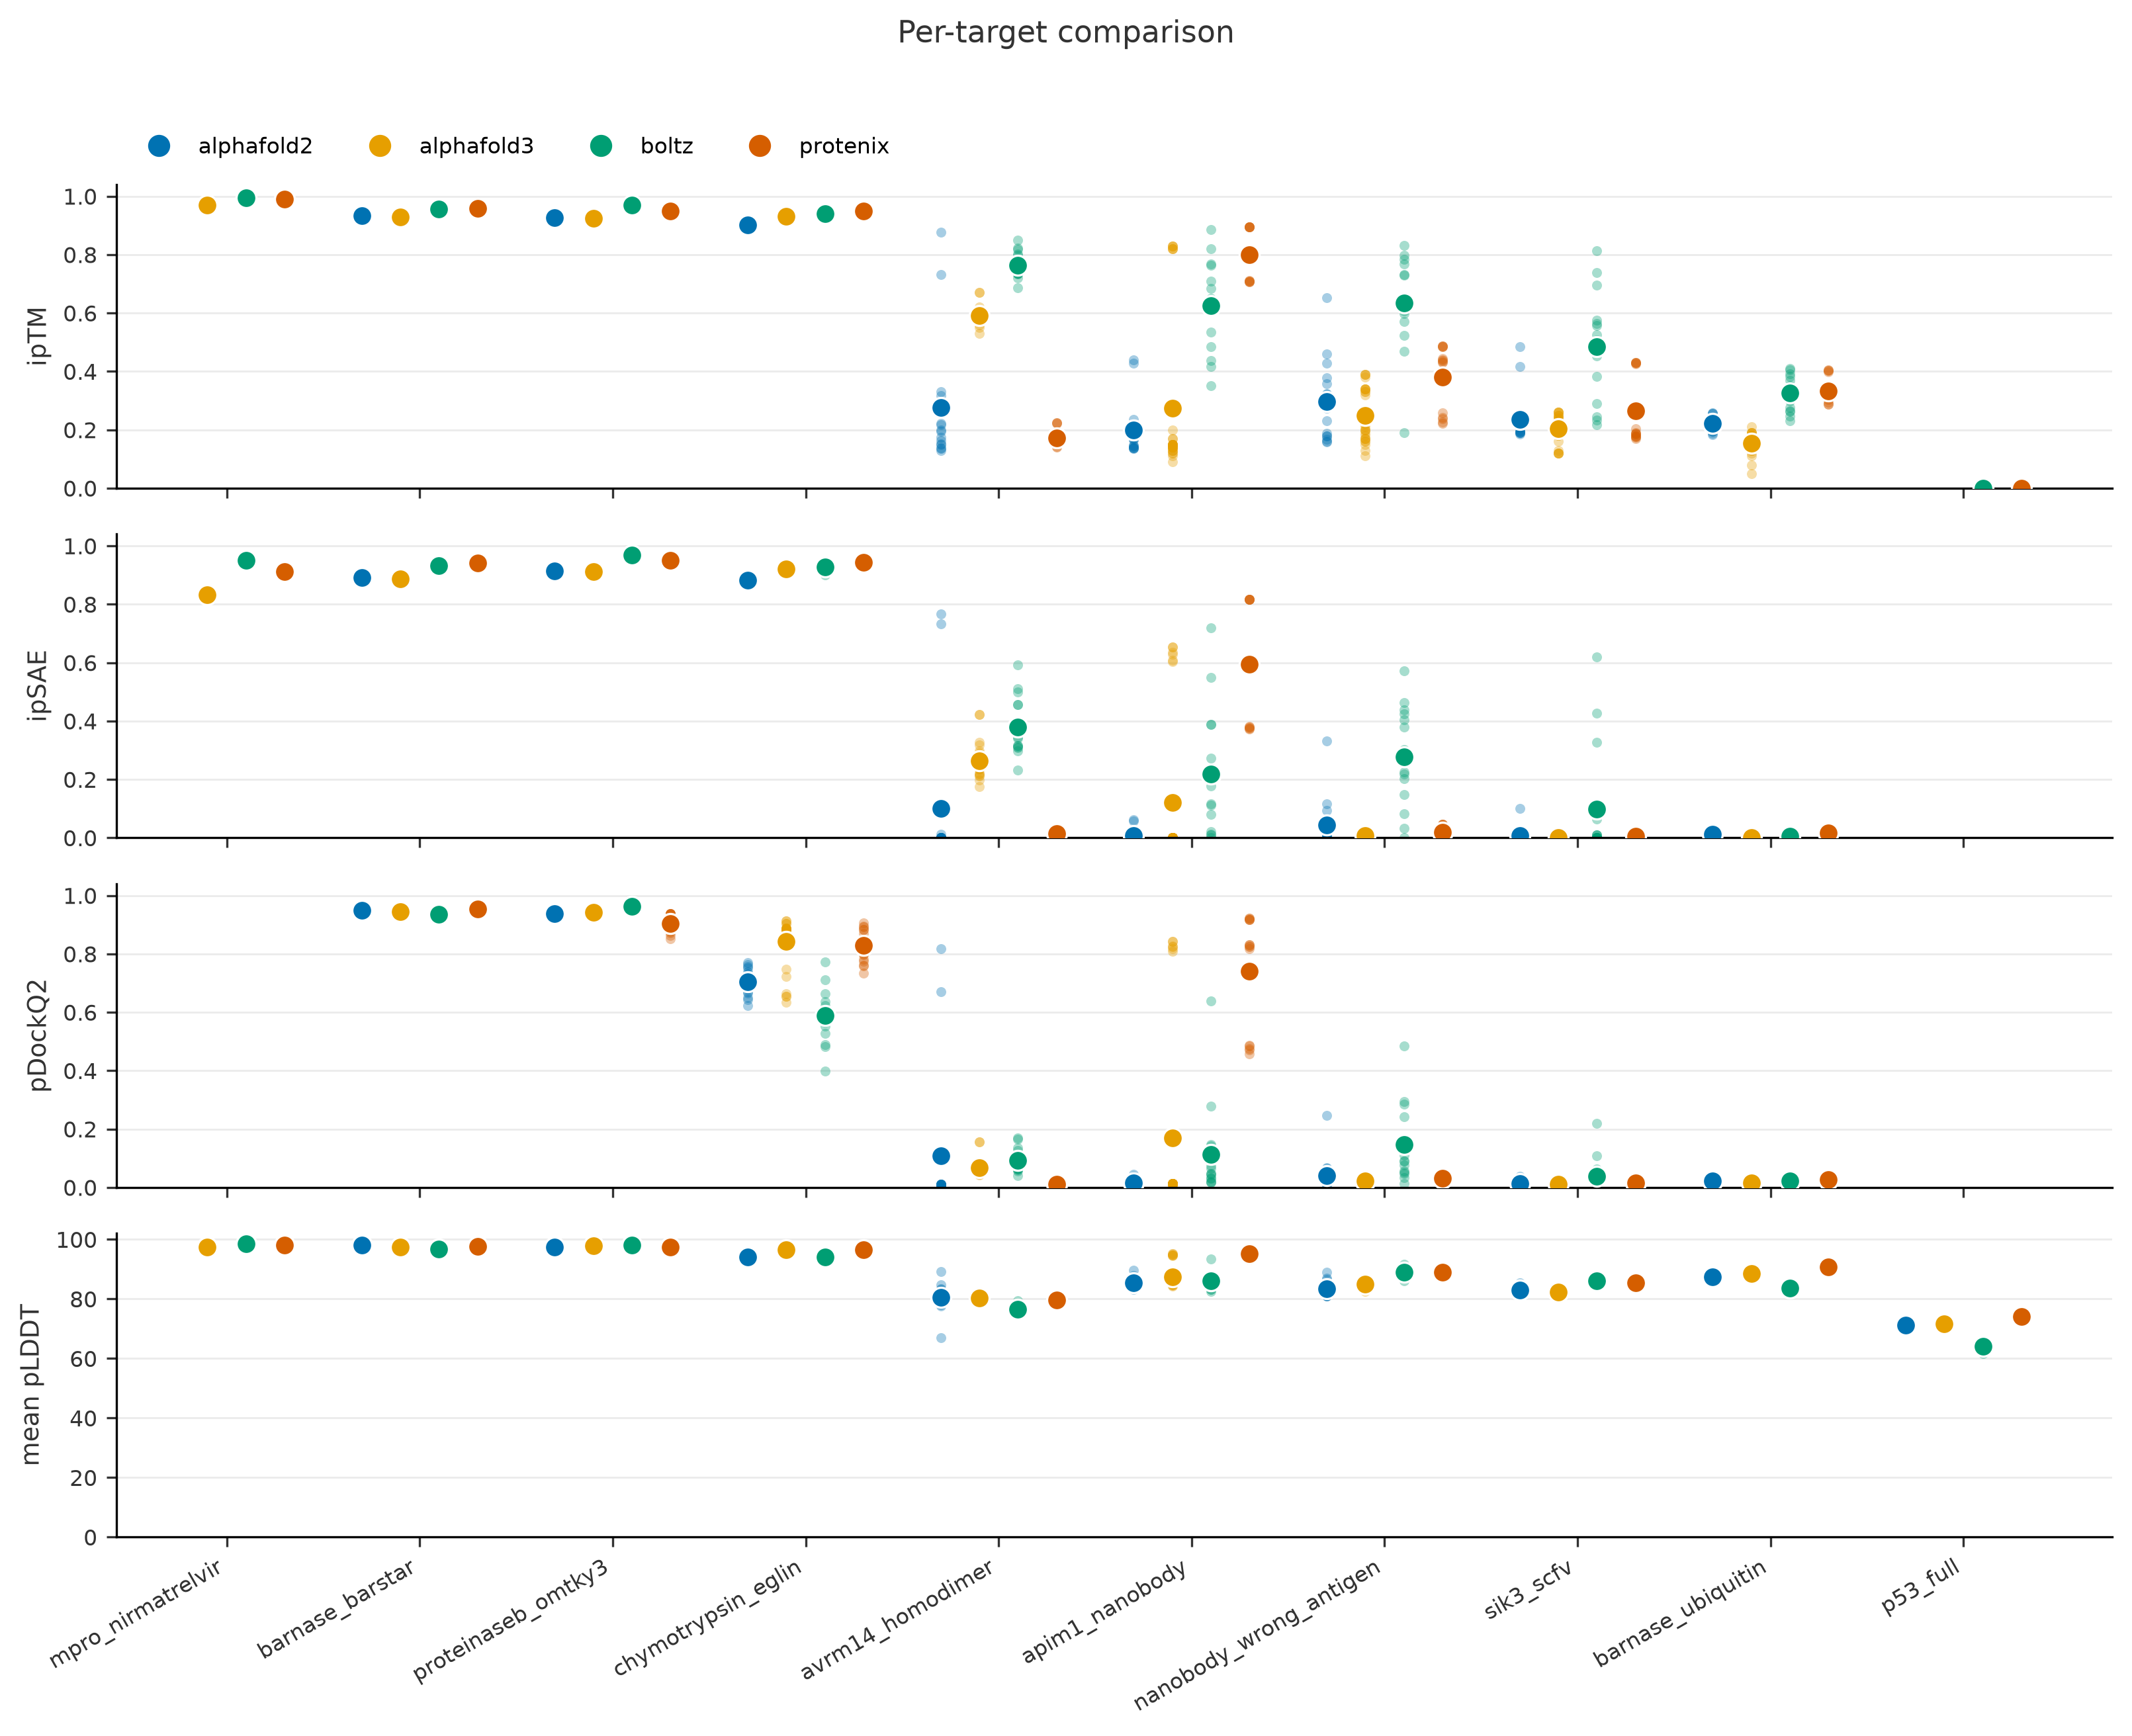
| more than one target and/or tool | plus comparison.png — one panel per metric, grouped by target, one color per tool |
The structure panel is a ray-traced PyMOL cartoon when PyMOL is
installed and otherwise the built-in ribbon: a spline through the
CA / C1' trace, widened where the chain is helix or strand (assigned from CA
geometry alone with P-SEA, Labesse 1997), oriented to its widest face as
PyMOL's orient would. The panel title says which one you are looking at.
--renderer pymol insists on PyMOL and explains when it cannot,
--renderer ribbon picks the built-in one, and FOLDMETRICS_PYMOL points
at a specific PyMOL executable.
plot also takes --format png|pdf|svg and --dpi.
Single model (AlphaFold3, SARS-CoV-2 Mpro + nirmatrelvir):
Targets × methods comparison (real batch: 10 complexes × 4 tools):
Batch overview (one target, AlphaFold2 + AlphaFold3 models):
🤝 Confident interface contacts
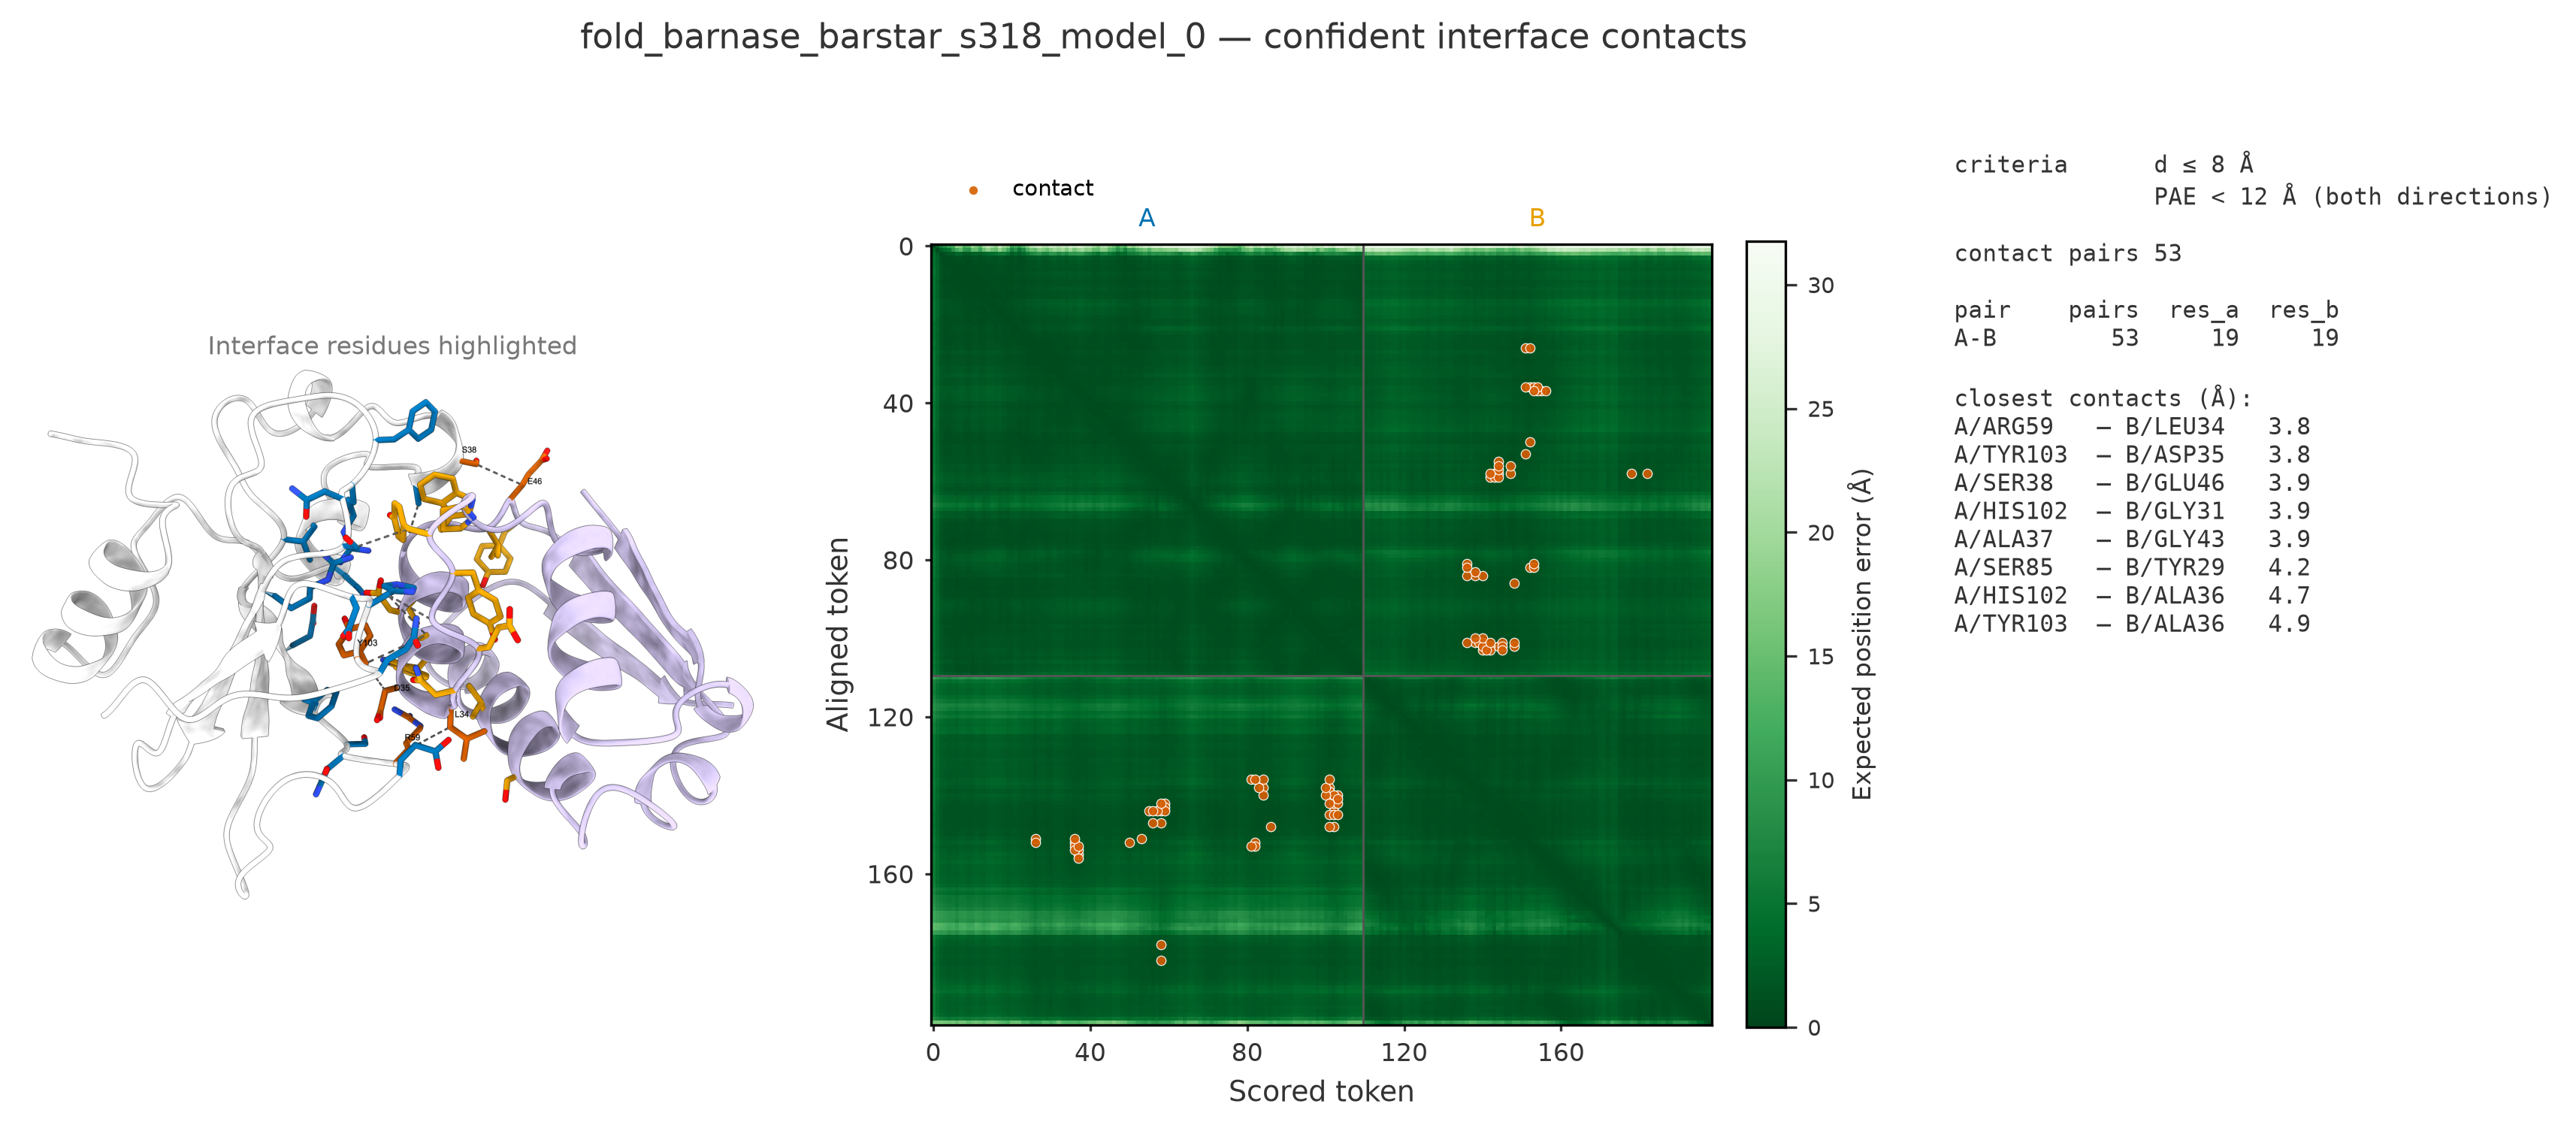
A contact is an inter-chain residue (or ligand-atom) pair within
--dist-cutoff 8 Å whose
PAE is below
--pae-cutoff 12 Å in both directions (negative disables the PAE
filter).
fmx contacts examples/data/af3_server -o contacts.tsv --plot plots/
-o writes the contact table; --plot DIR adds, per model:
*_contacts.png— the figure below*_contacts.pse/*_contacts.cxs— PyMOL / ChimeraX sessions: double-click to open the styled interface scene, withif_A/if_B/hotspots/interfaceselections ready (--no-sessionsskips)*_contacts.pml/*_contacts.cxc— the same scene as plain scripts, always written
🎯 DockQ against a reference
When an experimental (or otherwise trusted) structure exists, fmx dockq
computes the actual interface accuracy. The implementation is
foldmetrics' own — it needs only numpy and gemmi, so it installs
everywhere — and reproduces the official DockQ v2 package field for field
(see Validation):
fmx dockq preds/ --ref 1brs.pdb -o dockq.tsv
fmx dockq preds/ --ref native.cif --mapping A:A,B:D   # explicit chain pairing
fmx dockq preds/ --ref homodimer.cif --best-mapping   # search all assignments
fmx dockq preds/ --ref complex.cif --small-molecule   # score ligand poses too
Reports DockQ, fnat, iRMSD, LRMSD, the CAPRI-style class and the chain
mapping used, per interface. Chains are matched by name when both
structures share names, otherwise by order — mmCIF label vs auth chain ids
differ between tools, so check the mapping column. Override explicitly
with --mapping MODEL:REF,..., or let --best-mapping try every
assignment and keep the best total DockQ (recommended for homo-multimers;
refused above 5 chains). Additional switches: --no-align (skip sequence
alignment when residue numbering already matches) and --capri-peptide
(protein–peptide criteria).
📊 How to read the scores
| Score | Guidance | Basis |
|---|---|---|
| pLDDT | > 90 very high (side chains reliable); 70–90 backbone confident; 50–70 low; < 50 likely disordered | AlphaFold confidence bands (Jumper 2021) |
| pTM / ipTM | > 0.8 confident; 0.6–0.8 gray zone, inspect; < 0.6 likely wrong (interface) | AlphaFold-Multimer / AF3 guidance |
| PAE | < 5 Å: relative placement of the two positions is reliable; > ~15 Å: unreliable | AlphaFold documentation |
| pDockQ | > 0.23 acceptable or better; > 0.5 confident | Bryant 2022 |
| pDockQ2 | estimates DockQ, so DockQ classes apply: < 0.23 incorrect; ≥ 0.23 acceptable; ≥ 0.49 medium; ≥ 0.80 high | Zhu 2023; Basu & Wallner 2016 |
| ipSAE | no published universal cutoff; in our 720-model validation known binders scored ≥ 0.88 and decoys ≤ 0.10 — values above ≈ 0.5 indicate a confidently predicted interface | Dunbrack 2025 + our validation |
| LIS | higher is better; the authors propose ≈ 0.2 as the interaction cutoff | Kim 2024 |
| DockQ | < 0.23 incorrect; 0.23–0.49 acceptable; 0.49–0.80 medium; ≥ 0.80 high | Basu & Wallner 2016 (CAPRI classes) |
pDockQ2 has two established readings
Zhu 2023 fixes pDockQ2's sigmoid and PAE term but not which atom defines a contact, whose pLDDT is read, or whether the partner chain enters the average, and implementations diverge:
| contact atom | pLDDT | interface residues | |
|---|---|---|---|
Dunbrack ipsae.py, ColabFold — our default |
CB (CA for Gly) | that residue's CB | union of both chains, counted once |
the paper's own pdockq2.py (variant="zhu2023") |
CA | that residue's CA | scored chain only, weighted by contacts |
They differ by ~0.005 on real AlphaFold3 output and coincide on AlphaFold2,
whose pLDDT is constant within a residue. variant= on
foldmetrics.metrics.pdockq2_asym selects; pdockq2 in the tables is the
maximum of the two directional values (the paper defines no interface-level
aggregate).
Single scores can mislead — pDockQ ignores PAE and stays deceptively high on confidently-folded but wrongly-docked chains, which pDockQ2/ipSAE expose. Read them together; that is rather the point of this package.
🧰 Supported tools and files
| Tool | Detected files | pTM/ipTM | pLDDT | PAE |
|---|---|---|---|---|
| ColabFold | *_scores_rank_*.json + *_(un)relaxed_rank_*.pdb |
yes | yes | yes |
| AlphaFold2 (pickle layout) | result_model_*.pkl + unrelaxed_*.pdb / ranked_*.pdb |
yes | yes | yes |
| AlphaFold2 (JSON layout) | iptm_ptm.json + confidence_*.json / pae_*.json + unrelaxed_*.cif/.pdb |
yes | yes | yes |
| AlphaFold3 (server/local) | *model*.cif + *summary_confidences*.json + *confidences*/full_data*.json |
yes | yes | yes |
| Boltz-1/2 | confidence_*_model_*.json + *_model_*.cif + pae_*.npz / plddt_*.npz |
yes | yes | yes |
| Chai-1 | scores.model_idx_*.npz + pred.model_idx_*.cif + pae_model_idx_*.npz |
yes | yes | yes |
| Protenix | *summary_confidence*.json + matching .cif (+ *full_data*.json with token_pair_pae) |
yes | yes | yes |
| OpenDDE | Protenix layout and keys; told apart by the mmCIF data block ..._predicted_by_opendde |
yes | yes | yes |
| HelixFold3 | <job>/<job>-pred-<I>-<S>/all_results.json + predicted_structure.cif (the -rank<N> copies are dropped) |
yes | yes | yes |
| SeedFold | confidence_*_model_*.json + *_model_*.cif (Boltz-shaped, no .npz) |
yes | yes | no |
Native per-tool extras (Boltz complex_iplddt, AF3 chain_pair_pae_min,
Chai clash flags, …) are kept on Prediction.extras, and chain-pair ipTM is
surfaced as iptm_native in the interface table. Forks are told apart by
the provenance their output actually carries — OpenDDE writes Protenix's
exact files and is recognised by its mmCIF data block, SeedFold writes
Boltz's and is recognised by the absence of Boltz's .npz files — never by
guessing from directory names.
✅ Validation
- ipSAE, pDockQ, pDockQ2 and LIS match the Dunbrack Lab
ipsae.pyreference digit for digit on real AlphaFold3 server output (both directions, d0chn variant, default cutoffs 10/10). - On real ColabFold 1.6 output they reproduce ColabFold's own embedded values to ~1e-5 (bounded by the 2-decimal PAE in its JSON); a CI test enforces this on every commit.
- DockQ reproduces the official DockQ v2 package to 1e-4 (the reference computes in float32) on real predictions — DockQ, fnat, fnonnat, F1, iRMSD, LRMSD, clashes and chain roles — including a reference with missing residues and shifted numbering, the CAPRI peptide thresholds, pairing by numbering, and symmetry-corrected ligand RMSD; the parity tests run against the official package wherever it installs.
- Batch-tested on 720+ real predictions from every supported engine, including protein–ligand complexes, homodimers, monomers and negative controls, with zero parse errors: known binders score ipSAE 0.9+, decoys < 0.1, monomers report NA. OpenDDE and Protenix given the same MSAs agree within 0.02 on every metric.
- Layout-tested on untouched native output trees, including multi-seed /
multi-sample campaigns; each engine's duplicate copies of a model (AF2
ranked_*, AF3's top-level model, HelixFold3's-rank<N>directories) are counted once. HelixFold3 is validated for layout and keys only — its confidence values came from a run without MSAs.
📋 What each metric needs
The structure file is always required (it defines chains and tokens); the
table shows which additional inputs each metric consumes. When an input is
missing the metric is NA and a note lands in the warnings column —
nothing crashes.
| Metric (= subcommand) | pLDDT | Coordinates | PAE | Source |
|---|---|---|---|---|
ptm, iptm, ranking |
– | – | – | read from the tool's confidence file |
plddt (mean pLDDT, ipLDDT) |
yes | ipLDDT only | – | B-factors, or the tool's pLDDT file |
pae (mean PAE, inter-chain PAE) |
– | – | yes | tool's PAE matrix |
pdockq |
yes | yes | – | contacts at 8 Å between CB/C3' atoms |
pdockq2 |
yes | yes | yes | |
ipsae, lis |
– | – | yes | chain mapping from the structure |
contacts |
reported | yes | recommended | distance always; PAE filter when present |
dockq |
– | yes | – | plus a reference structure (--ref) |
📁 Outputs and paths
- Summary table → stdout;
-o FILEwrites it, the extension picking.tsv(default),.csvor.json; missing values areNA.--interfaces FILEwrites the per chain-pair table the same way. --plot DIR→ the figures above;contacts --plotadds<model>_contacts.png/.pml/.cxc(+.pse/.cxssessions). Model names are sanitized ([^\w.-]→_) for filenames;plot -o DIRdefaults to./foldmetrics_plots/.- Exit codes:
0success,1nothing recognized/found,2bad arguments.
💡 Conventions worth knowing
- Tokens. One per standard residue; one per heavy atom for ligands and modified residues (AF3-style), so token-level PAE lines up across tools. pLDDT is 0–100 everywhere (Boltz's 0–1 is rescaled).
- Complex-level interface metrics are the best interface. With more
than two chains,
ipsae/pdockq/pdockq2/lisin the summary are the maximum over chain pairs;--interfaceshas the full breakdown. - Ligand interfaces.
pdockq/pdockq2/iplddtare polymer–polymer only; for pairs involving a ligand chain,ipsae/lisrun over ligand atom tokens (experimental,ipsae_mode = "tokens"). ranking_scoreis comparable across tools, kept on 0–1. AlphaFold builds that writeranking_confidenceas a percentage are rescaled (the raw value stays inextras); an AF2 monomer keeps its mean-pLDDT ranking on the pLDDT scale, as the tool defines it.- The
targetis the job directory. Seed and sample directories are stripped so a job's models aggregate together; tools that name the same complex differently stay apart until--target-pattern. - Missing data degrades gracefully: no PAE → PAE-based metrics are NaN
plus a note in
warnings; nothing crashes. - Directionality. PAE is asymmetric, so
pdockq2/ipsae/lishave two directional values; the interface table reports both (*_ab,*_ba) and the aggregate used elsewhere (max for ipSAE/pDockQ2, mean for LIS, as in the reference implementations).
📚 References
- Jumper J et al. Highly accurate protein structure prediction with AlphaFold. Nature 596, 583–589 (2021). — pLDDT / PAE and their confidence bands
- Bryant P, Pozzati G, Elofsson A. Improved prediction of protein-protein interactions using AlphaFold2. Nat Commun 13, 1265 (2022). — pDockQ
- Zhu W, Shenoy A, Kundrotas P, Elofsson A. Evaluation of AlphaFold-Multimer prediction on multi-chain protein complexes. Bioinformatics 39, btad424 (2023). — pDockQ2
- Dunbrack RL. ipSAE: scoring pairwise interactions in AlphaFold models. bioRxiv (2025). — ipSAE
- Kim AR et al. Enhanced protein-protein interaction discovery via AlphaFold-Multimer. bioRxiv (2024). — LIS
- Basu S, Wallner B. DockQ: A quality measure for protein-protein docking models. PLoS ONE 11, e0161879 (2016); Mirabello C, Wallner B. DockQ v2. Bioinformatics (2024). — DockQ
📄 License
1 maintainer

Metadata
1 maintainer
Release files for foldmetrics 0.2.0
For a detailed explanation of source distributions (sdists) and built distributions (wheels), please see the package formats documentation.
Source distribution (sdist)
| File | Size | Uploaded | |
|---|---|---|---|
| foldmetrics-0.2.0.tar.gz | 93.8 kB | Details |
Built distribution (wheel)
| File | Interpreter | ABI | Platform | Reset |
|---|---|---|---|---|
| foldmetrics-0.2.0-py3-none-any.whl | Python 3 | none | any | Details |
Total release size: 176.9 kB
Release files / foldmetrics-0.2.0.tar.gz
| Download URL | foldmetrics-0.2.0.tar.gz |
|---|---|
| Size | 93.8 kB |
| Tags | Source |
|
SHA-256 checksum How to use checksums |
79ab4c8174992a0e42aaa5b296defaf60283e4e476f22c98c2d46721a94316cd
|
|
BLAKE2b-256 checksum How to use checksums |
e89127db2cd985696d877ae8dd2a1c715fcbd93295982417d6f6f7ff2b409940
|
| Upload date | |
|
Uploaded using Trusted Publishing? What is trusted publishing? |
Yes |
| Uploaded via |
twine/7.0.0 CPython/3.13.14
|
Provenance
Provenance describes where a file came from. On PyPI, provenance is shared via attestations, which provide a verifiable record of the build or publishing details. View details, limitations and caveats.


PyPI Publish Attestation
PyPI verified that this artifact, at this checksum, originated from the publisher listed below.
Signed by GitHub Actions, verified by PyPI on Sep 11, 2026.
Transparency logRelease files / foldmetrics-0.2.0-py3-none-any.whl
| Download URL | foldmetrics-0.2.0-py3-none-any.whl |
|---|---|
| Size | 83.1 kB |
| Tags | Python 3 |
|
SHA-256 checksum How to use checksums |
9614b596bc6bc336ce05feab22cd84708d0776ab18cc97aba897baf1cdce15b6
|
|
BLAKE2b-256 checksum How to use checksums |
23b95baba6f98c674b7bb8a76ded7973c1215a0ef7d893cc845ab6c855da81a3
|
| Upload date | |
|
Uploaded using Trusted Publishing? What is trusted publishing? |
Yes |
| Uploaded via |
twine/7.0.0 CPython/3.13.14
|
Provenance
Provenance describes where a file came from. On PyPI, provenance is shared via attestations, which provide a verifiable record of the build or publishing details. View details, limitations and caveats.
PyPI Publish Attestation
PyPI verified that this artifact, at this checksum, originated from the publisher listed below.
Signed by GitHub Actions, verified by PyPI on Sep 11, 2026.
Transparency log













