A GNSS reflectometry software package

Project description
gnssrefl
github version: 1.1.5 

WARNING: All access to UNAVCO data will end October 1, 2022 unless you sign up for an account there
WARNING: CDDIS has changed their high-rate directory protocol. This means some of our download codes now fail. If someone wants to provide a pull request that addresses this issue, I would be happy to implement it. I am not willing to write such code myself.
Table of Contents
- Installation
- Understanding the Code
- Products:
- Examples
- Utilities
- News/Bugs/Future Work
- Publications
- How can you help this project? How can you ask for help?
Understanding
gnssrefl is an open source/python version of my GNSS interferometric reflectometry (GNSS-IR) code.
If you would like to try out reflectometry without installing the code
I recommend you use this web app. It can show you representative results with minimal constraints. It should provide results in less than 10 seconds.
If you prefer Matlab
I had a working matlab version on github, but I will not be updating it. You will very likely have to make changes to accommodate the recent change in security protocols at CDDIS.
Goals
The goal of the gnssrefl python repository is to help you compute (and evaluate) GNSS-based reflectometry parameters using geodetic data. This method is often called GNSS-IR, or GNSS Interferometric Reflectometry. There are three main modules:
-
rinex2snr translates RINEX files into SNR files needed for analysis.
-
gnssir computes reflector heights (RH) from SNR files.
-
quickLook gives you a quick (visual) assessment of a file without dealing with the details associated with gnssir. It is not meant to be used for routine analysis. It also helps you pick an appropriate azimtuh mask and quality control settings.
There are also various utilities you might find to be useful. If you are unsure about why various restrictions are being applied, it is really useful to read Roesler and Larson (2018) or similar. You can also watch some background videos on GNSS-IR at youtube.
Philosophy
In geodesy, you don't really need to know much about what you are doing to calculate a reasonably precise position from GPS data. That's just the way it is. (Note: that is also thanks to the hard work of the geodesists that wrote the computer codes). For GPS/GNSS reflections, you need to know a little bit more - like what are you trying to do? Are you trying to measure water levels? Then you need to know where the water is! (with respect to your antenna, i.e. which azimuths are good and which are bad). Another application of this code is to measure snow accumulation. If you have a bunch of obstructions near your antenna, you are responsible for knowing not to use that region. If your antenna is 10 meters above the reflection area, and the software default only computes answers up to 6 meters, the code will not tell you anything useful. It is up to you to know what is best for the site and modify the inputs accordingly. I encourage you to get to know your site. If it belongs to you, look at photographs. If you can't find photographs, use Google Earth. You can also try using my google maps web app interface.
Overview
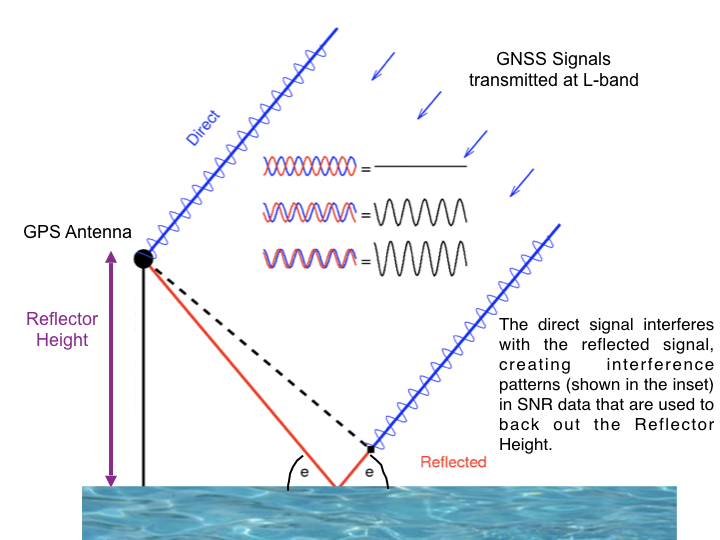
To summarize, direct (blue) and reflected (red) GNSS signals interfere and create an interference pattern that can be observed in GNSS Signal to Noise Ratio (SNR) data as a satellite rises or sets. The frequency of this interference pattern is directly related to the height of the GNSS antenna phase center above the reflecting surface, or reflector height RH (purple). The primary goal of this software is to measure RH. This parameter is directly related to changes in snow height and water levels below a GNSS antenna. This is why GNSS-IR can be used as a snow sensor and tide gauge. GNSS-IR can also be used to measure soil moisture, but the code to estimate soil moisture is not as strongly related to RH as snow and water. We will be posting the code you need to measure soil moisture later in the year.
This code is meant to be used with Signal to Noise Ratio (SNR) data. This is a SNR sample for a site in the the northern hemisphere (Colorado) and a single GPS satellite. The SNR data are plotted with respect to time - however, we have also highlighted in red the data where elevation angles are less than 25 degrees. These are the data used in GNSS Interferomertric Reflectometry GNSS-IR. You can also see that there is an overall smooth polynomial signature in the SNR data. This represents the dual effects of the satellite power transmission level and the antenna gain pattern. We aren't interested in that so we will be removing it with a low order polynomial (and we will convert to linear units on y-axis).

After that polynomial is removed, we will concentrate on the rising and setting satellite arcs. That is the red parts on the left and right.
Below you can see those next two steps. On the top is the "straightened" SNR data. Instead of time, it is plotted with respect to sine of the elevation angle. It was shown a long time ago by Penina Axelrad that the frequency extracted from these data is representative of the reflector height. Here a periodogram was used to extract this frequency, and that is shown below, with the x-axis units changed to reflector height. In a nutshell, that is what this code does. It figures out the rising and setting satellite arcs in all the azimuth regions you have said are acceptable. It does a simple analysis (removes the polynomial, changes units) and uses a periodogram to look at the frequency content of the data. You only want to report RH when you think the peak on the periodogram is significant. There are many ways to do this - we only use two quality control metrics:
-
is the peak larger than a user-defined value (amplitude of the dominant peak in your periodogram)
-
is the peak divided by a "noise" metric larger than a user-defined value. The code calls this the peak2noise.

The Colorado SNR example is for a fairly planar field where the RH for the rising and setting arc should be very close to the same name. What does the SNR data look like for a more extreme case? Shown below is the SNR data for Peterson Bay, where the rising arc (at low tide) has a very different frequency than during the setting arc (high tide). This gives you an idea of how the code can be used to measure tides.

A couple common sense issues: one is that since you define the noise region, if you make it really large, that will artificially make the peak2noise ratio larger. I have generally used a region of 6-8 meters for this calculation. So in the figure above the region was for 0-6 meters. The amplitude can be tricky because some receivers report low SNR values, which then leads to lower amplitudes. The default amplitude values are for the most commonly used signals in GNSS-IR (L1, L2C, L5, Glonass, Galileo, Beidou). The L2P data used by geodesists are generally not useable for reasons to be discussed later.
Even though we analyze the data as a function of sine of elevation angle, each satellite arc is associated with a specific time period. The code keeps track of that and reports it in the final answers. It also keeps track of the average azimuth for each rising and setting satellite arc that passes quality control tests.
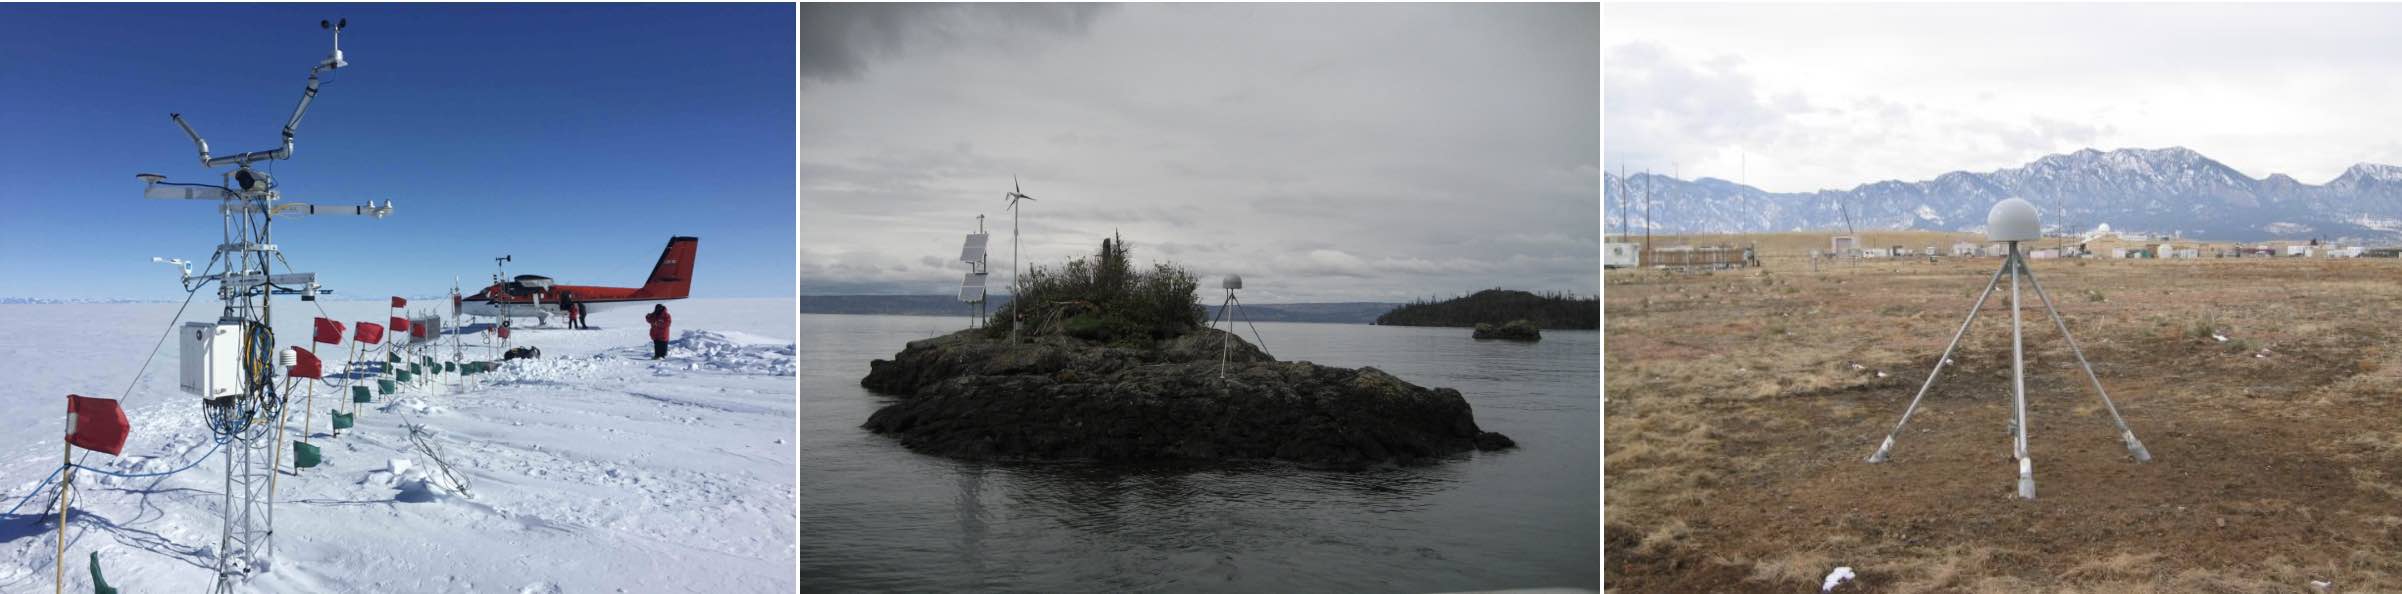
What do these satellite reflection zones look like? Below are photographs and reflection zone maps for two standard GNSS-IR sites, one in the northern hemisphere and one in the southern hemisphere.
| Mitchell, Queensland, Australia | Portales, New Mexico, USA |
|---|---|
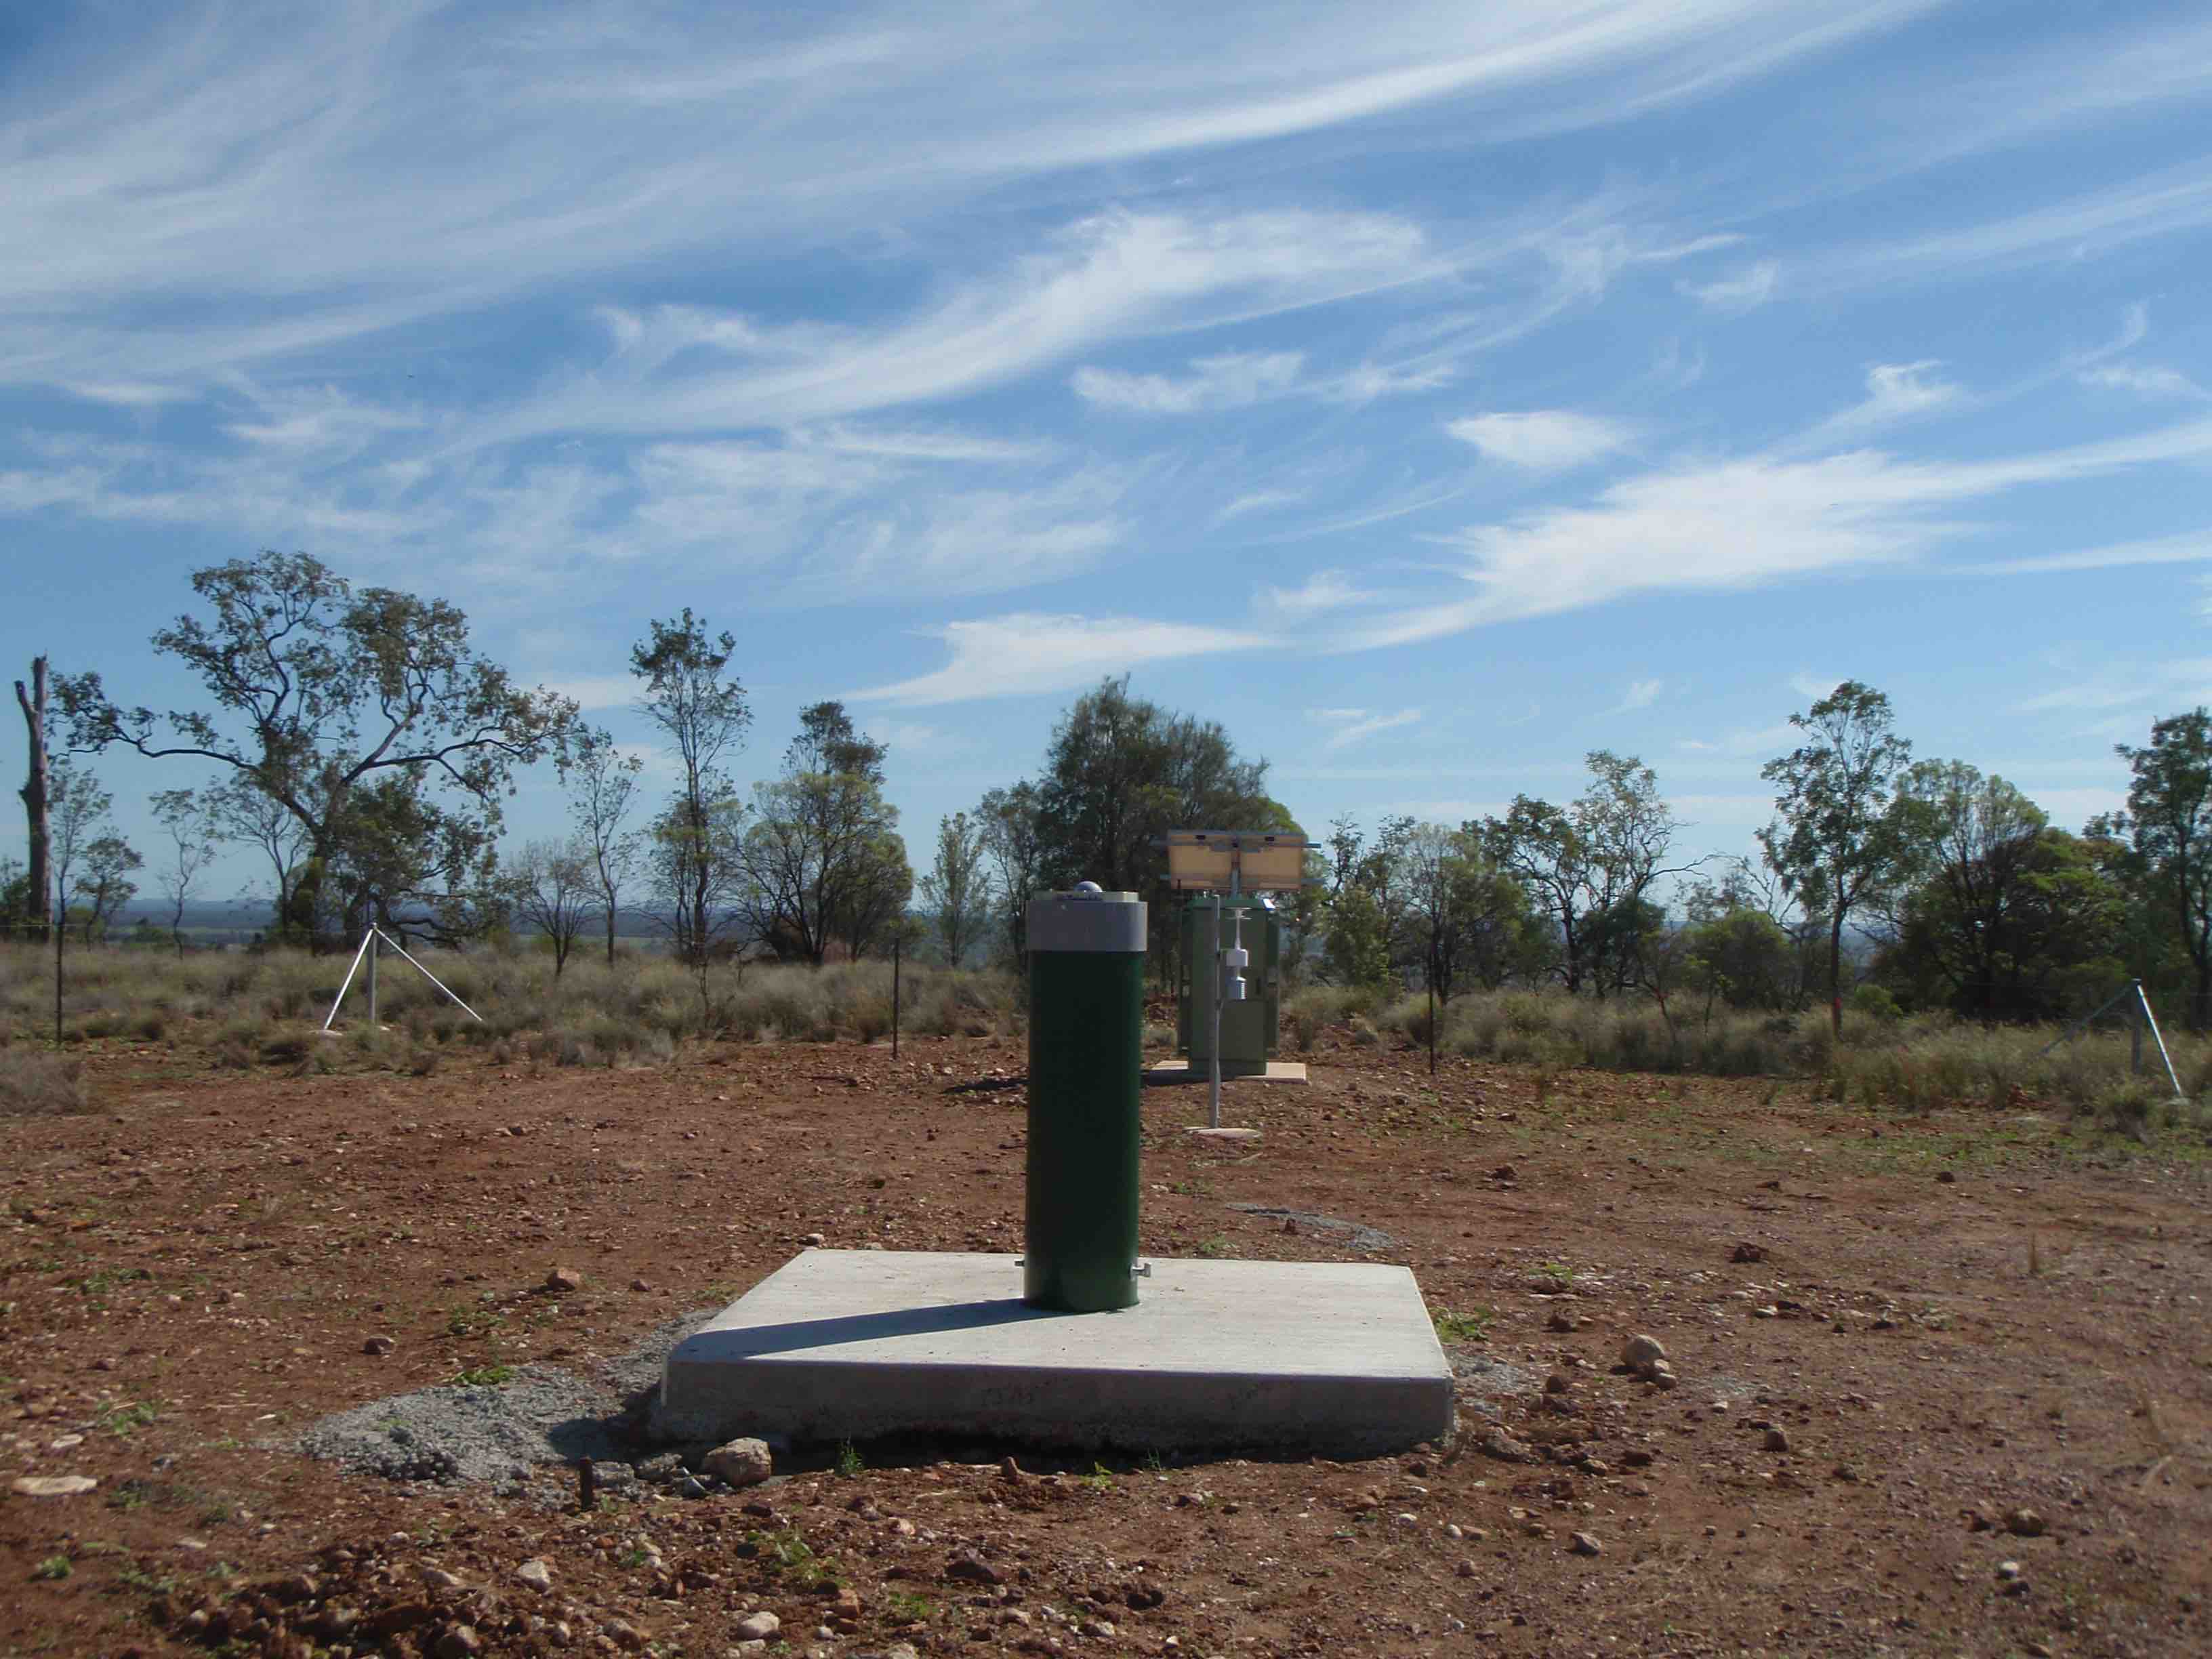 |
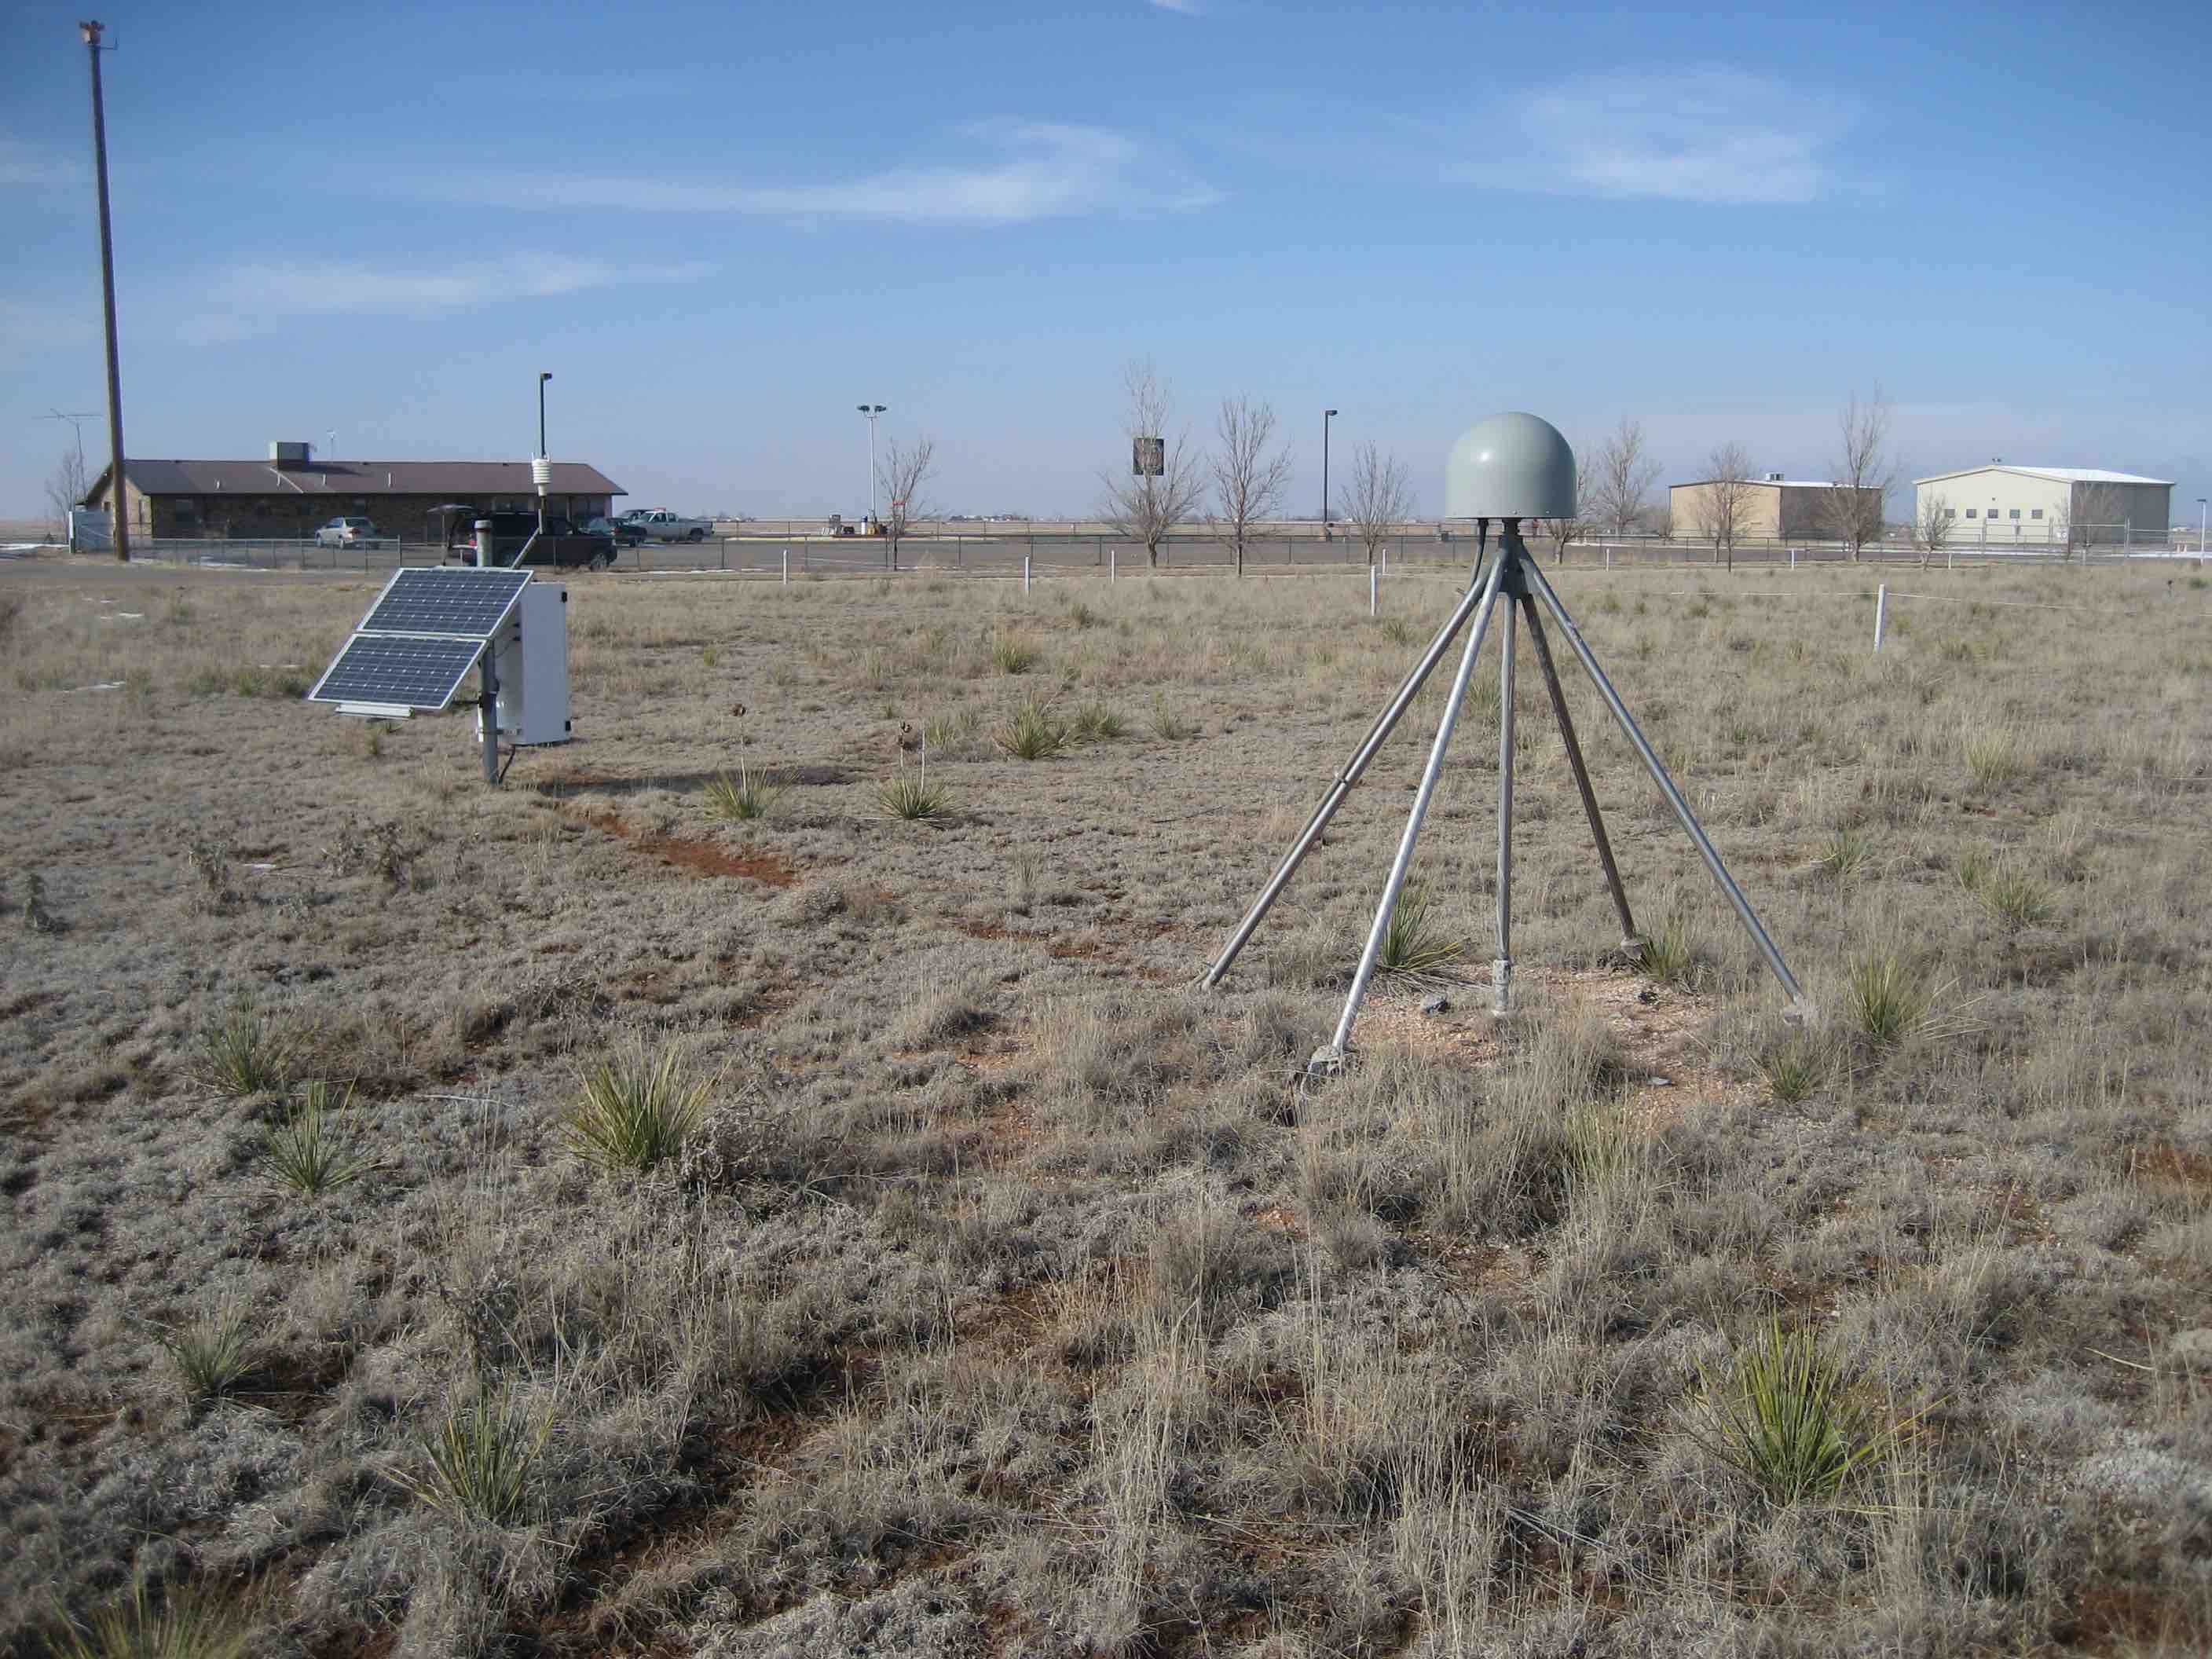 |

|  |
Now let's look at a more complex case, station ross on Lake Superior. Here the goal
is to measure water level. The map image (panel A) makes it clear
that unlike Mitchell and Portales, we cannot use all azimuths to measure the lake. To understand our reflection
zones, we need to know the approximate lake level. That is a bit tricky to know, but the
photograph (panel B) suggests it is more than the 2 meters we used at Portales -
but not too tall. We will try 4 meters and then check later to make sure that was a good assumption.
A.  Map view of station ROSS |
B. 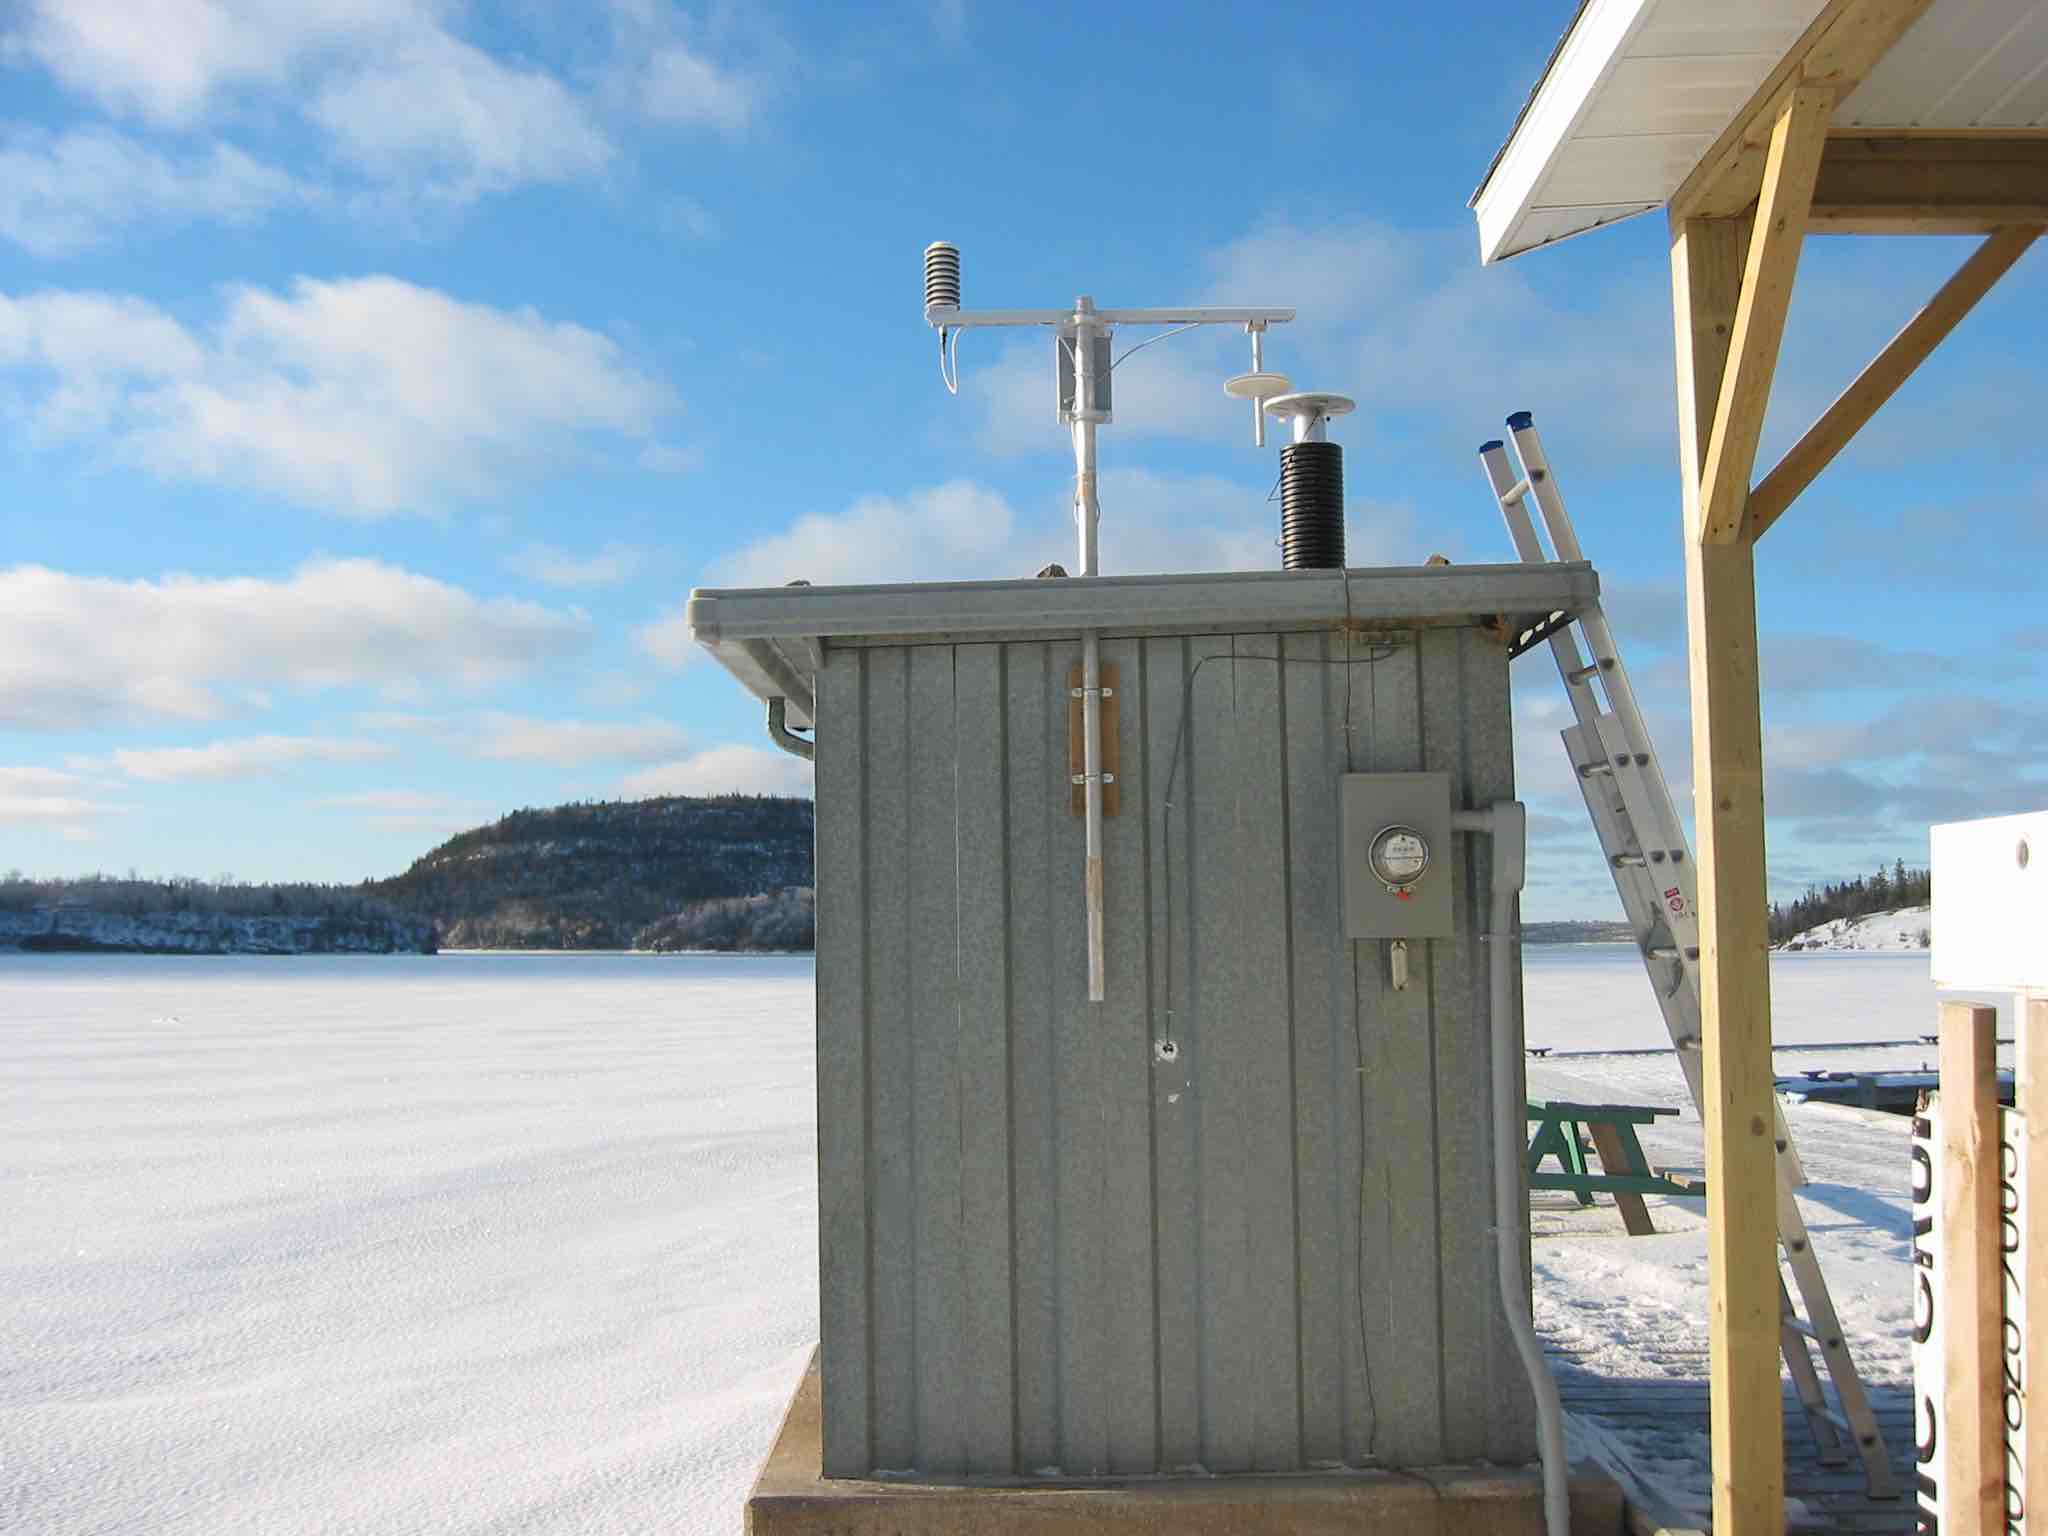 Photograph of station ROSS |
C.  Reflection zones for GPS satellites at elevation angles of 5-25 degrees for a reflector height of 4 meters. |
D.  Reflection zones for GPS satellites at elevation angles of 5-15 degrees for a reflector height of 4 meters. |
Again using the reflection zone web app, we can plot up the appropriate reflection zones for various options.
Since ross has been around a long time, http://gnss-reflections.org has its coordinates in a
database. You can just plug in ross for the station name and leave
latitude/longitude/height blank. You do need to plug in a RH of 4 since mean
sea level would not be an appropriate reflector height value for this
case. Start out with an azimuth range of 90 to 180 degrees.
Using 5-25 degree elevation angles (panel C) looks like it won't quite work - and going all the way to 180 degrees
in azimuth also looks it will be problematic. Panel D shows a smaller elevation angle range (5-15) and cuts
off azimuths at 160. These choices appear to be better than those from Panel C.
It is also worth noting that the GPS antenna has been attached to a pier -
and boats dock at piers. You might very well see outliers at this site when a boat is docked at the pier.
Once you have the code set up, it is important that you check the quality of data. This will also
allow you to check on your assumptions, such as the appropriate azimuth and elevation angle
mask and reflector height range. This is one of the reasons quickLook was developed.
Utilities
download_rinex can be useful if you want to
download RINEX v2.11 or 3 files (using the version flag) without using
the reflection-specific codes. As with rinex2snr, the default archive is
to check unavco, sopac, and sonel in that order. For other archives, you must specify their name.
For a listing of supported archives, please see the documentation for rinex2snr.
Sample calls:
-
download_rinex p041 2020 6 1downloads the RINEX 2.11 data from June 1, 2020 -
download_rinex p041 2020 150 0downloads the data from day of year 150 in 2020 -
download_rinex p041 2020 150 0 -archive sopacdownloads the data from sopac archive on day of year 150 in 2020 -
download_rinex onsa00swe 2020 150 0 -archive cddisdownloads the RINEX 3 data from the cddis archive on day of year 150 in 2020
download_orbits downloads orbit files and stores them in $ORBITS. The list of orbits
we support changes regularly. Please see the rinex2snr documentation.
ymd translates year,month,day to day of year
ydoy translates year,day of year to month and day
llh2xyz translates latitude (deg), longitude (deg), and ellipsoidal ht (m) to X, Y, Z (m)
xyz2llh translates Cartesian coordinates (meters) to latitude (deg), longitude (deg), ellipsoidal height (m)
gpsweek translates year, month, day into GPS week, day of week (0-6)
download_unr downloads ENV time series for GPS sites from the Nevada Reno website (IGS14), so ITRF 2014. Input is
four character station name. Lowercase.
download_tides downloads up to a month of NOAA tide
gauge data given a station number (7 characters), and begin/end dates, e.g.
20150601 would be June 1, 2015. The NOAA API works perfectly well for this,
but this utility writes out a file with only columns of
numbers (or csv if you prefer). To implement the latter, use csv as the ending
of your output filename.
This can also be called as download_noaa; there is an optional plot produced with -plt T.
download_psmsl downloads sealevel files from the
Permanent Service for Mean Sea Level.
Input is the station name. Ouput can be plain txt of csv. To implement the
latter, use csv as the ending of your output filename. Optional plot to the screen if -plt is set to T.
download_ioc downloads up to a month of tide gauge records from the
IOC website. Requires beginning and
ending date (yyyymmdd format) and is limited by the IOC to 30 days. Optional output filename allowed.
If the output file ends in csv, it writes a csv file instead of plain text.
You can pick the sensor type or you will get all of them.
There is an optional plot produced with -plt T.
query_unr returns latitude, longitude, and ellipsoidal height and Cartesian position
for stations that were in the Nevada Reno database as of October 2021. Coordinates are now more precise
than they were originally (UNR used to provide four decimal points in lat/long).
check_rinex returns simple information from the file header, such as receiver
and antenna type, receiver coordinates, and whether SNR data are in the file. RINEX 2.11 only
prn2gps will try to tell you which PRN numbers are associated with which SVN (or GPS) numbers
for a given day, as in prn2gps 2021-01-01.
It uses the public JPL translation file, so if that file
is no good, the translation will also be no good.
GNSS-IR Community
We need help to maintain and improve this code. How can you help?
-
Archives are constantly changing their file transfer protocols. If you find one in
gnssreflthat doesn't work anymore, please fix it and let us know. Please test that it works for both older and newer data. -
If you would like to add an archive, please do so. Use the existing code in gps.py as a starting point.
-
We need better models for GNSS-IR far more than we need more journal articles finding that the method works. And we need these models to be in python.
-
I would like to add a significant wave height calculation to this code. If you have such code that works on fitting the spectrum computed with detrended SNR data, please consider contributing it.
-
If you have a better refraction correction than we are using, please provide it to us as a function in python.
-
Write up a new use case.
-
Investigate surface related biases for polar tide gauge calculations (ice vs water).
-
I have ported NOCtide.m and will add it here when I get a chance.
How to get help with your gnssrefl questions?
If you are new to the software, you should consider watching the videos about GNSS-IR
Before you ask for help - a few things to ask yourself:
Are you running the current software?
-
gnssrefl command line
git pull -
gnssrefl docker command line
docker pull unavdocker/gnssrefl -
gnssrefl jupyter notebook
git pull -
gnssrefl jupyter notebook docker
docker pull unavdocker/gnssrefl_jupyter
You are encouraged to submit your concerns as an issue to the github repository. If you are unfamiliar with github, you can also email Kelly (enloe@unavco.org ) about Jupyter NoteBooks or Tim (dittmann@unavco.org) for commandline/docker issues.
Please
-
include the exact command or section of code you were running that prompted your question.
-
Include details such as the error message or behavior you are getting. Please copy and paste (this is preferred over a screenshot) the error string. If the string is long - please post the error string in a thread response to your question.
-
Please include the operating system of your computer.
Please wait - We are confirming whether this information is correct.
Would you like to join our gnssrefl users email list?
Send an email to gnss-ir-request@postal.unavco.org and put the word
subscribe (or unsubscribe to leave) in your email subject.
Acknowledgements
- Radon Rosborough helped with python/packaging questions and improved our docker distribution.
- Naoya Kadota added the GSI data archive.
- Joakim Strandberg provided python RINEX translators.
- Johannes Boehm provided source code for the refraction correction.
- At UNAVCO, Kelly Enloe made Jupyter notebooks and Tim Dittmann made docker builds.
- Makan Karegar added the NMEA capability.
- Dave Purnell provided his inversion code, which is now running in the
invsnrcapability. - Carolyn Roesler helped with the original Matlab codes.
- Felipe Nievinski and Simon Williams have provided significant advice for this project.
- Clara Chew and Eric Small developed the soil moisture algorithm; I ported it to python with Kelly's help.
Kristine M. Larson
GNSS-IR was developed with funding from NSF (ATM 0740515, EAR 0948957, AGS 0935725, EAR 1144221, AGS 1449554) and
NASA (NNX12AK21G and NNX13AF43G). gnssrefl was developed with support from NASA (80NSSC20K1731).
This documentation was updated on September 10, 2022
File structure for station abcd in the year YYYY (last two characters YY), doy DDD:
-
REFL_CODE/input/abcd.json - instructions for gnssir analysis, refraction files
-
REFL_CODE/YYYY/snr/abcd/abcdDDD0.YY.snr66 - SNR files
-
REFL_CODE/YYYY/results/abcd/DDD.txt Lomb Scargle analysis
-
REFL_CODE/YYYY/phase/abcd/DDD.txt phase analysis
-
REFL_CODE/Files/ - various output files and plots will be placed here
-
ORBITS/YYYY/nav/autoDDD0.YYn - GPS broadcast orbit file
-
ORBITS/YYYY/sp3/ - sp3 files of orbits - these use names from the archives.
RINEX files are not stored by this code. In fact, quite the opposite. If they are being translated, they are deleted. Do not keep your only copy of RINEX files in your default directory.
Release history Release notifications | RSS feed


Download files
Download the file for your platform. If you're not sure which to choose, learn more about installing packages.
Source Distribution
Built Distribution
Filter files by name, interpreter, ABI, and platform.
If you're not sure about the file name format, learn more about wheel file names.
Copy a direct link to the current filters
File details
Details for the file gnssrefl-1.1.6.tar.gz.
File metadata
- Download URL: gnssrefl-1.1.6.tar.gz
- Upload date:
- Size: 8.9 MB
- Tags: Source
- Uploaded using Trusted Publishing? No
- Uploaded via: twine/3.8.0 pkginfo/1.8.2 readme-renderer/34.0 requests/2.27.1 requests-toolbelt/0.9.1 urllib3/1.26.8 tqdm/4.63.1 importlib-metadata/4.11.3 keyring/23.5.0 rfc3986/2.0.0 colorama/0.4.4 CPython/3.9.13
File hashes
| Algorithm | Hash digest | |
|---|---|---|
| SHA256 |
5c926822aa1428e5334d1a5ead7da2cf9aaa119923417242e44c99f0b79c45a5
|
|
| MD5 |
17b50b67752e6594d4e9dae29efc8e8a
|
|
| BLAKE2b-256 |
07f1f64cdfd7a3dfbe575f882a49e4424f40c2a4ee4e07551a22e958cc843acf
|
File details
Details for the file gnssrefl-1.1.6-cp39-cp39-macosx_12_0_arm64.whl.
File metadata
- Download URL: gnssrefl-1.1.6-cp39-cp39-macosx_12_0_arm64.whl
- Upload date:
- Size: 405.1 kB
- Tags: CPython 3.9, macOS 12.0+ ARM64
- Uploaded using Trusted Publishing? No
- Uploaded via: twine/3.8.0 pkginfo/1.8.2 readme-renderer/34.0 requests/2.27.1 requests-toolbelt/0.9.1 urllib3/1.26.8 tqdm/4.63.1 importlib-metadata/4.11.3 keyring/23.5.0 rfc3986/2.0.0 colorama/0.4.4 CPython/3.9.13
File hashes
| Algorithm | Hash digest | |
|---|---|---|
| SHA256 |
cbec75df13a461e588b75fd99e04d1d7bd78a2e403cc0bbf2b8702a9a400813e
|
|
| MD5 |
9e31594c9fc03af07de64068accd0cdb
|
|
| BLAKE2b-256 |
c6095b31d628741acdbc510b8c1f55242a8b2e00b0d39278057699160f149900
|


