A graph maker for computational geometry and network visualization

Project description
Graphizy


A powerful graph maker for computational geometry and network visualization, you can choose from multiple graph types analyse their metrics in real time, and construct memory-enhanced graph for interaction monitoring.
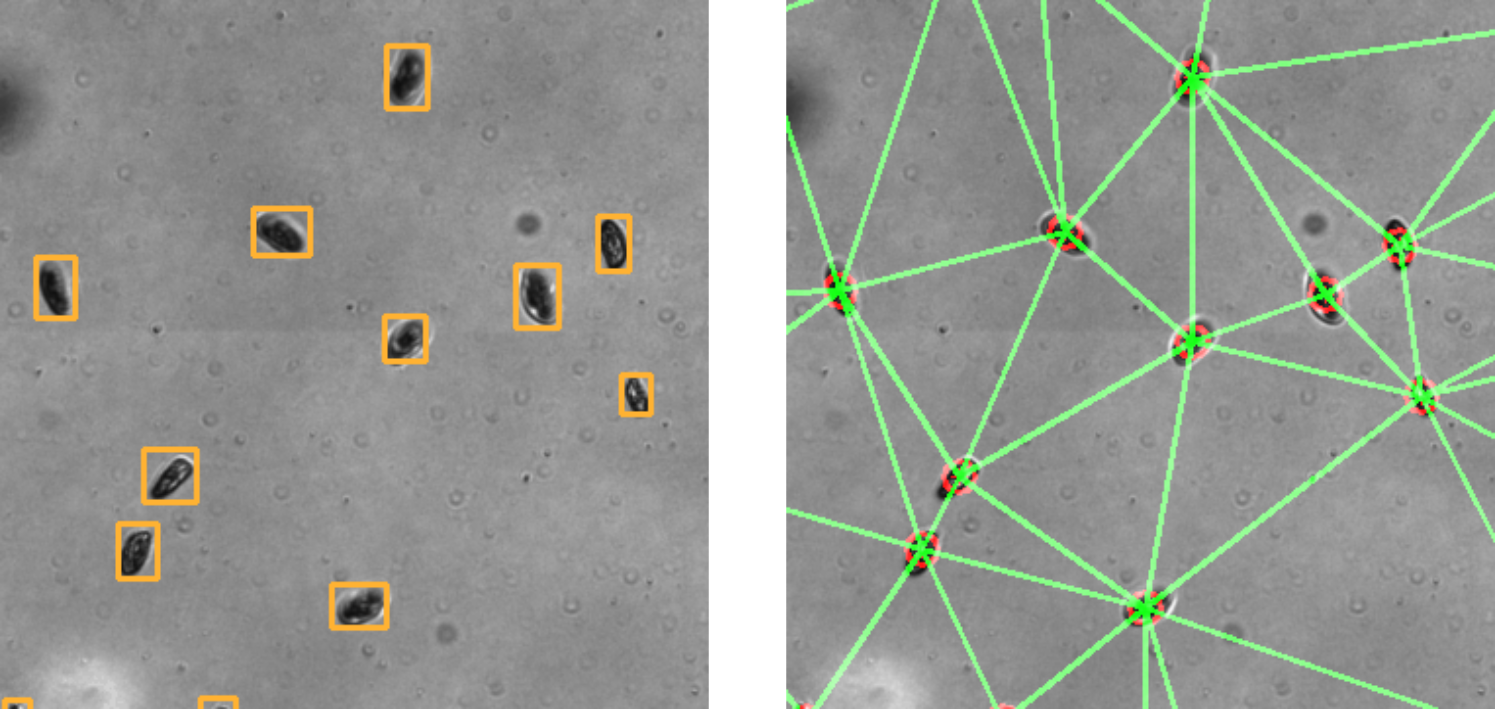
Figure: Positions of Paramecium are converted to graphs in just a few milliseconds for hundreds of individuals using OpenCV for construction and Igraph for analysis. Graph analytics are accessible in real time by interfacing with igraph.
Documentation
You can find the full documentation here.
Key Features
Graph Construction Types
- Delaunay Triangulation: Optimal triangular meshes from point sets
- Proximity Graphs: Connect nearby points based on distance thresholds
- K-Nearest Neighbors: Connect each point to its k closest neighbors
- Minimum Spanning Tree: Minimal connected graph with shortest total edge length
- Gabriel Graph: Geometric proximity graph (subset of Delaunay triangulation)
Memory-Enhanced Graphs
- **Connection tracking **: Any graph can keep edges in memory for some times
Graph Analysis
- igraph Integration: Full access to igraph's powerful analytics
- Comprehensive API: Call any igraph method with error handling
- Real-time Statistics: Vertex count, edge count, connectivity, clustering, centrality
Visualization & Design
- Flexible Configuration: Runtime-configurable parameters using dataclasses
- Multiple Output Formats: Save as images or display interactively with OpenCV
- Memory Visualization: Age-based edge coloring for temporal analysis
- Command Line Interface: Easy-to-use CLI for common operations
- Interactive Demos: Real-time Brownian motion simulation with graph evolution
Technical Excellence
- Robust Error Handling: Detailed exceptions and validation
- Performance Monitoring: Built-in timing and optimization tracking
- Memory Management: Configurable connection history with aging
- Type Safety: Full type hints and dataclass configuration
🚀 Installation
pip install graphizy
Or for development:
git clone https://github.com/cfosseprez/graphizy.git
cd graphizy
pip install -e .
⚡ Quick Start
Basic Graph Creation
import numpy as np
from graphizy import Graphing, GraphizyConfig, generate_positions

# Generate random points
positions = generate_positions(800, 800, 100)
particle_ids = np.arange(len(positions))
data = np.column_stack((particle_ids, positions))

# Create grapher with configuration
config = GraphizyConfig()
config.graph.dimension = (800, 800)
grapher = Graphing(config=config)

# Create different graph types
delaunay_graph = grapher.make_delaunay(data)
proximity_graph = grapher.make_proximity(data, proximity_thresh=50.0)
knn_graph = grapher.make_knn(data, k=4)  # Connect to 4 nearest neighbors
mst_graph = grapher.make_mst(data)       # Minimum spanning tree
gabriel_graph = grapher.make_gabriel(data)  # Gabriel graph

# Visualize and save
delaunay_image = grapher.draw_graph(delaunay_graph)
grapher.save_graph(delaunay_image, "delaunay.jpg")
# Or display interactively
grapher.show_graph(delaunay_image, "Delaunay Triangulation")

# Get comprehensive statistics
info = grapher.get_graph_info(delaunay_graph)
print(f"Graph: {info['vertex_count']} vertices, {info['edge_count']} edges")
print(f"Density: {info['density']:.3f}, Connected: {info['is_connected']}")
🧠 Memory-Enhanced Graphs
Memory graphs track connections over time, allowing analysis of temporal patterns:
# Initialize memory manager
grapher.init_memory_manager(max_memory_size=50, track_edge_ages=True)

# Simulate evolution over time
for iteration in range(100):
    # Update positions (e.g., particle movement)
    data[:, 1:3] += np.random.normal(0, 2, (len(data), 2))

    # Create current graph and update memory
    current_graph = grapher.make_proximity(data, proximity_thresh=60.0)
    grapher.update_memory_with_graph(current_graph)

    # Create memory-enhanced graph (current + historical connections)
    memory_graph = grapher.make_memory_graph(data)

    # Visualize with age-based coloring
    if iteration % 10 == 0:
        memory_image = grapher.draw_memory_graph(
            memory_graph,
            use_age_colors=True,  # Older connections fade out
            alpha_range=(0.3, 1.0)
        )
        grapher.save_graph(memory_image, f"memory_frame_{iteration:03d}.jpg")

# Get memory statistics
stats = grapher.get_memory_stats()
print(f"Memory contains {stats['total_connections']} historical connections")
print(f"Average edge age: {stats['edge_age_stats']['avg_age']:.1f} iterations")
Graph Types Comparison
| Graph Type | Connectivity | Edge Count | Use Case | Memory Compatible |
|---|---|---|---|---|
| Proximity | Variable | ~distance² | Local neighborhoods | ✅ |
| Delaunay | Always | ~3n | Natural triangulation | ✅ |
| K-NN | Variable | k×n | Fixed degree networks | ✅ |
| MST | Always | n-1 | Minimal connectivity | ✅ |
| Gabriel | Variable | Subset of Delaunay | Geometric proximity | ✅ |
| Memory | Variable | Historical | Temporal analysis | - |
🎮 Interactive Demo
Experience real-time graph evolution with the interactive Brownian motion simulator:
# Basic proximity graph simulation
python examples/improved_brownian.py 1

# Delaunay triangulation with memory tracking
python examples/improved_brownian.py 2 --memory

# Minimum spanning tree evolution
python examples/improved_brownian.py 4 --memory --particles 100

# Compare all graph types side-by-side
python examples/improved_brownian.py 5 --memory

# Interactive controls:
# ESC - Exit, SPACE - Pause, R - Reset, M - Toggle memory
# 1-5 - Switch graph types, +/- - Adjust memory size
⚙️ Configuration
Graphizy uses dataclasses for type-safe, runtime-configurable parameters:
from graphizy import GraphizyConfig

# Create and customize configuration
config = GraphizyConfig()

# Drawing configuration
config.drawing.line_color = (255, 0, 0)  # Red lines (B, G, R)
config.drawing.point_color = (0, 255, 255)  # Yellow points
config.drawing.line_thickness = 3
config.drawing.point_radius = 12

# Graph configuration
config.graph.dimension = (1200, 800)
config.graph.proximity_threshold = 75.0
config.graph.distance_metric = "euclidean"  # or "manhattan", "chebyshev"

# Memory configuration
config.memory.max_memory_size = 100
config.memory.auto_update_from_proximity = True

# Create grapher with custom config
grapher = Graphing(config=config)

# Runtime configuration updates
grapher.update_config(
    drawing={"line_thickness": 5},
    graph={"proximity_threshold": 100.0}
)
Advanced Analysis
Graph Metrics and Centrality
# Basic graph properties
info = grapher.get_graph_info(graph)
print(f"Density: {info['density']:.3f}")
print(f"Average path length: {info['average_path_length']:.2f}")
print(f"Clustering coefficient: {info['transitivity']:.3f}")

# Node centrality measures
degree_centrality = grapher.call_method(graph, 'degree')
betweenness = grapher.call_method(graph, 'betweenness')
closeness = grapher.call_method(graph, 'closeness')

# Find most central nodes
central_nodes = sorted(betweenness.items(), key=lambda x: x[1], reverse=True)[:5]
print(f"Top 5 central nodes: {central_nodes}")

# Direct igraph access for advanced analysis
components = grapher.call_method_raw(graph, 'connected_components')
diameter = grapher.call_method_raw(graph, 'diameter')
Custom Graph Types
# Create custom connection function
def create_distance_band_graph(positions, inner_radius=30, outer_radius=80):
    """Connect points within a distance band (ring)"""
    from scipy.spatial.distance import pdist, squareform

    graph = grapher.make_proximity(positions, proximity_thresh=float('inf'))
    graph.delete_edges(graph.es)  # Start empty

    distances = squareform(pdist(positions[:, 1:3]))
    edges = []

    for i in range(len(positions)):
        for j in range(i+1, len(positions)):
            dist = distances[i, j]
            if inner_radius <= dist <= outer_radius:
                edges.append((i, j))

    if edges:
        graph.add_edges(edges)
    return graph

# Use with memory system
custom_graph = create_distance_band_graph(data, 40, 100)
grapher.update_memory_with_graph(custom_graph)
📚 API Reference
Main Classes
Graphing: Primary interface for graph creation and analysisGraphizyConfig: Type-safe configuration managementMemoryManager: Historical connection trackingDataInterface: Flexible data format handling
Graph Creation Methods
make_delaunay(data): Delaunay triangulationmake_proximity(data, proximity_thresh, metric): Distance-based connectionsmake_knn(data, k): K-nearest neighbors (requires scipy)make_mst(data, metric): Minimum spanning treemake_gabriel(data): Gabriel graphmake_memory_graph(data): Memory-enhanced graph
Memory Management
init_memory_manager(max_size, max_iterations, track_ages): Initialize memoryupdate_memory_with_graph(graph): Add graph connections to memoryupdate_memory_with_proximity(data, threshold): Add proximity connectionsget_memory_stats(): Memory usage statistics
Visualization
draw_graph(graph, radius, thickness): Standard graph drawingdraw_memory_graph(graph, use_age_colors, alpha_range): Memory visualizationshow_graph(image, title): Interactive displaysave_graph(image, filename): Save to file
Examples
Batch Analysis
# Analyze multiple datasets
results = []
for size in [50, 100, 200, 500]:
    positions = generate_positions(800, 800, size)
    data = np.column_stack((np.arange(size), positions))

    # Compare graph types
    for graph_type, create_func in [
        ('delaunay', lambda d: grapher.make_delaunay(d)),
        ('proximity', lambda d: grapher.make_proximity(d, 60)),
        ('mst', lambda d: grapher.make_mst(d)),
        ('gabriel', lambda d: grapher.make_gabriel(d))
    ]:
        graph = create_func(data)
        info = grapher.get_graph_info(graph)
        results.append({
            'size': size,
            'type': graph_type,
            'density': info['density'],
            'avg_path_length': info['average_path_length']
        })

# Analyze results
import pandas as pd
df = pd.DataFrame(results)
print(df.groupby('type')['density'].mean())
Time Series Analysis
# Track graph evolution over time
time_series = []
grapher.init_memory_manager(max_memory_size=200)

for t in range(500):
    # Simulate system evolution
    data[:, 1:3] += np.random.normal(0, 1, (len(data), 2))

    # Create snapshot
    current_graph = grapher.make_delaunay(data)
    grapher.update_memory_with_graph(current_graph)

    # Record metrics
    info = grapher.get_graph_info(current_graph)
    memory_stats = grapher.get_memory_stats()

    time_series.append({
        'time': t,
        'current_edges': info['edge_count'],
        'memory_edges': memory_stats['total_connections'],
        'clustering': info['transitivity']
    })

# Visualize time series
import matplotlib.pyplot as plt
ts_df = pd.DataFrame(time_series)
ts_df.plot(x='time', y=['current_edges', 'memory_edges'])
plt.title('Graph Evolution Over Time')
plt.show()
🔧 Development
Requirements
- Python >= 3.8
- NumPy >= 1.20.0
- OpenCV >= 4.5.0
- python-igraph >= 0.9.0
- SciPy >= 1.7.0 (for KNN and MST)
Running Tests
# Install development dependencies
pip install pytest pytest-cov black flake8

# Run tests with coverage
pytest tests/ --cov=graphizy --cov-report=html

# Test specific functionality
python test_mst.py          # Test MST functionality
python test_fixes.py        # Test configuration fixes
Code Quality
# Format code
black src/

# Lint code
flake8 src/

# Type checking (if mypy installed)
mypy src/graphizy/
📄 License
GPL-2.0-or-later License - see LICENSE file for details.
🤝 Contributing
- Fork the repository
- Create a feature branch (
git checkout -b feature/amazing-feature) - Add tests for new functionality
- Ensure all tests pass (
pytest tests/) - Commit changes (
git commit -m 'Add amazing feature') - Push to branch (
git push origin feature/amazing-feature) - Open a Pull Request
Author
Charles Fosseprez
Email: charles.fosseprez.pro@gmail.com
GitHub: @cfosseprez
📈 Changelog
v0.1.5 (Current)
- Added Minimum Spanning Tree (MST) graph type
- Added K-Nearest Neighbors (KNN) graph type
- Enhanced memory system with age-based visualization
- Interactive Brownian motion simulator
- Fixed configuration initialization issues
- Comprehensive documentation improvements
- Added MST and memory functionality tests
Built with ❤️ for computational geometry and network analysis
Release history Release notifications | RSS feed


Download files
Download the file for your platform. If you're not sure which to choose, learn more about installing packages.
Source Distribution
Built Distribution
Filter files by name, interpreter, ABI, and platform.
If you're not sure about the file name format, learn more about wheel file names.
Copy a direct link to the current filters
File details
Details for the file graphizy-0.1.10.tar.gz.
File metadata
- Download URL: graphizy-0.1.10.tar.gz
- Upload date:
- Size: 78.8 kB
- Tags: Source
- Uploaded using Trusted Publishing? No
- Uploaded via: poetry/2.1.3 CPython/3.9.13 Windows/10
File hashes
| Algorithm | Hash digest | |
|---|---|---|
| SHA256 |
0a5a71d8f40e01b9eeab1248ced741cc9eef9580b7a9a21866bfdd281d42bde1
|
|
| MD5 |
7a70e596668fadab80009fb2fc514d8c
|
|
| BLAKE2b-256 |
da02c0dfee21dfd05f395fc5a6523472e9d0ad93d42b9857fd36a44714c9f6dd
|
File details
Details for the file graphizy-0.1.10-py3-none-any.whl.
File metadata
- Download URL: graphizy-0.1.10-py3-none-any.whl
- Upload date:
- Size: 53.5 kB
- Tags: Python 3
- Uploaded using Trusted Publishing? No
- Uploaded via: poetry/2.1.3 CPython/3.9.13 Windows/10
File hashes
| Algorithm | Hash digest | |
|---|---|---|
| SHA256 |
651e18042895df9fa7a3bd2c2656118947c9e57680878efe8d650e4b21402c7e
|
|
| MD5 |
4ebb3be82a3875d73c2be23fae8c9777
|
|
| BLAKE2b-256 |
edcd045d20697b307e9f9270aafdcc30ba6012ad66c64a4ada956bc7b0b11b49
|


