A graph maker for computational geometry and network visualization

Project description
Graphizy
A powerful graph maker for computational geometry and network visualization, specializing in Delaunay triangulation and proximity graphs.
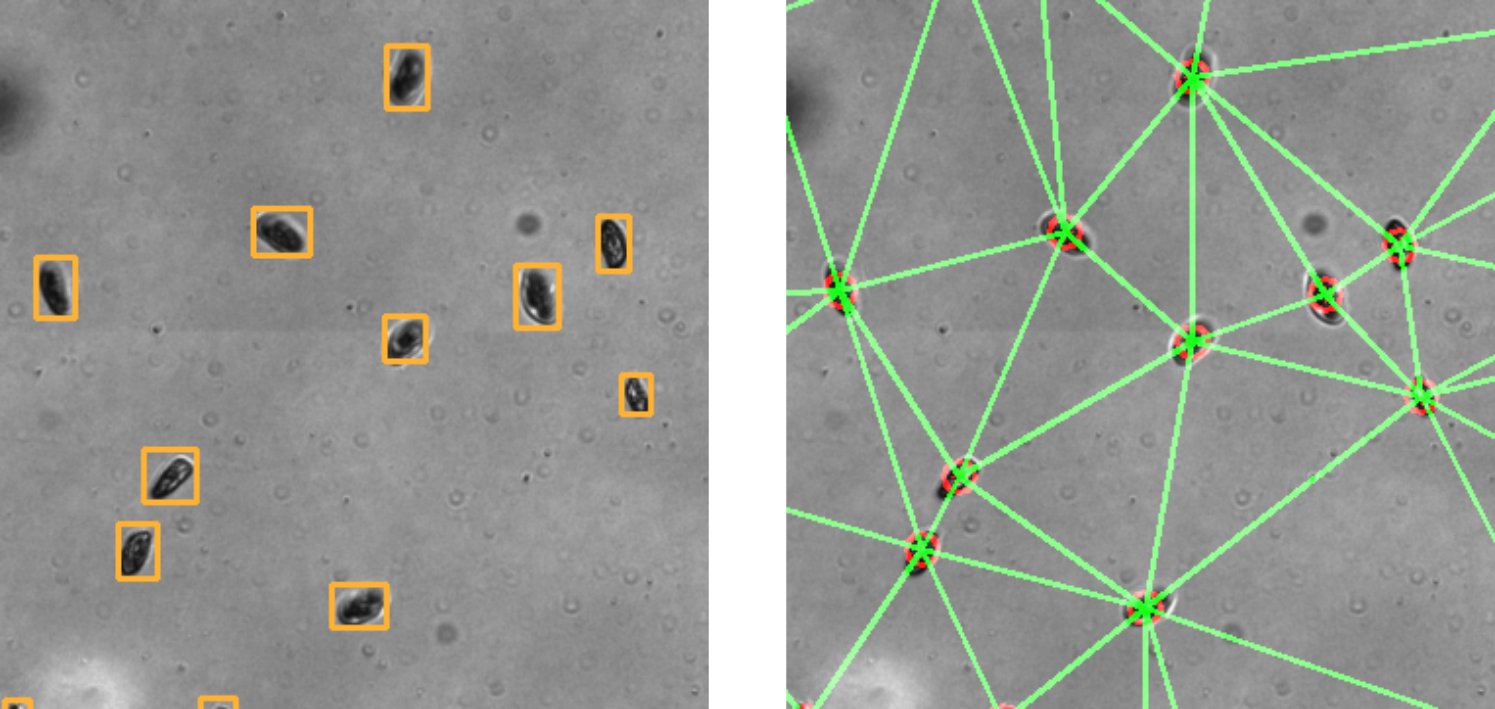
Figure: Positions are converted to a graph in just a few milliseconds for hundreds of individuals using OpenCV.
Graph analytics are accessible in real time as well, by interfacing with igraph.
Features
Graph construction
- Delaunay Triangulation: Create optimal triangular meshes from point sets
- Proximity Graphs: Connect nearby points based on distance thresholds
- Collision Graphs: Connect points based on history of collisions
Graph Analysis
- Igraph based: https://igraph.org/python/tutorial/0.9.7/analysis.html
- Comprehensive API: Call any igraph method safely with error handling
Design
- Flexible Configuration: Runtime-configurable parameters using dataclasses
- Multiple Output Formats: Save graphs as images or display interactively
- Command Line Interface: Easy-to-use CLI for common operations
- Robust Error Handling: Detailed exceptions and validation
- Performance Monitoring: Built-in timing and optimization tracking
Installation
pip install graphizy
Or for development:
git clone https://github.com/cfosseprez/graphizy.git
cd graphizy
pip install -e .
Quick Start
Python API
import numpy as np
from graphizy import Graphing, generate_positions

# Generate random points
positions = generate_positions(800, 800, 100)
particle_ids = np.arange(len(positions))
data = np.column_stack((particle_ids, positions))

# Create grapher
grapher = Graphing(dimension=(800, 800))

# Create Delaunay triangulation
delaunay_graph = grapher.make_delaunay(data)

# Create proximity graph
proximity_graph = grapher.make_proximity(data, proximity_thresh=50.0)

# Draw and save
delaunay_image = grapher.draw_graph(delaunay_graph)
grapher.save_graph(delaunay_image, "delaunay.jpg")

# Get graph statistics
info = grapher.get_graph_info(delaunay_graph)
print(f"Vertices: {info['vertex_count']}, Edges: {info['edge_count']}")
Command Line Interface
# Create Delaunay triangulation
graphizy delaunay --size 800 --particles 100 --output delaunay.jpg --show

# Create proximity graph
graphizy proximity --size 800 --particles 100 --threshold 50 --output proximity.jpg

# Create both and compare
graphizy both --size 1000 --particles 150 --threshold 40 --show

# Get detailed statistics
graphizy info --size 800 --particles 100 --output stats.json
Configuration
Graphizy uses dataclasses for configuration that can be modified at runtime:
from graphizy import GraphizyConfig, Graphing

# Create custom configuration
config = GraphizyConfig()
config.drawing.line_color = (255, 0, 0)  # Red lines
config.drawing.point_radius = 12
config.graph.proximity_threshold = 75.0

# Create grapher with config
grapher = Graphing(config=config)

# Update configuration at runtime
grapher.update_config(
    drawing={"line_thickness": 3},
    graph={"dimension": (1200, 1200)}
)
Configuration Options
Drawing Configuration
line_color: Line color as (B, G, R) tupleline_thickness: Line thickness in pixelspoint_color: Point color as (B, G, R) tuplepoint_thickness: Point outline thicknesspoint_radius: Point radius in pixels
Graph Configuration
dimension: Canvas size as (width, height)data_shape: Data structure definitionaspect: Data format ("array" or "dict")proximity_threshold: Distance threshold for proximity graphsdistance_metric: Distance metric ("euclidean", "manhattan", etc.)
Advanced Usage
Custom Data Structures
from graphizy import Graphing, DataInterface

# Define custom data structure
data_shape = [
    ("particle_id", int),
    ("position_x", float),
    ("position_y", float),
    ("velocity", float),
    ("mass", float)
]

grapher = Graphing(data_shape=data_shape)
Calling Any igraph Method
# Call any igraph method safely
vertex_count = grapher.call_method(graph, 'vcount')
degree_sequence = grapher.call_method(graph, 'degree')
clustering = grapher.call_method(graph, 'transitivity_undirected')

# Get comprehensive graph information
info = grapher.get_graph_info(graph)
print(info)
Error Handling
from graphizy import GraphizyError, SubdivisionError

try:
    graph = grapher.make_delaunay(invalid_data)
except SubdivisionError as e:
    print(f"Triangulation failed: {e}")
except GraphizyError as e:
    print(f"Graph creation error: {e}")
CLI Reference
Commands
delaunay: Create Delaunay triangulationproximity: Create proximity graphboth: Create both graph typesinfo: Generate statistics and analysis
Common Options
--size SIZE: Canvas size (default: 1200)--particles N: Number of points (default: 200)--output FILE: Save image to file--show: Display graph interactively--verbose: Enable detailed logging--config FILE: Load configuration from JSON file
Proximity Options
--threshold DIST: Distance threshold (default: 50.0)--metric METRIC: Distance metric (default: euclidean)
Styling Options
--line-color R,G,B: Line color (default: 0,255,0)--point-color R,G,B: Point color (default: 0,0,255)--line-thickness N: Line thickness (default: 1)--point-radius N: Point radius (default: 8)
Examples
Configuration File
Create a JSON configuration file:
{
  "drawing": {
    "line_color": [255, 0, 0],
    "line_thickness": 2,
    "point_radius": 10
  },
  "graph": {
    "dimension": [1024, 768],
    "proximity_threshold": 60.0
  },
  "generation": {
    "num_particles": 250
  }
}
Use with CLI:
graphizy both --config my_config.json --show
Batch Processing
import numpy as np
from graphizy import Graphing, generate_positions

grapher = Graphing(dimension=(600, 600))

for i in range(10):
    # Generate different datasets
    positions = generate_positions(600, 600, 50 + i*10)
    data = np.column_stack((np.arange(len(positions)), positions))

    # Create graphs
    delaunay_graph = grapher.make_delaunay(data)
    proximity_graph = grapher.make_proximity(data, proximity_thresh=30.0)

    # Save results
    del_image = grapher.draw_graph(delaunay_graph)
    prox_image = grapher.draw_graph(proximity_graph)

    grapher.save_graph(del_image, f"delaunay_{i:02d}.jpg")
    grapher.save_graph(prox_image, f"proximity_{i:02d}.jpg")
API Reference
Main Classes
Graphing: Main class for graph creation and visualizationGraphizyConfig: Configuration managementDataInterface: Data format handling
Key Functions
generate_positions(): Generate random point distributionsmake_subdiv(): Create OpenCV subdivisionsget_distance(): Calculate distance-based connectionscall_igraph_method(): Safe igraph method calling
Drawing Functions
draw_point(): Draw individual pointsdraw_line(): Draw lines between pointsshow_graph(): Display graphs interactivelysave_graph(): Save graphs to files
Requirements
- Python >= 3.8
- NumPy >= 1.20.0
- OpenCV >= 4.5.0
- python-igraph >= 0.9.0
- SciPy >= 1.7.0
Development
Running Tests
pip install pytest pytest-cov
pytest tests/ --cov=graphizy
Code Style
pip install black flake8
black src/
flake8 src/
License
MIT License - see LICENSE file for details.
Contributing
- Fork the repository
- Create a feature branch
- Add tests for new functionality
- Ensure all tests pass
- Submit a pull request
Author
Charles Fosseprez
Email: charles.fosseprez.me@gmail.com
Changelog
v0.1.0
- Initial release
- Delaunay triangulation support
- Proximity graph creation
- Configurable drawing parameters
- Command line interface
- Comprehensive test suite
- Error handling and validation
Release history Release notifications | RSS feed


Download files
Download the file for your platform. If you're not sure which to choose, learn more about installing packages.
Source Distribution
Built Distribution
Filter files by name, interpreter, ABI, and platform.
If you're not sure about the file name format, learn more about wheel file names.
Copy a direct link to the current filters
File details
Details for the file graphizy-0.1.2.tar.gz.
File metadata
- Download URL: graphizy-0.1.2.tar.gz
- Upload date:
- Size: 34.3 kB
- Tags: Source
- Uploaded using Trusted Publishing? No
- Uploaded via: poetry/2.1.3 CPython/3.9.13 Windows/10
File hashes
| Algorithm | Hash digest | |
|---|---|---|
| SHA256 |
a4fbde699151c386f52e56bdebf53397ae58be30a3b67770dced6905c0a9502e
|
|
| MD5 |
b63b80fcb361b35b6a33ad2af403ca13
|
|
| BLAKE2b-256 |
9fa56e05f1618bb34ea1048de3bae290b2f73d82f0dfc67278919408333024cd
|
File details
Details for the file graphizy-0.1.2-py3-none-any.whl.
File metadata
- Download URL: graphizy-0.1.2-py3-none-any.whl
- Upload date:
- Size: 25.7 kB
- Tags: Python 3
- Uploaded using Trusted Publishing? No
- Uploaded via: poetry/2.1.3 CPython/3.9.13 Windows/10
File hashes
| Algorithm | Hash digest | |
|---|---|---|
| SHA256 |
6504d9ceaa8fc03ea6df1b2293b516637ae8585e2eea1b5541df589b53c8926b
|
|
| MD5 |
dca64c3776caed8068b5a222250eb946
|
|
| BLAKE2b-256 |
d8bbe4050d9444a5939eea018ed7b1b557e0754dc88f19a0039140745d863e79
|


