
inferlint




inferlint measures what your inference server actually did—and flags what it didn't tell you.
Measure achieved concurrency, preemptions, KV-cache behavior, GPU state, timing quality, and other signals that can silently invalidate inference results.
A serving benchmark can be wrong without an error. On vLLM 0.28, 0.29 and 0.30, a preempted request moves a counter and writes no log line. A config can start cleanly and fail on its first request. Two starts with the same flags can size different KV pools. Killing the API server can leave the engine process holding the GPU. None of these raise an error, and each changes the numbers.
inferlint runs around a benchmark. It reads the server's boot log and Prometheus
counters, measures what happened, and flags each of these problems when it occurs. Your
load tool (vllm bench serve or any other) sends the requests; inferlint checks what the
server did with them.
Tutorial · Example report · Reference · Changelog
Try it in 30 seconds, without a GPU
The repository includes the files from a recorded run:
pipx install inferlint
git clone --depth 1 https://github.com/radianvector/inferlint && cd inferlint
inferlint series tests/fixtures/vllm-0.28/live/run.series.jsonl \
    --snapshot tests/fixtures/vllm-0.28/live/after.snapshot.json --requested 32
[T14] PASS  gauge denominator is 42 = num_gpu_blocks (43) - 1 null block
[ T9] WARN  ceiling moved between 7 and 10 as requests grew (one request held 9.5% to 14.3% of the cache); concurrency was not a constant of this run
[ T8] TRIPWIRE-FAILED  requested 32 concurrent, server never ran more than 10
Check your own run with one command
inferlint xray -o run/ --serve "vllm serve MODEL --max-model-len 16384" \
    -- vllm bench serve --model MODEL --dataset-name random --random-input-len 88 \
       --random-output-len 1000 --ignore-eos --num-prompts 32 --max-concurrency 32
Output from the RTX 4090 run described below, on vLLM 0.28 (paths and the load command shortened, the benchmark's own output left out):
== is the GPU free?
[ T2] PASS  2 consecutive clear readings
== start the server (output in run/boot.log)
== boot log
[T12] PASS  no failure in log
[ T5] WARN  attention block size forced to 784 tokens (requested 16); each request's KV is allocated in 784-token units
[ T6] PASS  nothing to check: the server was started without --attention-backend, so vLLM chose its own (FLASH_ATTN) and nothing could be ignored; there was no draft model either
== probe: one request, then 8 at once
[ T7] PASS  1 + 8 concurrent requests served, server alive
== load: vllm bench serve --model MODEL ... --max-concurrency 32 --save-result --result-dir run --result-filename bench.json
== checks
[ T1] TRIPWIRE-FAILED  21 preemptions during the run
[T10] PASS  314.99 tokens/s over 101.590s; an integer-second timer would say 313.73 (-0.40%)
[T14] PASS  gauge denominator is 42 = num_gpu_blocks (43) - 1 null block
[ T9] WARN  ceiling moved between 5 and 10 as requests grew (one request held 9.5% to 19.0% of the cache); concurrency was not a constant of this run
[ T8] TRIPWIRE-FAILED  requested 32 concurrent, server never ran more than 10
[T15] PASS  client and server agree: 32 requests, 32,000 output tokens
== stop the server
[ T2] PASS  2 consecutive clear readings
12 checks (8 pass, 2 warn, 2 tripwire-failed)
report: run/report.html
files:  run
xray checks that the GPU is free, starts the server and saves its boot log, sends 9
probe requests, records the server's counters and gauges around the load command after
--, runs every tripwire that applies, and writes run/report.html and
run/results.json. It always stops the server at the end, also after a failure or
Ctrl-C. Without --serve it attaches to a server that is already running (--url,
--boot-log). Exit status: 0 when every tripwire passed, 1 when one failed or the run did
not complete, 2 when one could not decide.
For vllm bench serve, xray adds --save-result and compares the benchmark's own
counts with the server's (T15), and reads --max-concurrency as the concurrency asked
for (T8).
One run, measured
vLLM 0.28 on an RTX 4090, a 27B hybrid attention/Mamba model with 4-bit weights and CUDA graphs on. 32 concurrent requests, 1,000 output tokens each:
$ inferlint preemption before.json after.json
[ T1] TRIPWIRE-FAILED  22 preemptions during the run
$ grep -ci preempt boot.log
0
$ inferlint series run.series.jsonl --snapshot after.json --requested 32
[T14] PASS  gauge denominator is 42 = num_gpu_blocks (43) - 1 null block
[ T9] WARN  ceiling moved between 7 and 10 as requests grew (one request held 9.5% to 14.3% of the cache); concurrency was not a constant of this run
[ T8] TRIPWIRE-FAILED  requested 32 concurrent, server never ran more than 10
- The client held 32 requests in flight. The server never ran more than 10 at once.
- A fresh request held 4 KV blocks, so 10 fit. As outputs crossed the 784-token block boundary, running requests held up to 6 blocks each on average, and the number that fit fell as low as 7. Each fall evicted running requests, 22 times in all, and the server log says nothing about it.
- The server exports 43 KV blocks, but the usage gauge counts in 42nds. One block is reserved and never holds a request.
Then the API server was killed with SIGKILL, as a crash or the OOM killer would:
$ pkill -9 -f "vllm[ ]serve"; sleep 20
$ ps -eo pid,ppid,rss,args | grep -E "[V]LLM::|[v]llm serve"
   1030     423 2733144 VLLM::EngineCore
$ inferlint gpu-inspect          # the GPU's model and memory lines are left out here
[ T2] TRIPWIRE-FAILED  card not clear; refusing to boot. ... 21768 MiB used, 1 server processes alive
$ inferlint teardown
target  pid=1030     VLLM::EngineCore
(pkill -f 'vllm serve' would miss 1 and wrongly hit 0)
[ T2] PASS  2 consecutive clear readings
The engine outlived its parent and kept 21.3 GiB of the card. The usual cleanup pattern
cannot see it, and the next start would have loaded a second copy into what was left.
The same run on vLLM 0.29 and 0.30 gave the same findings (below). The xray output
above is a second run on 0.28: 21 preemptions instead of 22, and a lowest ceiling of 5
instead of 7, with the same tripwires failing and warning. The raw files are in
tests/fixtures/,
and tests/test_live.py and tests/test_compat.py pin every number.
Tested versions
Each tripwire on each tested release, on an RTX 4090 (WSL2, driver 616.56) with the model and load above:
| tripwire | what the run showed | 0.28 (two runs) | 0.29 | 0.30 |
|---|---|---|---|---|
| T1 silent-preemption | preemptions; none in the log | live: 22 / 21 | live: 21 | live: 22 |
| T2 orphaned-engine | MiB the engine kept after the API server was killed | live: 21,768 | live: 21,522 | live: 21,872 |
| T4 pool-size-jump | KV pool, starts with the same flags | recorded: a 9.4% jump | live: same in 2 starts | live: same in 2 starts |
| T5 large-kv-blocks | attention block size, tokens | live: 784 | live: 784 | live: 784 |
| T6 backend-ignored | requested backend not applied to the drafter | recorded | not tested | not tested |
| T7 crash-after-ready | probe after ready | live (healthy); a crash recorded | live (healthy) | live (healthy) |
| T8 concurrency-not-reached | most requests running at once, of 32 | live: 10 / 10 | live: 10 | live: 11; admission control |
| T9 falling-ceiling | concurrency ceiling, highest → lowest | live: 10 → 7 / 10 → 5 | live: 10 → 5 | live: 11 → 7 |
| T10 integer-second-timer | rate from exact timestamps | live | live | live |
| T11 kv-memory-drift | KV memory, starts with the same flags | recorded: drift | live: same in 2 starts | live: same in 2 starts |
| T12 unexplained-failure | real start-up failures named | live: 1; recorded: 1 | live: 1 | live: 3 |
| T14 null-block | usable of exported KV blocks | live: 42 of 43 | live: 42 of 43 | live: 47 of 48 |
| T15 client-server-mismatch | load tool's counts against the server's | live: agree | live: agree | live: agree; also with 16 rejected |
T3 and T13 concern shell scripts, not vLLM, and do not depend on its version. The counts differ a little from run to run: 0.28 shows both of its runs.
live: measured on a running server of that version. recorded: tested on recorded files from that version. A boot log from a release not listed here makes inferlint print a warning, since log lines and metric names change between releases.
Setting up these runs on WSL with pip-installed CUDA hit five start-up failures, and T12
named the cause of each (details in docs/tripwires.md).
The fixes: VLLM_USE_V2_MODEL_RUNNER=0 on 0.29; on 0.29 and 0.30, a CUDA 13.0 compiler
matching torch's CUDA runtime for FlashInfer's kernel builds; on 0.28,
VLLM_USE_FLASHINFER_SAMPLER=0, as in the recorded run.
What it checks
| id | name | trap | command |
|---|---|---|---|
| T1 | silent-preemption | preemption writes no log line, only a counter moves | inferlint preemption BEFORE AFTER |
| T2 | orphaned-engine | pkill -f "vllm serve" misses the renamed VLLM::EngineCore |
inferlint teardown, inferlint gpu-inspect |
| T3 | cleanup-self-kill | pkill -f in a shell one-liner kills the shell |
inferlint teardown |
| T4 | pool-size-jump | the KV pool is sized per start, in discrete steps | inferlint check-log BOOT... |
| T5 | large-kv-blocks | hybrid models force a large attention block (the allocation unit) | inferlint check-log |
| T6 | backend-ignored | the requested attention backend is not applied to the speculative drafter | inferlint check-log |
| T7 | crash-after-ready | a config starts, then dies on its first request | inferlint probe URL, inferlint check-log |
| T8 | concurrency-not-reached | requested concurrency is not achieved concurrency | inferlint series --requested N |
| T9 | falling-ceiling | the concurrency ceiling is floor(1 / share), and it falls as requests grow |
inferlint series |
| T10 | integer-second-timer | integer-second timers are off by up to a second at each end | inferlint rate BEFORE AFTER |
| T11 | kv-memory-drift | KV memory differs between starts with the same flags | inferlint check-log BOOT... |
| T12 | unexplained-failure | start-up failures recorded without a cause | inferlint check-log |
| T13 | stale-waiter | a killed campaign's waiter adopts the next server | docs/orchestration.md |
| T14 | null-block | the KV usage gauge counts out of num_gpu_blocks - 1 |
inferlint series --snapshot |
| T15 | client-server-mismatch | the load tool's counts differ from the server's | inferlint xray |
Each is described in docs/tripwires.md
with its symptom, why it changes results, and a command that reproduces it from files in
this repository. inferlint explain T9 (or inferlint explain falling-ceiling) prints
the same in the terminal.
Install
pipx install inferlint
inferlint --help
pipx gives inferlint an environment of its own and puts the
command on your PATH, so it works in any terminal and from any folder, with nothing to
activate. uv tool install inferlint does the same. To use it as a library, install it
into your project's environment with pip install inferlint (see
Use it from Python).
Python 3.10+, no dependencies. teardown, xray --serve, and the free-GPU check in
gpu-inspect find the server's processes through /proc, so they need Linux (or WSL),
where vLLM runs. Everything else runs anywhere.
Use the commands one at a time
xray runs the sequence below for you. The separate commands are for scripts that need
to control each step. A test with inferlint takes as long as your benchmark. It checks
one test at a time; it is not a monitor for a server that runs for days (Prometheus and
Grafana do that job).
Use two terminals on the GPU machine, in the same folder: A runs the server, B runs everything else.
# 1. Before the server starts (B)
inferlint gpu-inspect                  # which GPU, its memory; fails if an old server still holds it

# 2. Start the server (A): your usual command, saving its start-up output
vllm serve MODEL 2>&1 | tee boot.log   # wait for "Application startup complete"

#    then check it (B)
inferlint check-log boot.log           # block size, attention backend, start-up failures
inferlint probe http://127.0.0.1:8000  # sends 9 small requests: does it answer?

# 3. The test (B)
inferlint snapshot http://127.0.0.1:8000 -o before.json
inferlint watch http://127.0.0.1:8000 -o run.series.jsonl --interval 0.25 &
vllm bench serve --model MODEL --max-concurrency 32 ...   # your benchmark sends the load
inferlint snapshot http://127.0.0.1:8000 -o after.json
kill %1                                # stops the recording

# 4. The verdict: one HTML page (any time later, on any computer)
inferlint report -o run.html --requested 32 --boot-log boot.log \
    --before before.json --after after.json --series run.series.jsonl

# 5. Stop the server (B)
inferlint teardown                     # stops every vLLM process, waits until the GPU is free
- Your benchmark sends the requests and reports speed and latency. inferlint reads the server's side and says which of those numbers hold.
--requestedis the concurrency your benchmark asked for (--max-concurrencyinvllm bench serve). Requests, tokens and preemptions come from the server's counters.- Each command does one job and exits, except
watch. They only read, exceptprobe(9 small requests) andteardown, which stops the server: don't run it against a server that is serving users. - The same verdicts in the terminal:
inferlint preemption before.json after.json(T1),inferlint rate before.json after.json(T10),inferlint series run.series.jsonl --snapshot after.json --requested 32(T8, T9, T14). - T4 and T11 compare start-ups: keep the log of each start with the same settings and
pass them all (
--boot-log boot1.log --boot-log boot2.log). - In scripts,
inferlint gpu-inspect || exit 1andinferlint probe http://127.0.0.1:8000 || exit 1stop a run before it produces bad numbers. docs/orchestration.md covers scripts that run many tests.
A failed tripwire prints as TRIPWIRE-FAILED: the tripwire caught its problem. For T7
and T12 that means the server failed; for every other tripwire the server worked, but a
number from the run does not mean what it seems. Exit status is 0 when every tripwire
passes (warnings allowed), 1 when one fails, and 2 when one cannot decide because a
series or a log line was missing. A missing series is never read as zero. --json gives
machine-readable results ("status": "fail" for a failed tripwire); --strict fails on
warnings.
The report
inferlint report turns a run's files into one HTML page. It opens with a plain-English
account of what happened (how long the test ran, requests finished and failed, tokens
generated, time spent queued, which tripwires were checked and which need other
files), then the verdicts, charts of what the server did over time, the boot facts, and
a guide to every tripwire. Two collapsible glossaries explain the terms (token, KV
pool, block, preemption) and what Pass, Warning, Tripwire failed and Can't tell mean.
The page fetches nothing, so it opens offline and can be attached to a ticket as it is. It has a light/dark switch, every chart has a data table, and hovering (or the arrow keys) reads values at any moment.
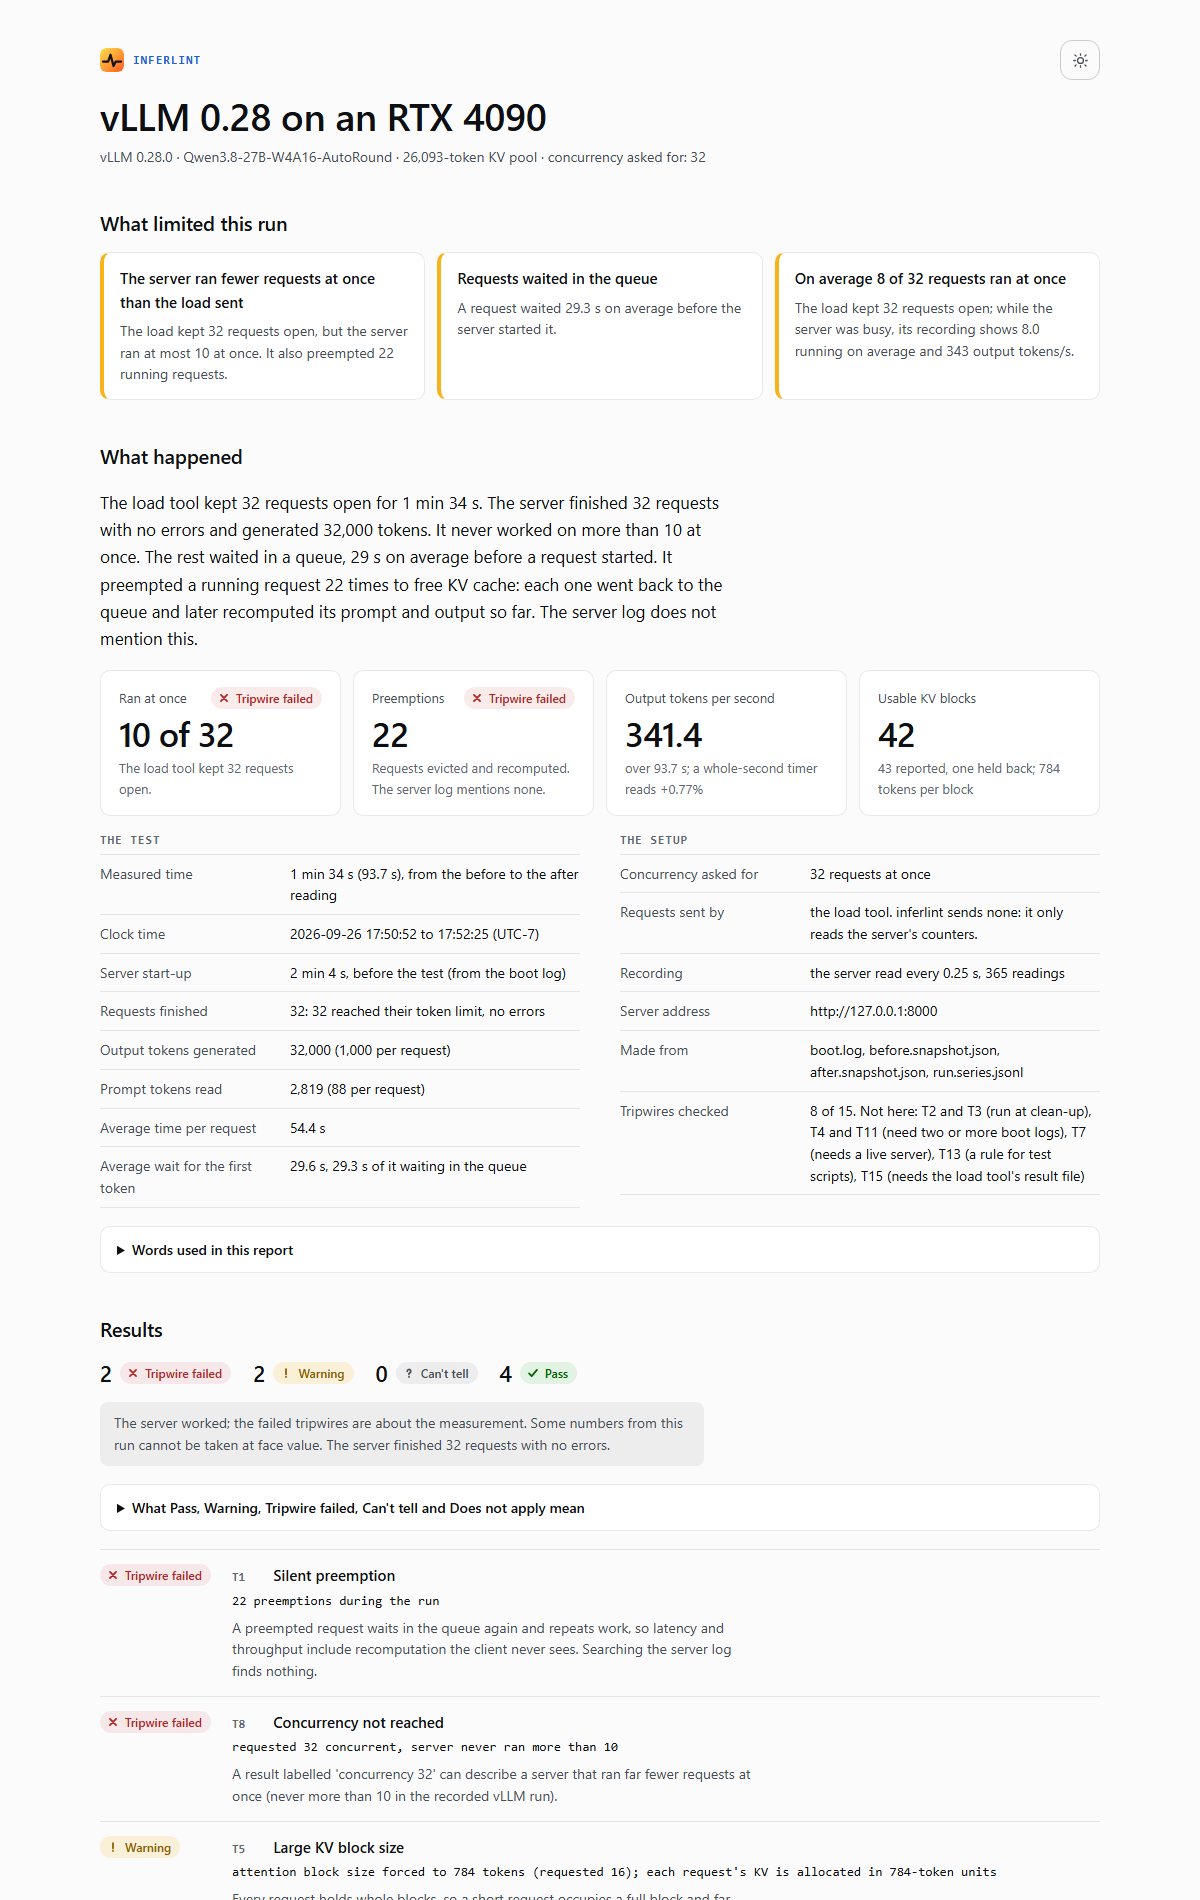
See a full example.
The complete report for the run above
has the charts, the findings and both glossaries. The same file is in this repository as
docs/example-report.html, and it works offline.
Try it without a GPU. The example is built from the recorded run in this repository. Download the repository for its files, and make the report yourself:
git clone https://github.com/radianvector/inferlint
cd inferlint
inferlint report -o example-report.html --title "vLLM 0.28 on an RTX 4090" --requested 32 \
    --boot-log tests/fixtures/vllm-0.28/live/boot.log \
    --before tests/fixtures/vllm-0.28/live/before.snapshot.json \
    --after tests/fixtures/vllm-0.28/live/after.snapshot.json \
    --series tests/fixtures/vllm-0.28/live/run.series.jsonl
Use it from Python
Install it into your project's environment with pip install inferlint. Every check
returns a CheckResult with a status (pass, warn, fail or unknown), a message, and
the evidence behind it.
import subprocess

from inferlint import bootlog, checks, telemetry

url = "http://127.0.0.1:8000"
before = telemetry.scrape(url)
subprocess.run(["vllm", "bench", "serve", "--model", "MODEL"], check=True)  # your benchmark
after = telemetry.scrape(url)

result = checks.check_no_preemption(before, after)
print(result.status.value, result.message)  # fail 22 preemptions during the run
result.raise_for_status()  # raises TripwireFailed on a failed tripwire or a Can't tell

facts = bootlog.parse_file("boot.log")
print(facts.attention_block_size, facts.kv_pool_tokens)  # 784 26093
record = {"boot": facts.result_block()}  # pool, block size, backend: keep with your results
raise_for_status() lets warnings through; raise_for_status(allow_warn=False) stops on
them too.
| module | what it gives you |
|---|---|
bootlog |
the facts in a start-up log (parse_file) |
telemetry |
the server's counters (scrape, load) |
series |
recordings made during a run (watch, read) |
checks |
the tripwires, each returning a CheckResult |
catalog |
each tripwire's code, name and explanation (TRIPWIRES, lookup) |
probe |
the first-request check (T7) |
gpu |
which GPU, its family and memory (read_gpus) |
teardown |
stopping the server and waiting for a free GPU (Linux) |
report |
the HTML report (build, render) |
benchresult |
a vllm bench serve --save-result file (load) |
xray |
the whole sequence in one call (run, Plan) |
metricnames |
every metric name inferlint reads (VLLM) |
How it is tested
- Real evidence. Fixtures are vLLM 0.28, 0.29 and 0.30 boot logs,
/metricsoutput and benchmark results from an RTX 4090, with paths removed. Each check is tested against the case it exists for. - Every check is watched failing.
tests/test_mutations.pychanges one number or line in real evidence and requires the verdict to flip. - Instruments against ground truth. The probe runs against a mock server with known
failure modes. Block-count inference (T14) is checked against the count the server
exports. The teardown's process matching runs on a synthetic
/procthat includes the shell one-liner and a bystander. GPU facts are parsed from realnvidia-smioutput. - Unknown formats are reported, not defaulted. When a known log line changes format
in a new vLLM release,
boot-factslists it as unparsed instead of returning a value, and a boot log from an untested release prints a warning. xrayagainst a mock server. The whole sequence runs in the tests against a mock server with known counters, including other traffic (T15) and a server that dies during start-up.
Contribute
The most useful contribution is a recorded run from a vLLM version or GPU that is not in
the table above: inferlint xray -o run/ ... saves every file needed.
CONTRIBUTING.md
says how to share it, how to set up the code, and what a new tripwire needs. GitHub
Actions runs the tests, lint and type checks on every push and pull request, on Python
3.10 to 3.13. This tests inferlint's own code; it is not a GitHub Action for your
benchmarks. Security problems: see
SECURITY.md.
Status
Alpha. Tested live on vLLM 0.28, 0.29 and 0.30 on one GPU model (RTX 4090). Next: more GPUs and models from contributed runs, and a second serving engine.
About
inferlint is made by RadianVector. RadianVector develops
tools and research for evaluating and improving AI systems.
License
Copyright 2026 RadianVector.
This project, including the recorded evidence in tests/fixtures/, is licensed under the
Apache License, Version 2.0. See LICENSE
for details.
1 maintainer

Metadata
1 maintainer
Release files for inferlint 0.2.0
For a detailed explanation of source distributions (sdists) and built distributions (wheels), please see the package formats documentation.
Source distribution (sdist)
| File | Size | Uploaded | |
|---|---|---|---|
| inferlint-0.2.0.tar.gz | 1.0 MB | Details |
Built distribution (wheel)
| File | Interpreter | ABI | Platform | Reset |
|---|---|---|---|---|
| inferlint-0.2.0-py3-none-any.whl | Python 3 | none | any | Details |
Total release size: 1.1 MB
Release files / inferlint-0.2.0.tar.gz
| Download URL | inferlint-0.2.0.tar.gz |
|---|---|
| Size | 1.0 MB |
| Tags | Source |
|
SHA-256 checksum How to use checksums |
424e241dd589150ad94ef0088dc70e391d515a5602fe95f03de4b7de816c3d30
|
|
BLAKE2b-256 checksum How to use checksums |
211da11775ecf5a8227aedaca75144d33efb9b063b78dba87a0739f53aed3bb1
|
| Upload date | |
|
Uploaded using Trusted Publishing? What is trusted publishing? |
Yes |
| Uploaded via |
twine/7.0.0 CPython/3.13.14
|
Provenance
Provenance describes where a file came from. On PyPI, provenance is shared via attestations, which provide a verifiable record of the build or publishing details. View details, limitations and caveats.


PyPI Publish Attestation
PyPI verified that this artifact, at this checksum, originated from the publisher listed below.
Signed by GitHub Actions, verified by PyPI on Oct 1, 2026.
Transparency logRelease files / inferlint-0.2.0-py3-none-any.whl
| Download URL | inferlint-0.2.0-py3-none-any.whl |
|---|---|
| Size | 84.0 kB |
| Tags | Python 3 |
|
SHA-256 checksum How to use checksums |
fdd25d2967f8c0bbe1fea68f9839eec4166be6cc0fece5f11c1096331d61a716
|
|
BLAKE2b-256 checksum How to use checksums |
a678ce488e311dde5417f3637201b2ecd74617d411e0d59b0ce30855e44fb5fa
|
| Upload date | |
|
Uploaded using Trusted Publishing? What is trusted publishing? |
Yes |
| Uploaded via |
twine/7.0.0 CPython/3.13.14
|
Provenance
Provenance describes where a file came from. On PyPI, provenance is shared via attestations, which provide a verifiable record of the build or publishing details. View details, limitations and caveats.
PyPI Publish Attestation
PyPI verified that this artifact, at this checksum, originated from the publisher listed below.
Signed by GitHub Actions, verified by PyPI on Oct 1, 2026.
Transparency log













