
inspect-mlflow







MLflow integration for Inspect AI. Provides experiment tracking, execution tracing, evaluation comparison, and artifact logging for Inspect AI evaluations.
Install
pip install inspect-mlflow
Quick Start
Hooks auto-register via entry points when the package is installed. No code changes needed.
# Start MLflow server
mlflow server --port 5000

# Set env vars
export MLFLOW_TRACKING_URI="http://localhost:5000"
export MLFLOW_INSPECT_TRACING="true"

# Run evals as usual. Both hooks activate automatically.
inspect eval my_task.py --model openai/gpt-4o
Then open http://localhost:5000 to see runs and traces.
What it does
This package provides two hooks that run automatically during Inspect AI evaluations. Both hooks use the MlflowClient API for full isolation from user MLflow state (no global mlflow.start_run calls). Thread-safe for concurrent sample processing.
Tracking Hook
Activated when MLFLOW_TRACKING_URI is set. Creates hierarchical MLflow runs with full evaluation telemetry.
What gets logged:
- Parent run per eval invocation with nested child runs per task
- Task configuration as parameters (model, dataset, solver, temperature, top_p, max_tokens)
- Per-sample scores as step metrics (accuracy, timing per sample)
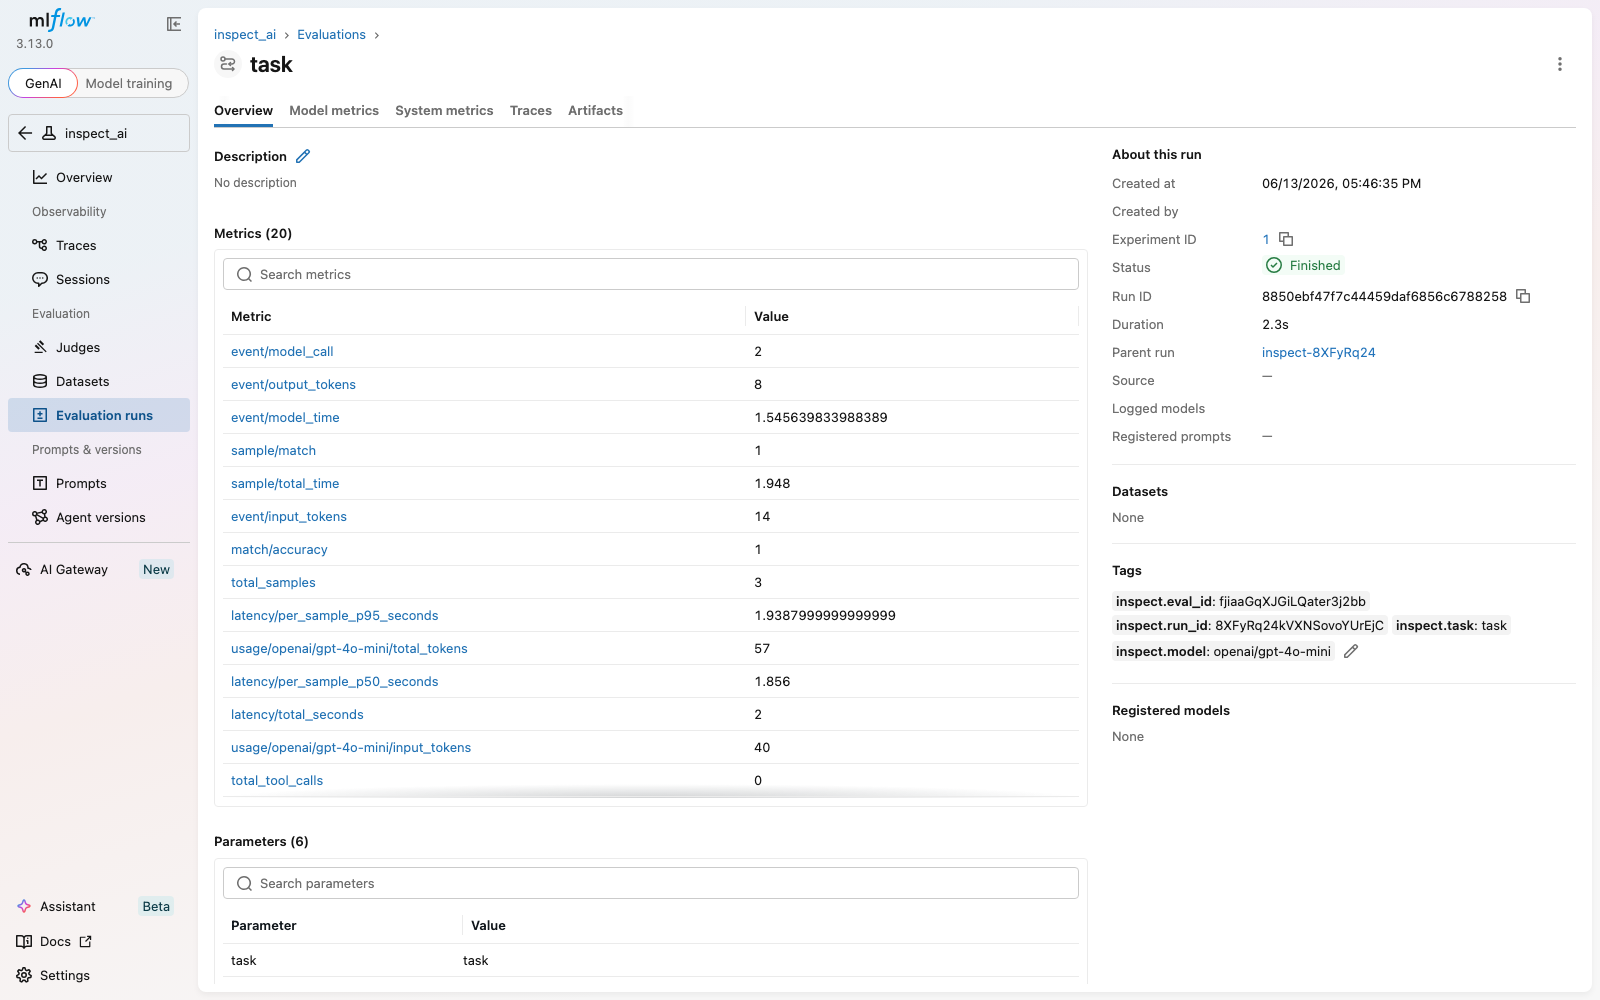
- Aggregate metrics (total_samples, completed_samples, match/accuracy, match/stderr)
- Model token usage (input/output/total tokens per model)
- Cost per model (
usage/<model>/total_cost_usd) and aggregatecost/total_usdwhen the inspect_ai provider surfaces cost (new in v0.8.0) - Latency aggregates (
latency/per_sample_mean_seconds,latency/per_sample_p50_seconds,latency/per_sample_p95_seconds,latency/total_seconds) for SLA tracking (new in v0.8.0) - Real-time event counting (total_model_calls, total_tool_calls)
- Eval artifacts: per-sample results JSON + full eval log JSON
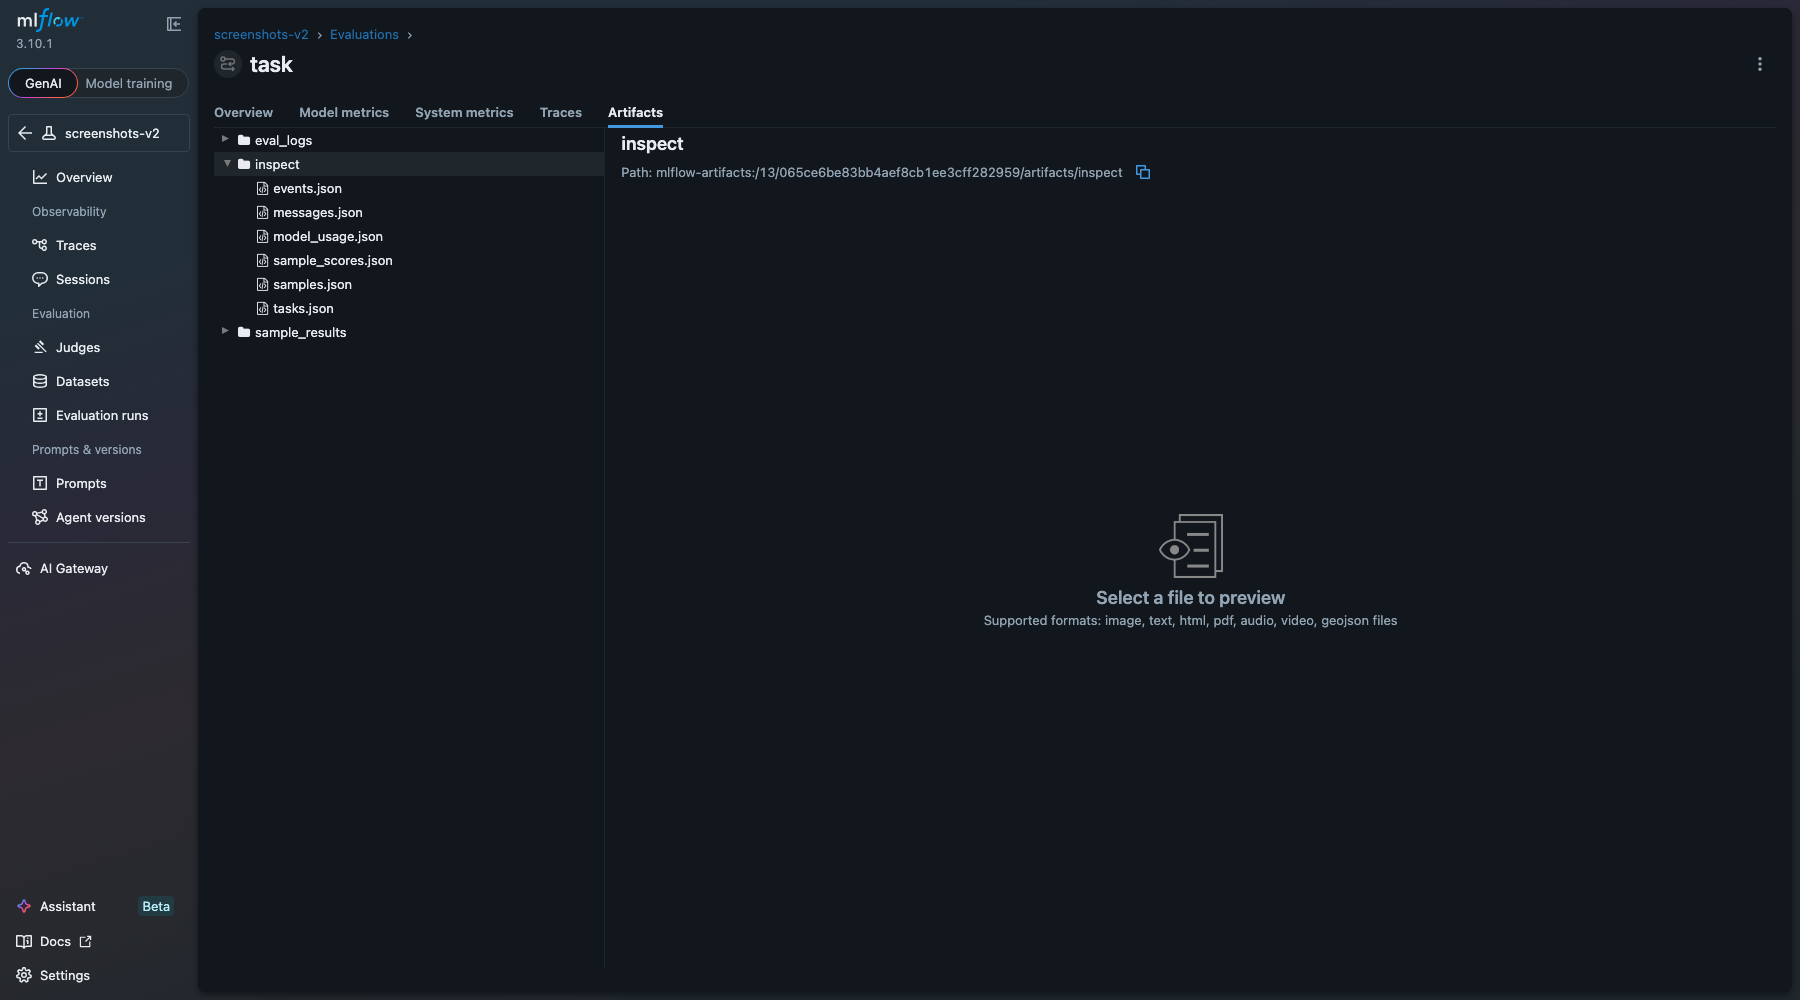
- Additional rich table artifacts for analysis (
inspect/*.json)
Task run with metrics including the v0.8.0 latency aggregates and per-model token usage:
Artifact tables (inspect/) with structured eval data:
Tracing Hook
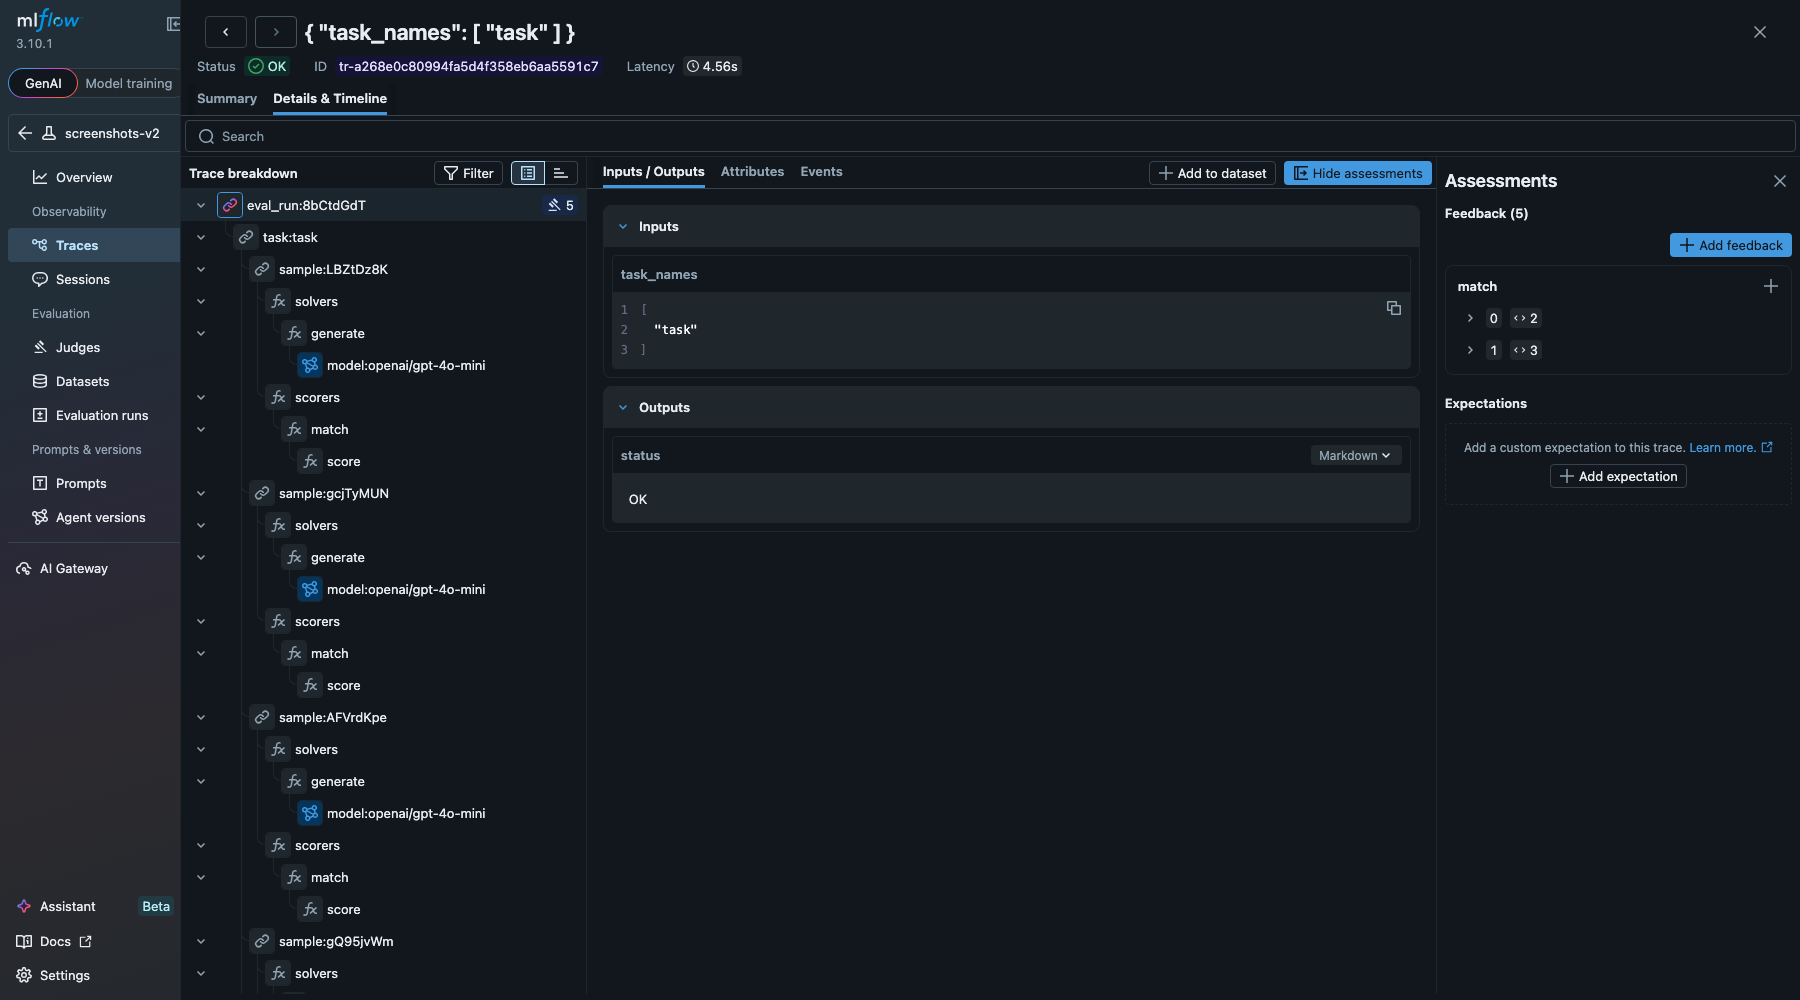
Activated when MLFLOW_INSPECT_TRACING=true is also set. Maps eval execution to MLflow trace spans, giving you a visual debugging view of every model call, tool invocation, and scoring step. Eval scores are logged as MLflow trace assessments via mlflow.log_feedback(), visible in the Traces UI assessment column.
Span hierarchy:
eval_run:98h4b4KN (CHAIN)
  task:task (CHAIN)
    sample:keAdeL1U (CHAIN)
      solvers (from SpanBeginEvent)
        use_tools (solver span)
          model:openai/gpt-4o-mini (LLM) - 5,167 tokens
          tool:calculator (TOOL) - args: {"expression": "47 * 89"}, result: "4183"
          model:openai/gpt-4o-mini (LLM) - 5,263 tokens
        generate (solver span)
          model:openai/gpt-4o-mini (LLM) - 182 tokens
      scorers (from SpanBeginEvent)
        match (scorer span)
          score (EVALUATOR) - value: C
    sample:HWl2wp2B (CHAIN)
      ...
Each span type captures different data:
| Span Type | Data Captured |
|---|---|
| CHAIN | eval run, task, and sample lifecycle with scores and timing |
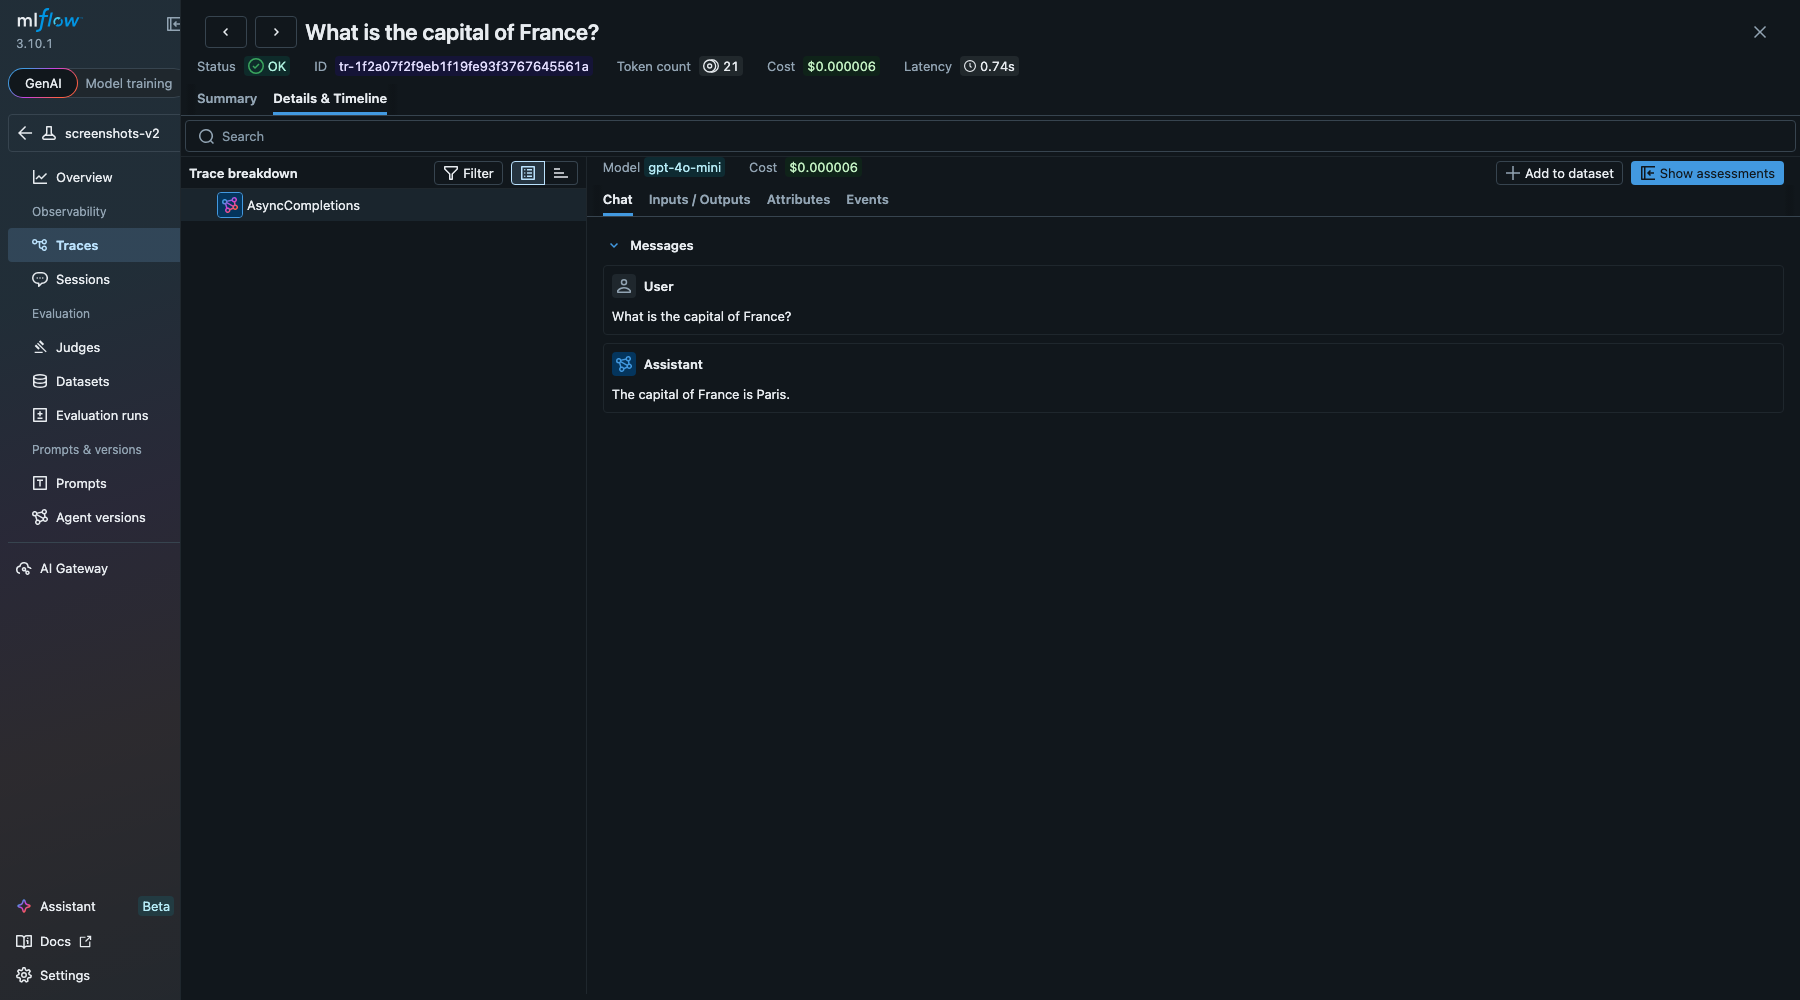
| LLM | model name, input/output token counts, temperature, cache status, response text |
| TOOL | function name, arguments, result, working time, errors |
| EVALUATOR | score value, explanation, target |
Full span tree with solver/scorer hierarchy and assessments panel:
LLM span detail with model name, token counts, and response:
Autolog
Autolog enables MLflow provider integrations at run start.
Supported providers are: openai, anthropic, langchain, litellm,
mistral, groq, cohere, gemini, bedrock.
Each provider is enabled only when both the MLflow flavor module and provider SDK are installed.
Artifact Tables
When artifact logging is enabled (INSPECT_MLFLOW_LOG_ARTIFACTS=true or
MLFLOW_INSPECT_LOG_ARTIFACTS=true), the tracking hook logs the following artifacts:
inspect/tasks.jsoninspect/samples.jsoninspect/messages.jsoninspect/sample_scores.jsoninspect/events.jsoninspect/model_usage.jsonsample_results/*.jsoneval_logs/*.json
Evaluation Comparison
Compare results from two evaluation runs to detect score regressions with statistical significance testing.
from inspect_mlflow.comparison import compare_evals

result = compare_evals("logs/baseline.eval", "logs/candidate.eval")
print(result.summary())

# Per-sample regressions
for r in result.regressions:
    print(f"Sample {r.id}: {r.baseline_score} -> {r.candidate_score}")
Output:
Baseline:  openai/gpt-4 (math_task)
Candidate: openai/gpt-4o-mini (math_task)
Samples:   5 aligned, 0 missing, 0 new

  Metric            Baseline  Candidate             Delta        Sig.
  -------------------------------------------------------------------
  match/accuracy      0.6000     0.5000   -0.1000 (-16.7%)  p=0.421
  Effect size (match/accuracy): Cohen's d = -0.32 (small effect)

Regressions: 1, Improvements: 0, Unchanged: 4
Candidate won on 0 of 5 samples (0.0%)
Cost:        $0.1234 -> $0.0210 (-$0.1024 (-83.0%))
Latency p95: 4.521s -> 1.937s (-2.584s (-57.2%))
The summary answers the "cheaper but how much worse?" question in one screen. Use this when picking between a stronger model and a cheaper one.
The comparison module aligns samples by (id, epoch), automatically selects the right significance test (McNemar's for binary scores, bootstrap CI for continuous), and computes Cohen's d effect size. No scipy required.
Features:
- Sample alignment with string/int ID normalization and multi-epoch support
- Regression threshold to filter noise (
regression_threshold=0.05) - Sample filtering (
sample_filter=lambda s: s.id in subset) - Win rate tracking across aligned samples
- Cost and latency deltas when the underlying logs carry cost or per-sample timing data (new in v0.8.0)
- Works with file paths or
EvalLogobjects directly
Configuration
Configuration is loaded from environment variables. When pydantic-settings is installed (pip install inspect-mlflow[config]), settings are typed and validated with the INSPECT_MLFLOW_ prefix. The same environment variables and boolean values work without it.
| Env var | Required | Default | Description |
|---|---|---|---|
MLFLOW_TRACKING_URI |
Yes | - | MLflow server URL |
INSPECT_MLFLOW_TRACKING_URI |
No | - | Tracking URI override (takes priority) |
INSPECT_MLFLOW_EXPERIMENT_NAME |
No | inspect_ai |
Experiment name override |
INSPECT_MLFLOW_TRACING_ENABLED |
No | false |
Tracing override |
MLFLOW_EXPERIMENT_NAME |
No | inspect_ai |
Experiment name |
MLFLOW_INSPECT_TRACING |
No | false |
Enable execution tracing |
MLFLOW_INSPECT_LOG_ARTIFACTS |
No | true |
Log eval artifacts |
INSPECT_MLFLOW_LOG_ARTIFACTS |
No | true |
Same as above (new prefix, takes priority) |
INSPECT_MLFLOW_AUTOLOG_ENABLED |
No | true |
Enable MLflow provider autolog integrations |
INSPECT_MLFLOW_AUTOLOG_MODELS |
No | openai,anthropic,langchain,litellm |
CSV or JSON array of providers to autolog |
Examples
Basic eval (tracking + tracing)
from inspect_ai import Task, eval
from inspect_ai.dataset import Sample
from inspect_ai.scorer import match
from inspect_ai.solver import generate

# No special imports needed. Hooks auto-register on install.

task = Task(
    dataset=[
        Sample(input="What is 2 + 2?", target="4"),
        Sample(input="What is 3 * 5?", target="15"),
        Sample(input="What is 10 - 7?", target="3"),
    ],
    solver=generate(),
    scorer=match(),
)

logs = eval(task, model="openai/gpt-4o-mini")
# MLflow now has: runs with metrics + traces with span tree
Eval with tool calls
from inspect_ai import Task, eval
from inspect_ai.dataset import Sample
from inspect_ai.scorer import match
from inspect_ai.solver import generate, use_tools
from inspect_ai.tool import tool


@tool
def multiply():
    """Multiply two numbers."""

    async def run(a: float, b: float) -> str:
        """Multiply a by b.

        Args:
            a: First number.
            b: Second number.
        """
        return f"{a * b:g}"

    return run


task = Task(
    dataset=[
        Sample(
            input="Use the multiply tool to compute 47 * 89.",
            target="4183",
        ),
        Sample(
            input="Use the multiply tool to compute 8 * 8.",
            target="64",
        ),
    ],
    solver=[use_tools([multiply()]), generate()],
    scorer=match(),
)

logs = eval(task, model="openai/gpt-4o-mini")
# Traces now include TOOL spans for each multiply() call
# with function name, arguments, and result
Development
git clone https://github.com/debu-sinha/inspect-mlflow.git
cd inspect-mlflow
uv sync --group dev
uv run pre-commit install
uv run pytest tests/ -v
See CONTRIBUTING.md for integration testing and PR guidelines.
Related
- Documentation - Full API reference and usage guide
- Inspect AI - AI evaluation framework by UK AI Security Institute
- MLflow - ML experiment tracking and model management
- Inspect AI hooks docs - How hooks work
- Issue #3547 - Original proposal
- Vector Institute inspect-mlflow - Related extension whose features are being consolidated here
Contributors
- Debu Sinha - Creator and maintainer
- Vector Institute / National Research Council of Canada (NRC) - Autolog provider support and structured Inspect artifact table logging, contributed on behalf of the Canadian AI Safety Institute (CAISI). Consolidated from VectorInstitute/inspect-mlflow.
1 maintainer

Metadata
1 maintainer
Release files for inspect-mlflow 0.8.1
For a detailed explanation of source distributions (sdists) and built distributions (wheels), please see the package formats documentation.
Source distribution (sdist)
| File | Size | Uploaded | |
|---|---|---|---|
| inspect_mlflow-0.8.1.tar.gz | 2.7 MB | Details |
Built distribution (wheel)
| File | Interpreter | ABI | Platform | Reset |
|---|---|---|---|---|
| inspect_mlflow-0.8.1-py3-none-any.whl | Python 3 | none | any | Details |
Total release size: 2.7 MB
Release files / inspect_mlflow-0.8.1.tar.gz
| Download URL | inspect_mlflow-0.8.1.tar.gz |
|---|---|
| Size | 2.7 MB |
| Tags | Source |
|
SHA-256 checksum How to use checksums |
7db8e943332beed8732c3bdfcbf004739d5dbec237a79bb367645cb87d52572e
|
|
BLAKE2b-256 checksum How to use checksums |
c693a1a0b3451e510970a5103e8a85fca2bf67c09a04f083f0043880e6ba20fb
|
| Upload date | |
|
Uploaded using Trusted Publishing? What is trusted publishing? |
Yes |
| Uploaded via |
twine/7.0.0 CPython/3.13.14
|
Provenance
Provenance describes where a file came from. On PyPI, provenance is shared via attestations, which provide a verifiable record of the build or publishing details. View details, limitations and caveats.


PyPI Publish Attestation
PyPI verified that this artifact, at this checksum, originated from the publisher listed below.
Signed by GitHub Actions, verified by PyPI on Sep 15, 2026.
Transparency logRelease files / inspect_mlflow-0.8.1-py3-none-any.whl
| Download URL | inspect_mlflow-0.8.1-py3-none-any.whl |
|---|---|
| Size | 38.2 kB |
| Tags | Python 3 |
|
SHA-256 checksum How to use checksums |
b01349bdc4bdd052169fdc359bffcd1d87a8198221b0b2e43b2510a0b92f404e
|
|
BLAKE2b-256 checksum How to use checksums |
480c4290c24f509762d7edc4511cb0525c97ba8ec2eb02bfc56c37eda665b6e8
|
| Upload date | |
|
Uploaded using Trusted Publishing? What is trusted publishing? |
Yes |
| Uploaded via |
twine/7.0.0 CPython/3.13.14
|
Provenance
Provenance describes where a file came from. On PyPI, provenance is shared via attestations, which provide a verifiable record of the build or publishing details. View details, limitations and caveats.
PyPI Publish Attestation
PyPI verified that this artifact, at this checksum, originated from the publisher listed below.
Signed by GitHub Actions, verified by PyPI on Sep 15, 2026.
Transparency log













