
lightweight-charts-python




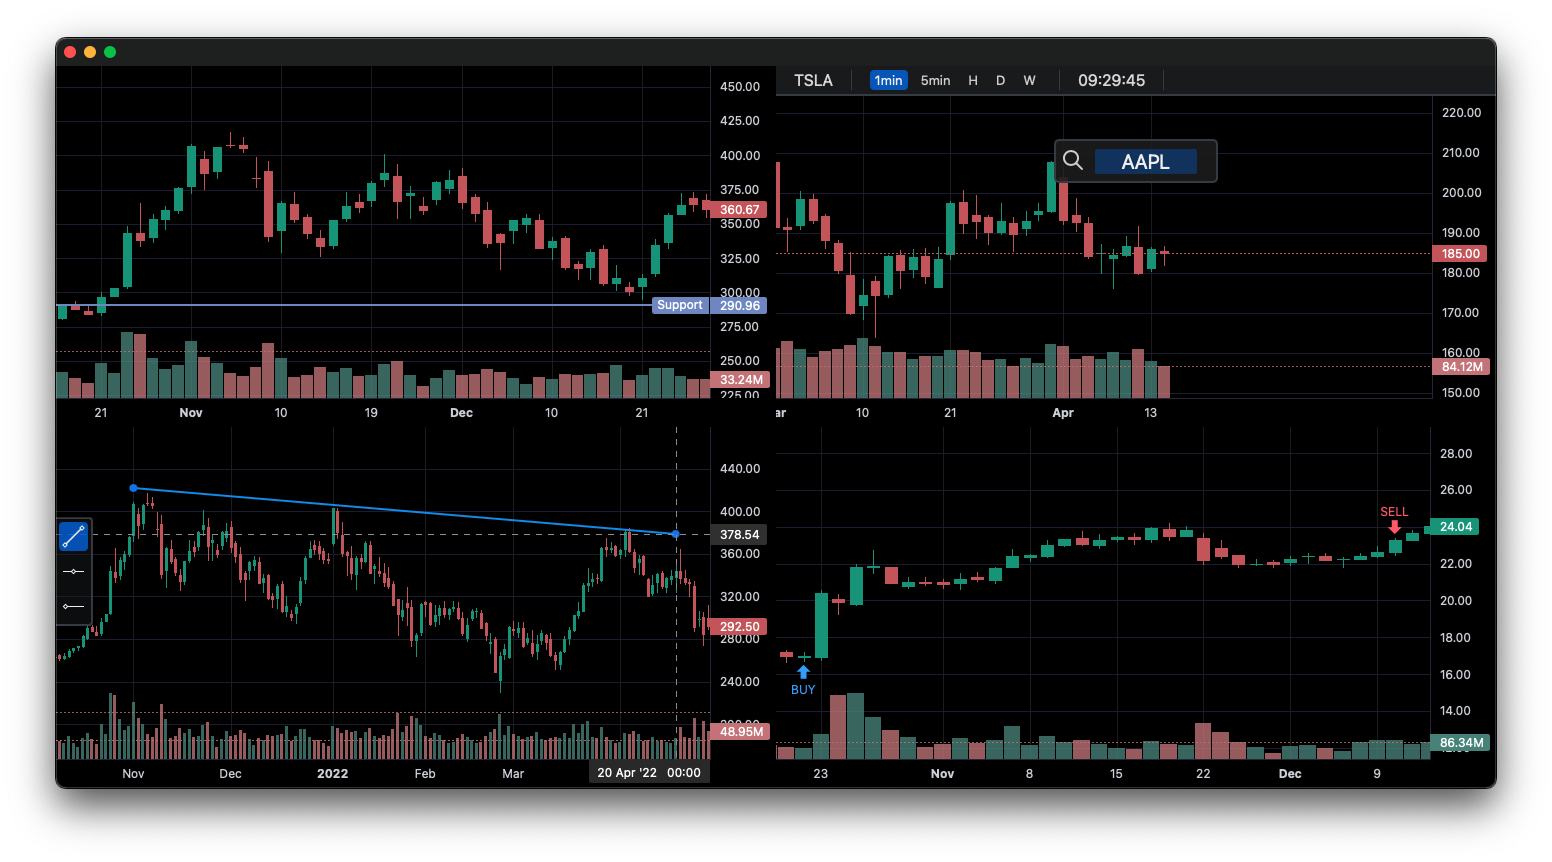
lightweight-charts-python aims to provide a simple and pythonic way to access and implement TradingView's Lightweight Charts.
Installation
pip install lightweight-charts
Features
- Streamlined for live data, with methods for updating directly from tick data.
- Multi-pane charts using Subcharts.
- The Toolbox, allowing for trendlines, rectangles, rays and horizontal lines to be drawn directly onto charts.
- Events allowing for timeframe selectors (1min, 5min, 30min etc.), searching, hotkeys, and more.
- Tables for watchlists, order entry, and trade management.
- Direct integration of market data through Polygon.io's market data API.
Supports: Jupyter Notebooks, PyQt6, PyQt5, PySide6, wxPython, Streamlit, and asyncio.
PartTimeLarry: Interactive Brokers API and TradingView Charts in Python
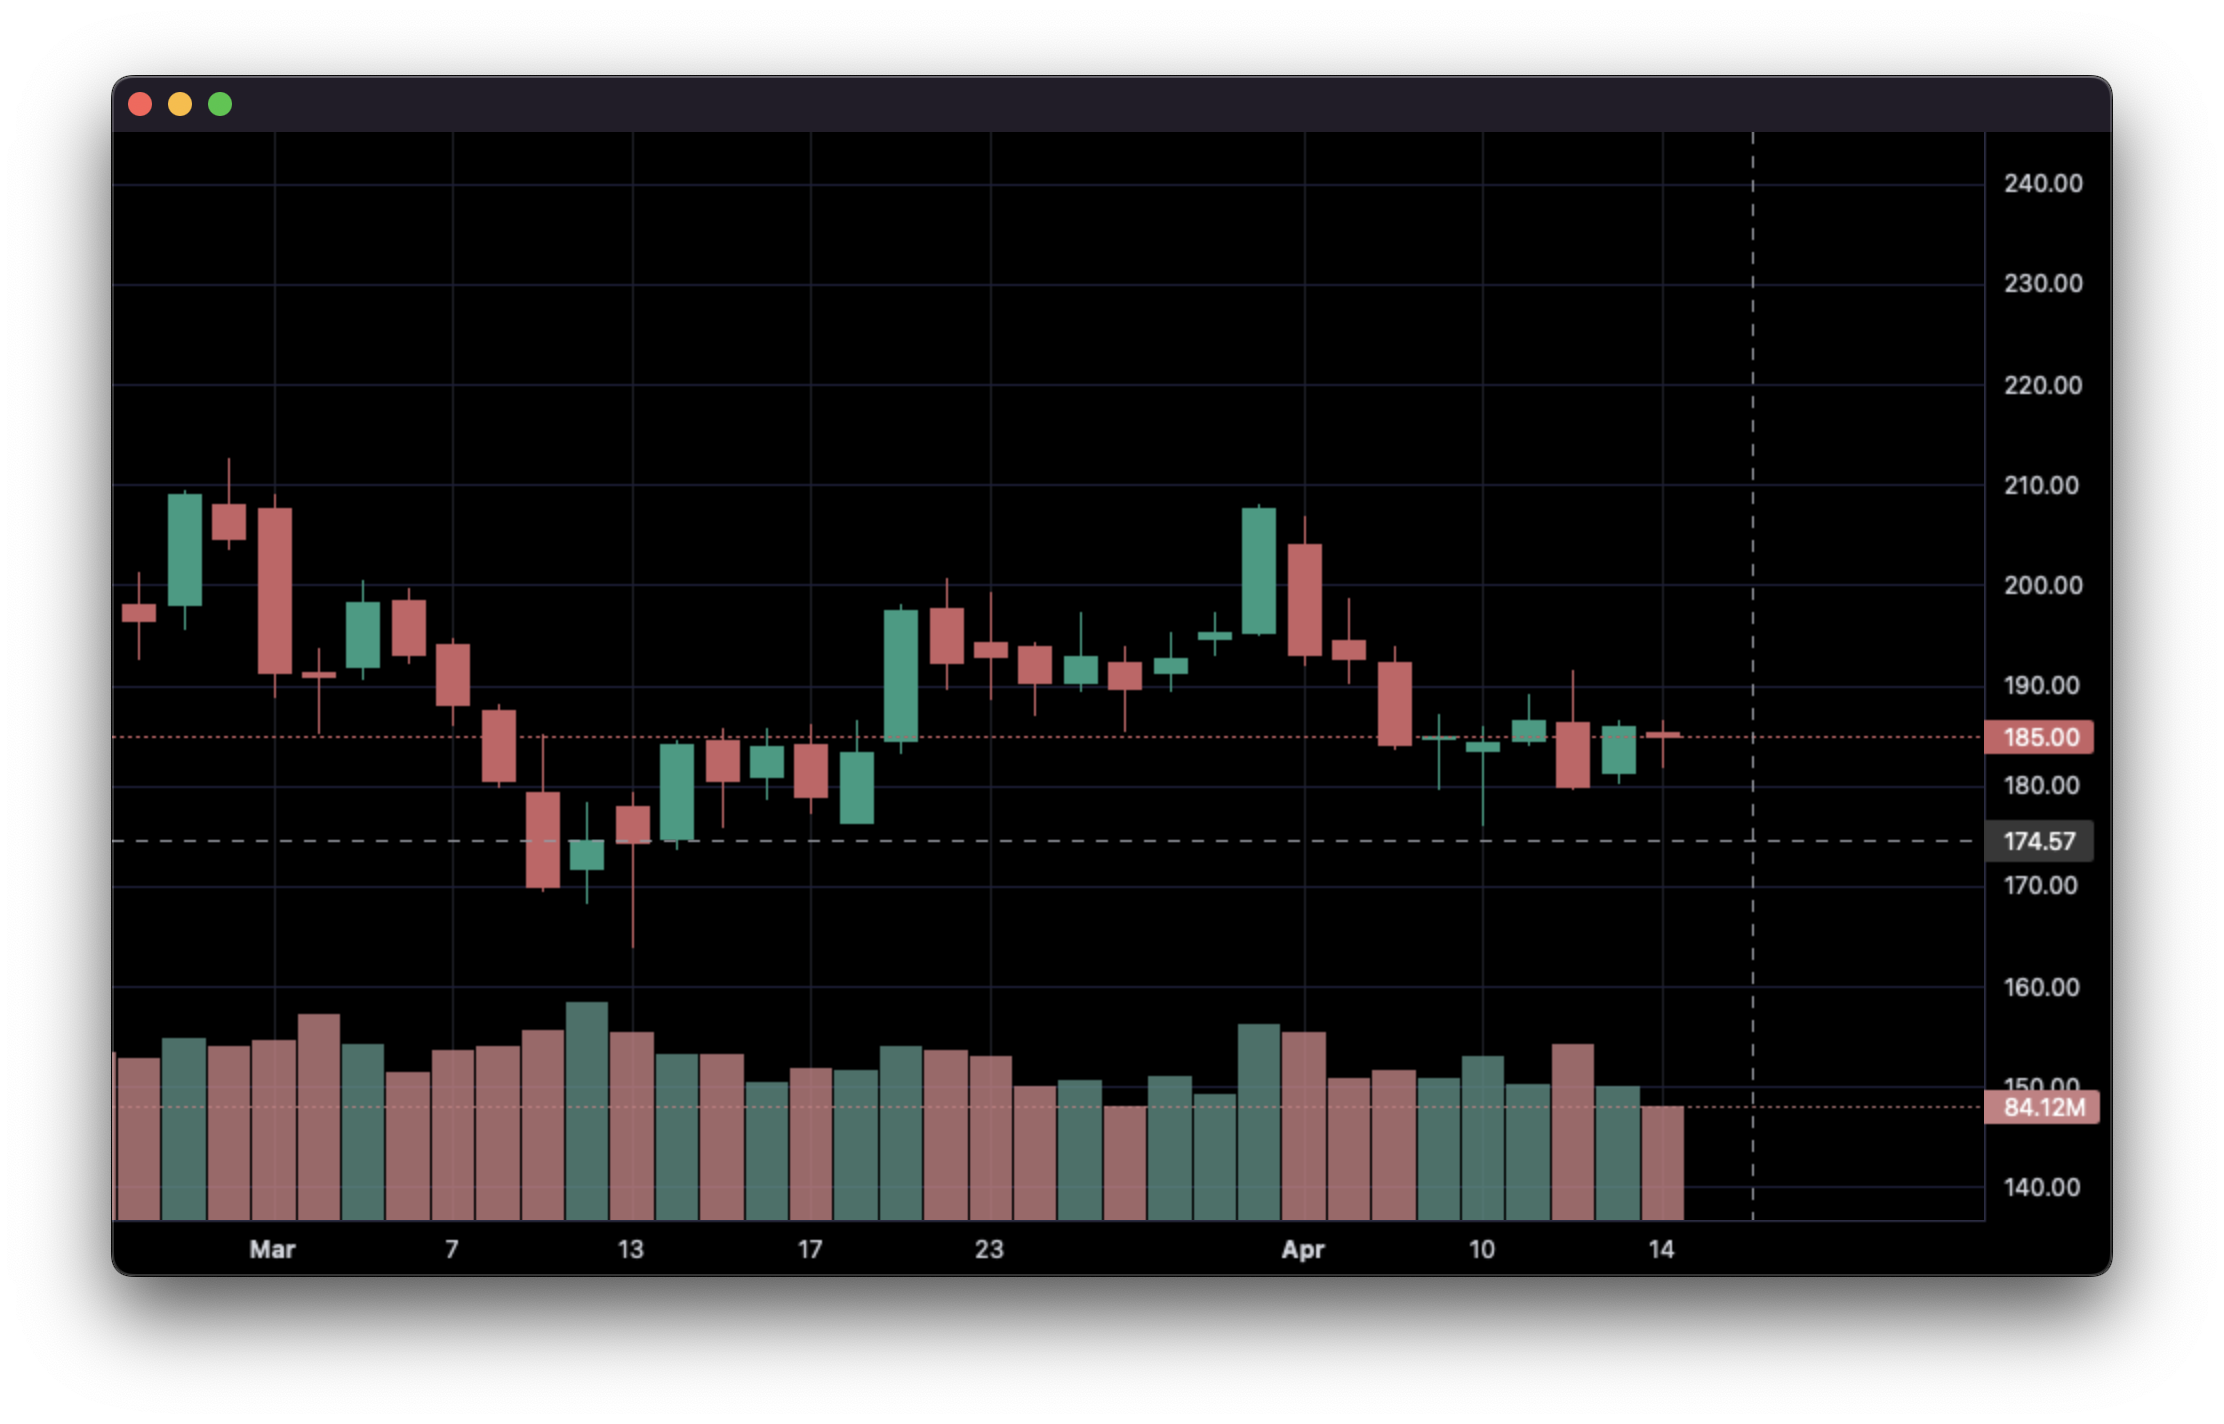
1. Display data from a csv:
import pandas as pd
from lightweight_charts import Chart


if __name__ == '__main__':

    chart = Chart()

    # Columns: time | open | high | low | close | volume
    df = pd.read_csv('ohlcv.csv')
    chart.set(df)

    chart.show(block=True)
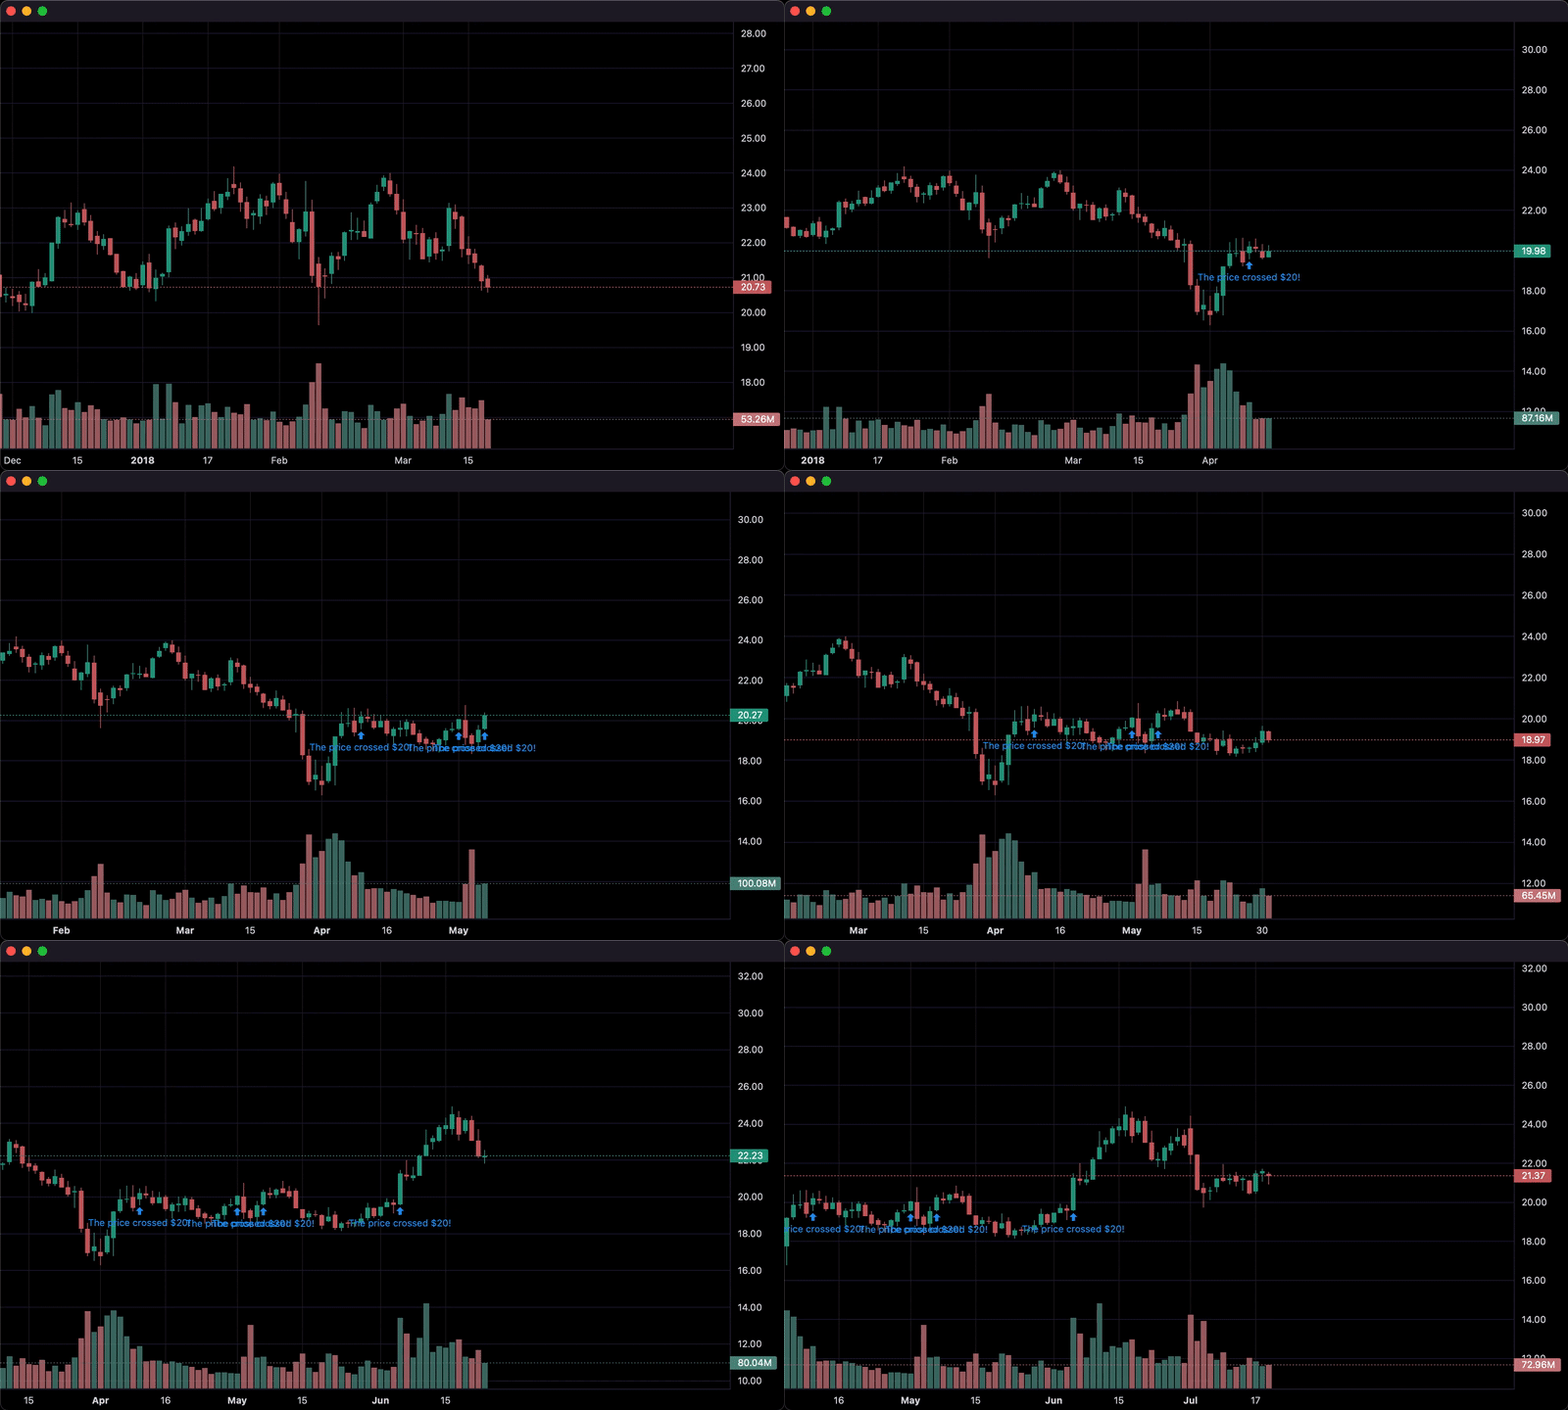
2. Updating bars in real-time:
import pandas as pd
from time import sleep
from lightweight_charts import Chart

if __name__ == '__main__':

    chart = Chart()

    df1 = pd.read_csv('ohlcv.csv')
    df2 = pd.read_csv('next_ohlcv.csv')

    chart.set(df1)

    chart.show()

    last_close = df1.iloc[-1]['close']

    for i, series in df2.iterrows():
        chart.update(series)

        if series['close'] > 20 and last_close < 20:
            chart.marker(text='The price crossed $20!')

        last_close = series['close']
        sleep(0.1)
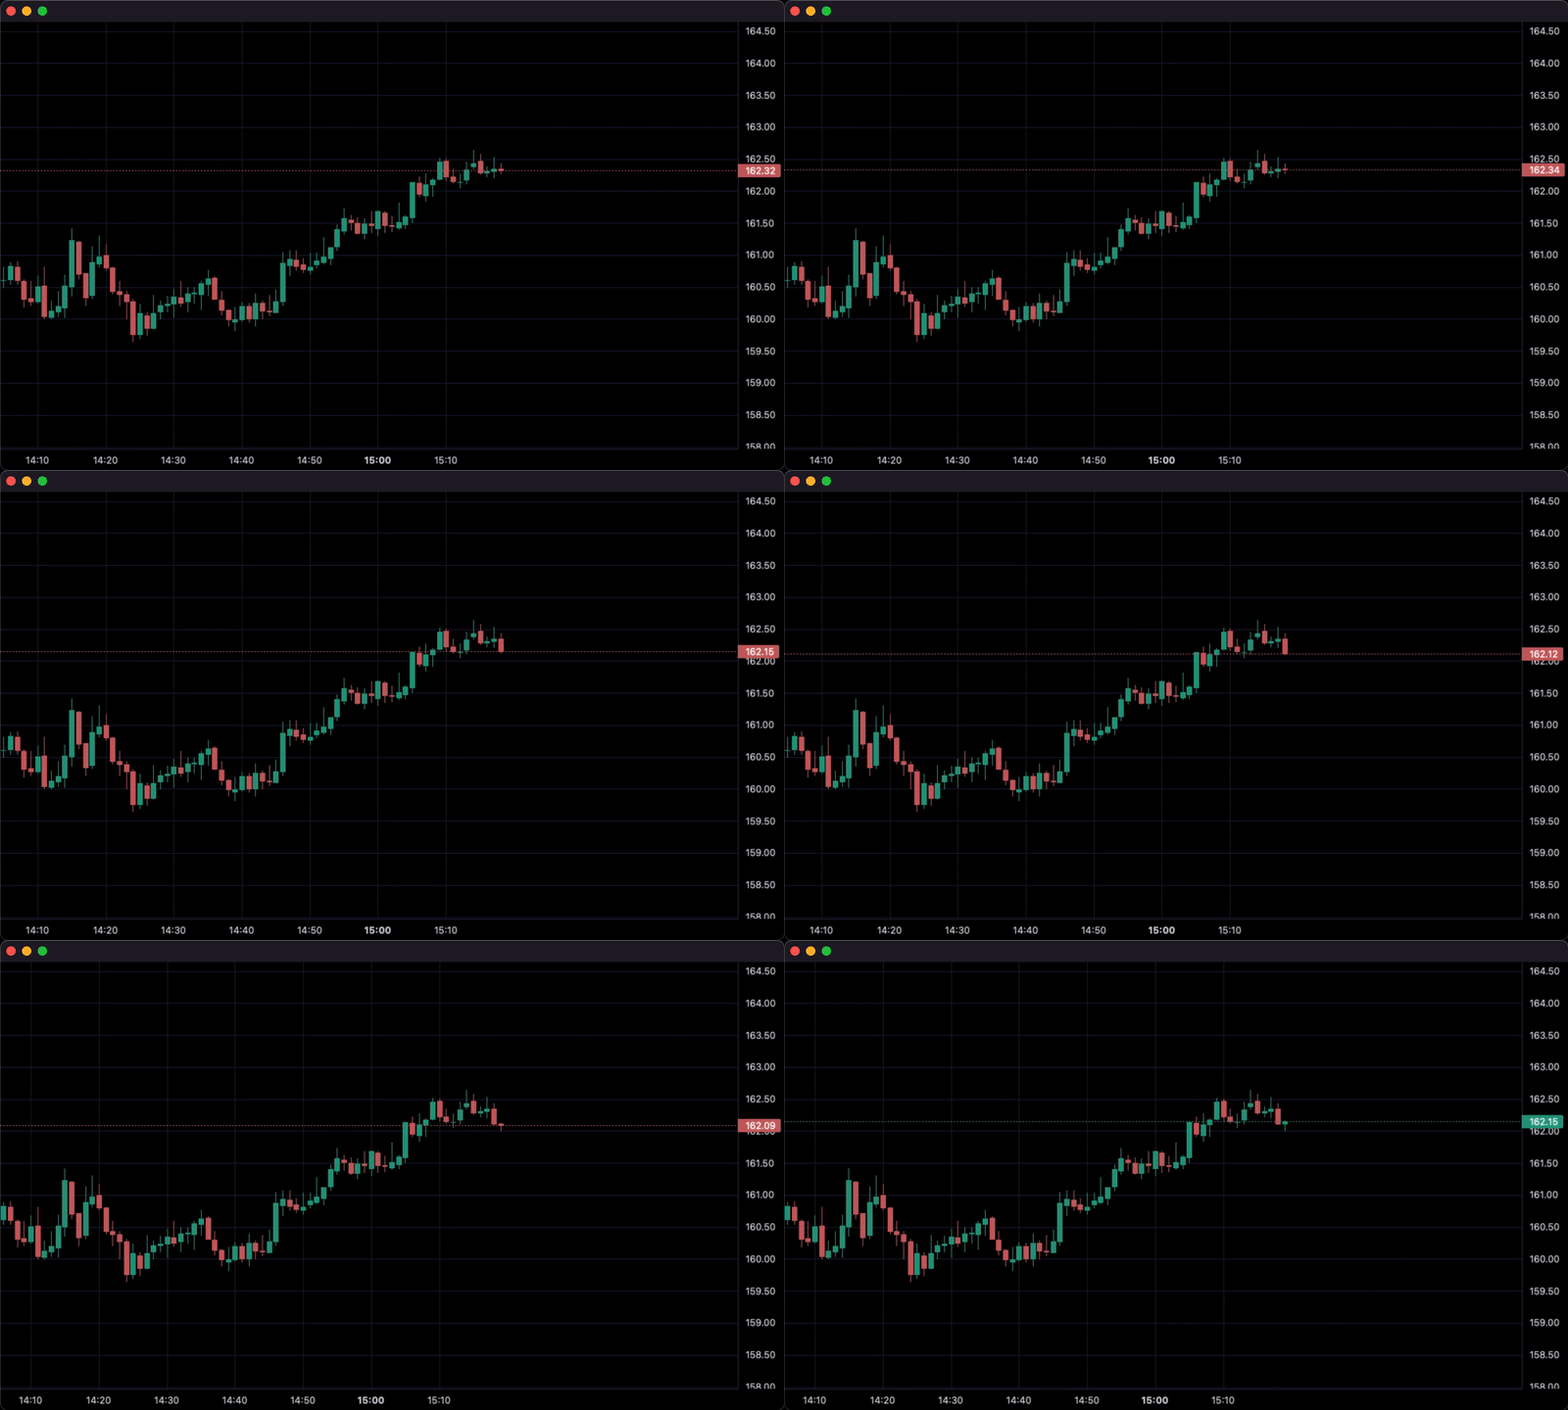
3. Updating bars from tick data in real-time:
import pandas as pd
from time import sleep
from lightweight_charts import Chart


if __name__ == '__main__':

    df1 = pd.read_csv('ohlc.csv')

    # Columns: time | price
    df2 = pd.read_csv('ticks.csv')

    chart = Chart()

    chart.set(df1)

    chart.show()

    for i, tick in df2.iterrows():
        chart.update_from_tick(tick)

        sleep(0.03)
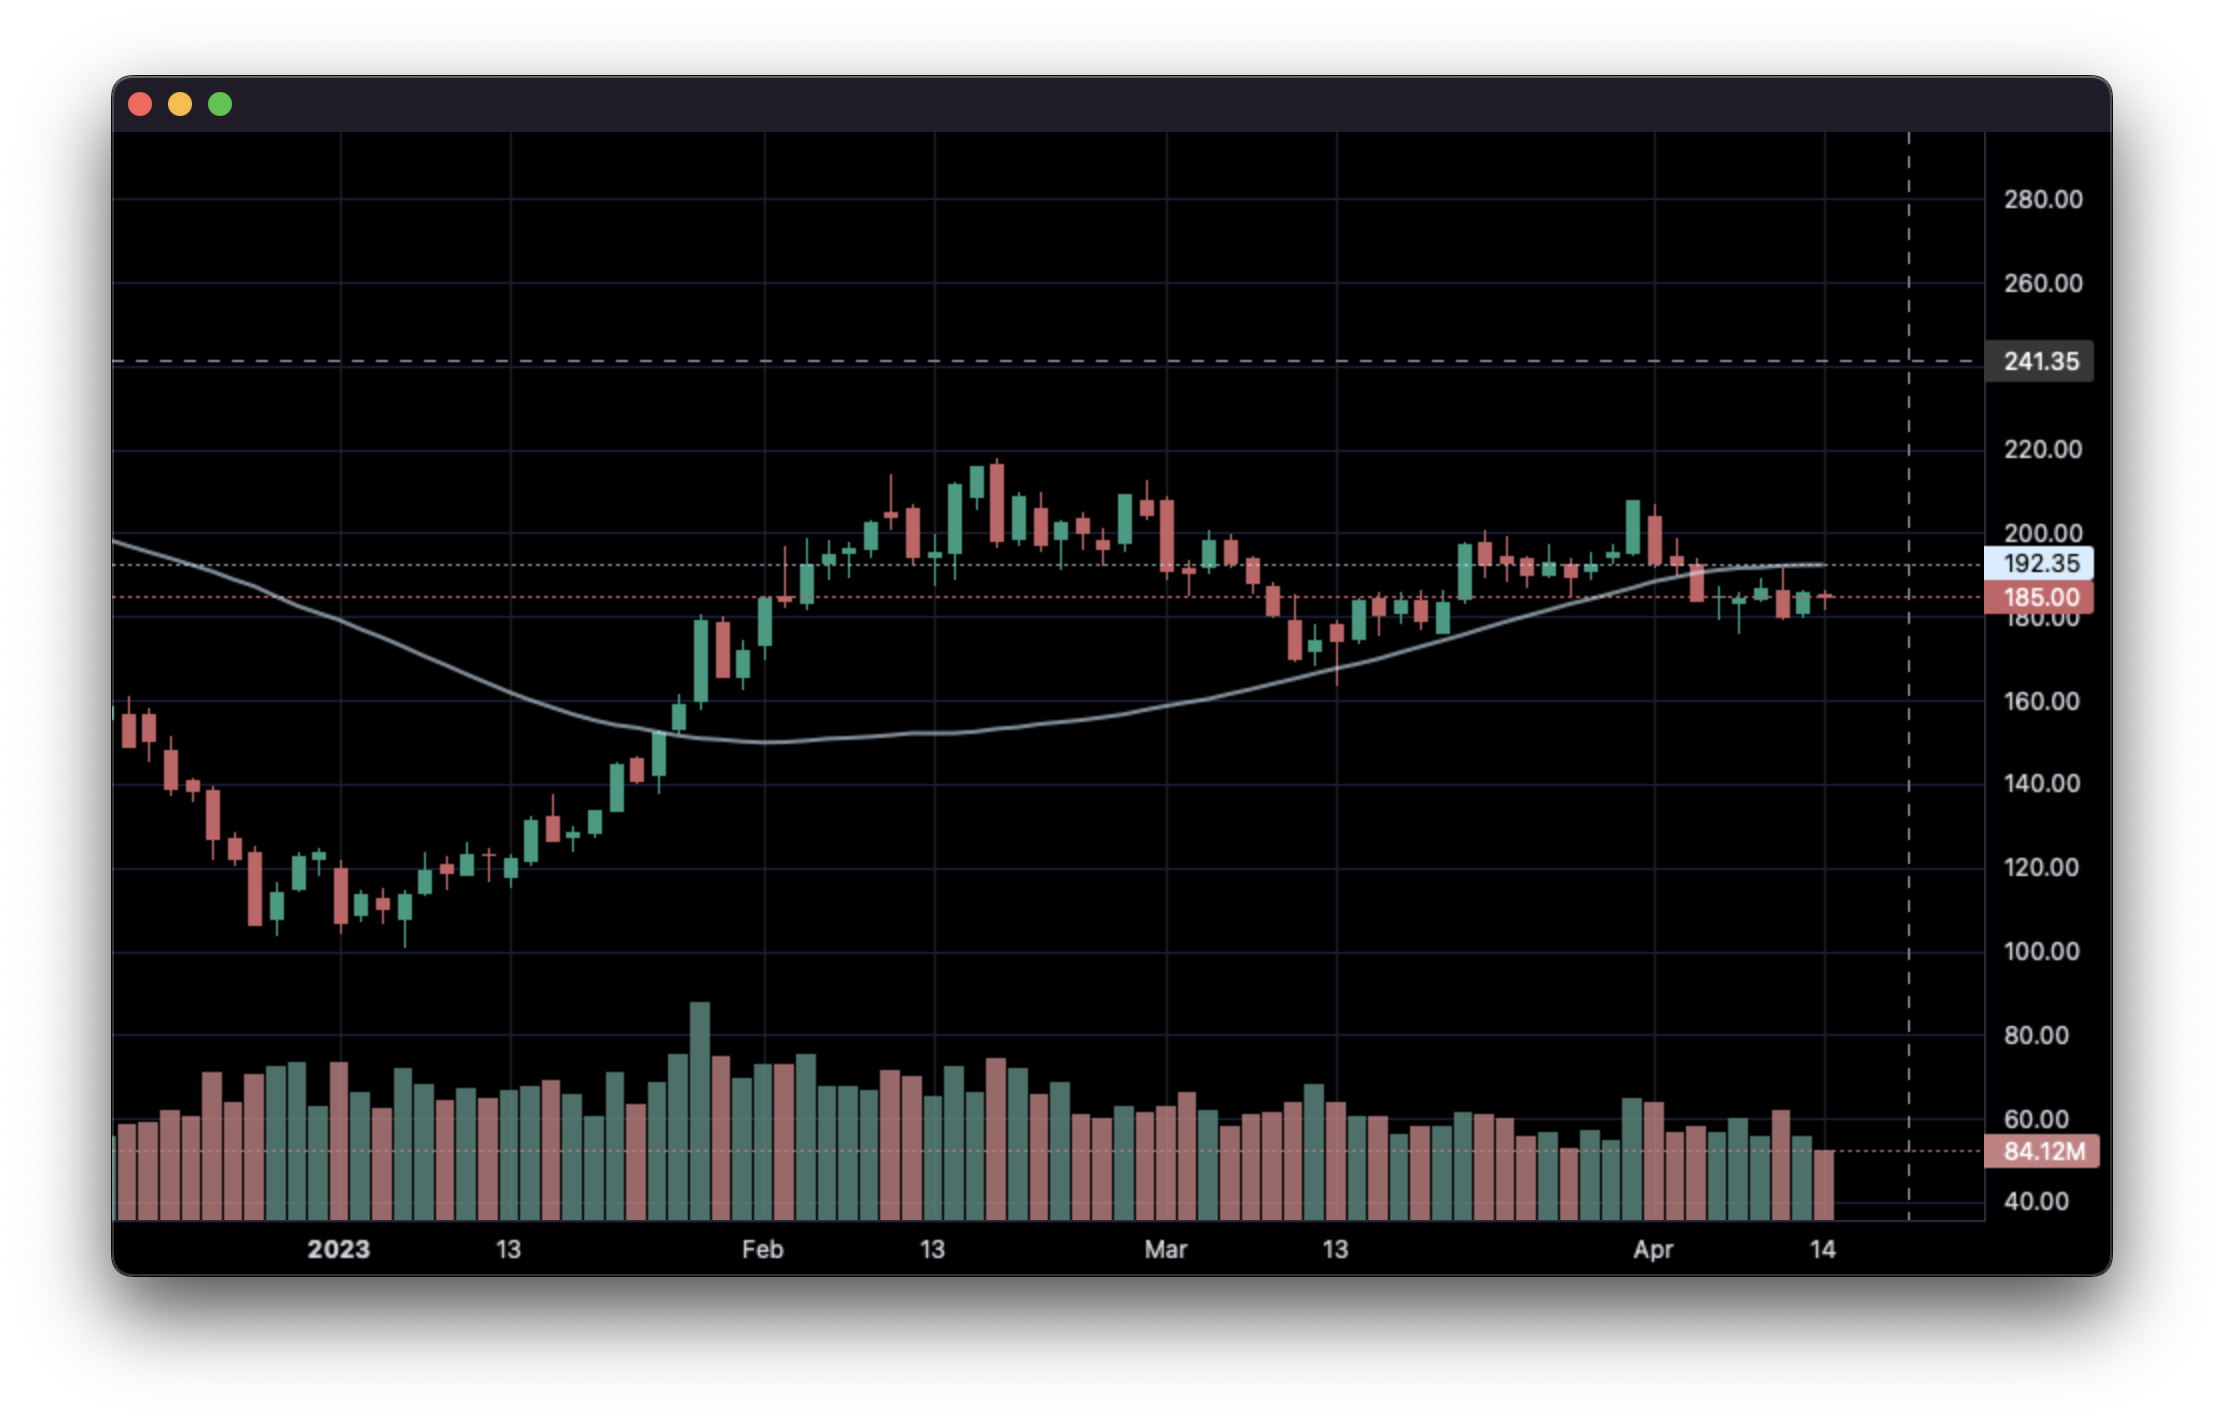
4. Line Indicators:
import pandas as pd
from lightweight_charts import Chart


def calculate_sma(df, period: int = 50):
    return pd.DataFrame({
        'time': df['date'],
        f'SMA {period}': df['close'].rolling(window=period).mean()
    }).dropna()


if __name__ == '__main__':
    chart = Chart()
    chart.legend(visible=True)

    df = pd.read_csv('ohlcv.csv')
    chart.set(df)

    line = chart.create_line('SMA 50')
    sma_data = calculate_sma(df, period=50)
    line.set(sma_data)

    chart.show(block=True)
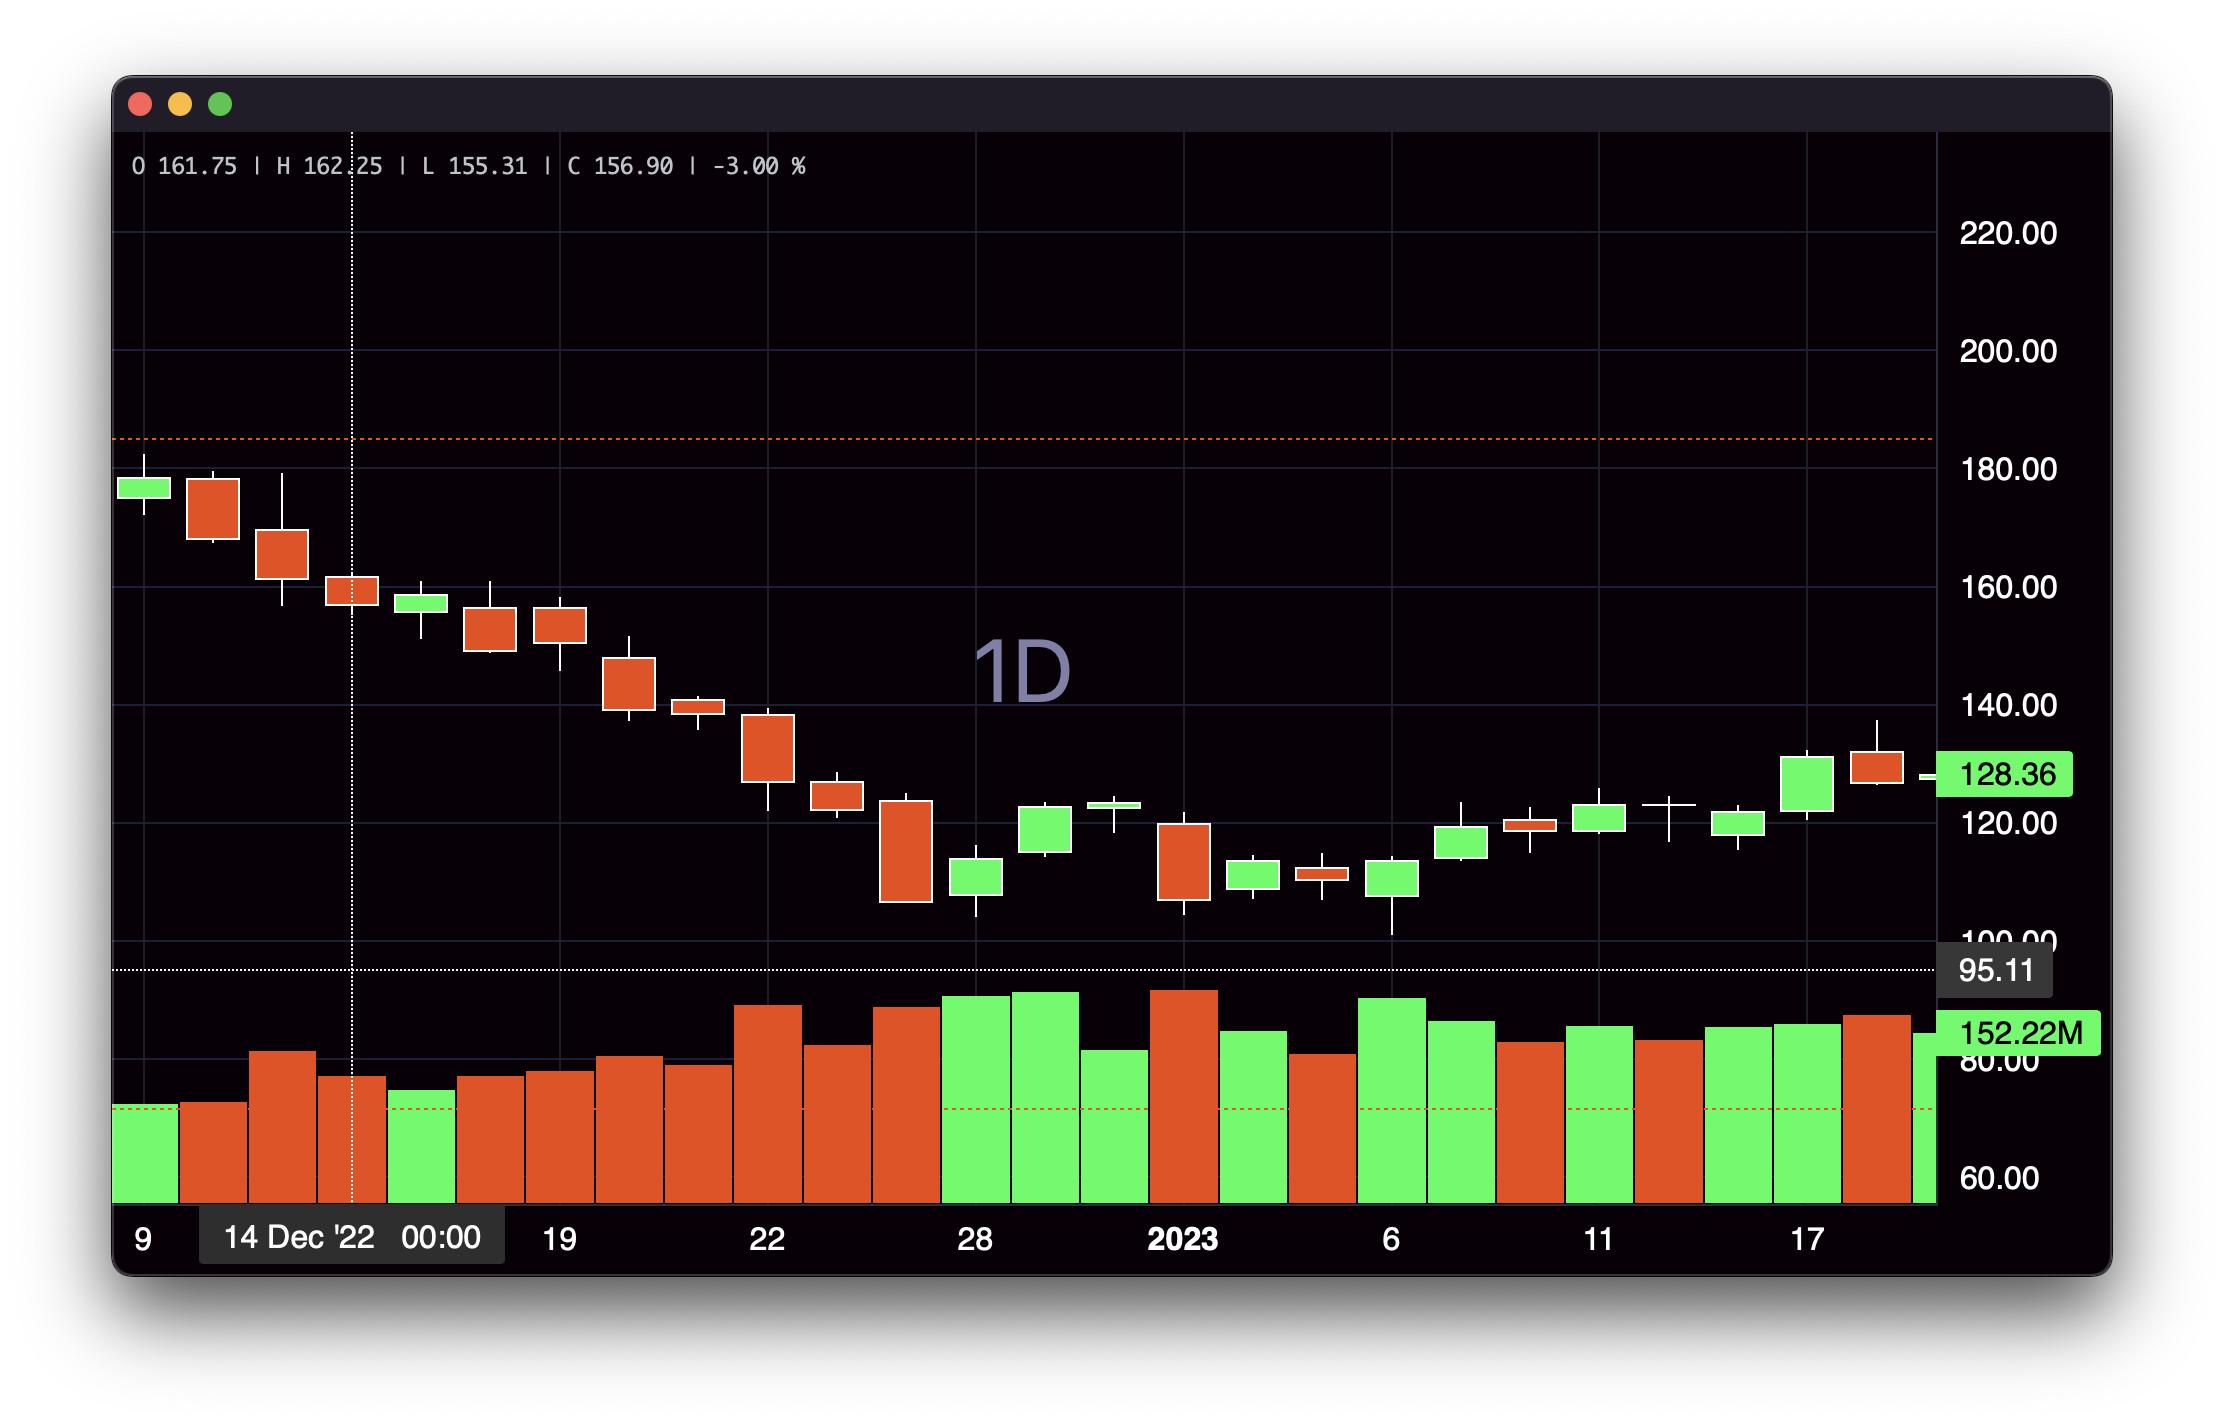
5. Styling:
import pandas as pd
from lightweight_charts import Chart


if __name__ == '__main__':

    chart = Chart()

    df = pd.read_csv('ohlcv.csv')

    chart.layout(background_color='#090008', text_color='#FFFFFF', font_size=16,
                 font_family='Helvetica')

    chart.candle_style(up_color='#00ff55', down_color='#ed4807',
                       border_up_color='#FFFFFF', border_down_color='#FFFFFF',
                       wick_up_color='#FFFFFF', wick_down_color='#FFFFFF')

    chart.volume_config(up_color='#00ff55', down_color='#ed4807')

    chart.watermark('1D', color='rgba(180, 180, 240, 0.7)')

    chart.crosshair(mode='normal', vert_color='#FFFFFF', vert_style='dotted',
                    horz_color='#FFFFFF', horz_style='dotted')

    chart.legend(visible=True, font_size=14)

    chart.set(df)

    chart.show(block=True)
6. Callbacks:
import pandas as pd
from lightweight_charts import Chart


def get_bar_data(symbol, timeframe):
    if symbol not in ('AAPL', 'GOOGL', 'TSLA'):
        print(f'No data for "{symbol}"')
        return pd.DataFrame()
    return pd.read_csv(f'bar_data/{symbol}_{timeframe}.csv')


def on_search(chart, searched_string):  # Called when the user searches.
    new_data = get_bar_data(searched_string, chart.topbar['timeframe'].value)
    if new_data.empty:
        return
    chart.topbar['symbol'].set(searched_string)
    chart.set(new_data)


def on_timeframe_selection(chart):  # Called when the user changes the timeframe.
    new_data = get_bar_data(chart.topbar['symbol'].value, chart.topbar['timeframe'].value)
    if new_data.empty:
        return
    chart.set(new_data, True)


def on_horizontal_line_move(chart, line):
    print(f'Horizontal line moved to: {line.price}')


if __name__ == '__main__':
    chart = Chart(toolbox=True)
    chart.legend(True)

    chart.events.search += on_search

    chart.topbar.textbox('symbol', 'TSLA')
    chart.topbar.switcher('timeframe', ('1min', '5min', '30min'), default='5min',
                          func=on_timeframe_selection)

    df = get_bar_data('TSLA', '5min')
    chart.set(df)

    chart.horizontal_line(200, func=on_horizontal_line_move)

    chart.show(block=True)

Inquiries: shaders_worker_0e@icloud.com
This package is an independent creation and has not been endorsed, sponsored, or approved by TradingView. The author of this package does not have any official relationship with TradingView, and the package does not represent the views or opinions of TradingView.
1 maintainer

Metadata
1 maintainer
Release files for lightweight-charts 2.1
For a detailed explanation of source distributions (sdists) and built distributions (wheels), please see the package formats documentation.
Source distribution (sdist)
| File | Size | Uploaded | |
|---|---|---|---|
| lightweight_charts-2.1.tar.gz | 94.9 kB | Details |
Built distribution (wheel)
| File | Interpreter | ABI | Platform | Reset |
|---|---|---|---|---|
| lightweight_charts-2.1-py3-none-any.whl | Python 3 | none | any | Details |
Total release size: 191.2 kB
Release files / lightweight_charts-2.1.tar.gz
| Download URL | lightweight_charts-2.1.tar.gz |
|---|---|
| Size | 94.9 kB |
| Tags | Source |
|
SHA-256 checksum How to use checksums |
ea269a57d1a5a638999378b0e291f471c0642ae85f55d32f03eb6a85b96d0f7f
|
|
BLAKE2b-256 checksum How to use checksums |
e09e70868fb8614f02c1320798917bd5f6f9278e8471c0c459d4a87b50879bb3
|
| Upload date | |
|
Uploaded using Trusted Publishing? What is trusted publishing? |
No |
| Uploaded via |
twine/5.1.1 CPython/3.12.0
|
Release files / lightweight_charts-2.1-py3-none-any.whl
| Download URL | lightweight_charts-2.1-py3-none-any.whl |
|---|---|
| Size | 96.3 kB |
| Tags | Python 3 |
|
SHA-256 checksum How to use checksums |
4c5598fd57ac7569c3fed733727e2033190ca2f6e2460223d27e0926be7bff4f
|
|
BLAKE2b-256 checksum How to use checksums |
f212f225e2140d49bdb4f43c5bd7b766ad6b52dc1c1c93f9c8f81700330cc69a
|
| Upload date | |
|
Uploaded using Trusted Publishing? What is trusted publishing? |
No |
| Uploaded via |
twine/5.1.1 CPython/3.12.0
|














