Python framework for TradingView's Lightweight Charts JavaScript library.

Project description
lightweight-charts-python


lightweight-charts-python aims to provide a simple and pythonic way to access and implement TradingView's Lightweight Charts.
Installation
pip install lightweight-charts
- White screen? Having issues with pywebview? Click here.
Features
- Simple and easy to use.
- Blocking or non-blocking GUI.
- Streamlined for live data, with methods for updating directly from tick data.
- Supports: Jupyter Notebooks, PyQt, wxPython, Streamlit, and asyncio.
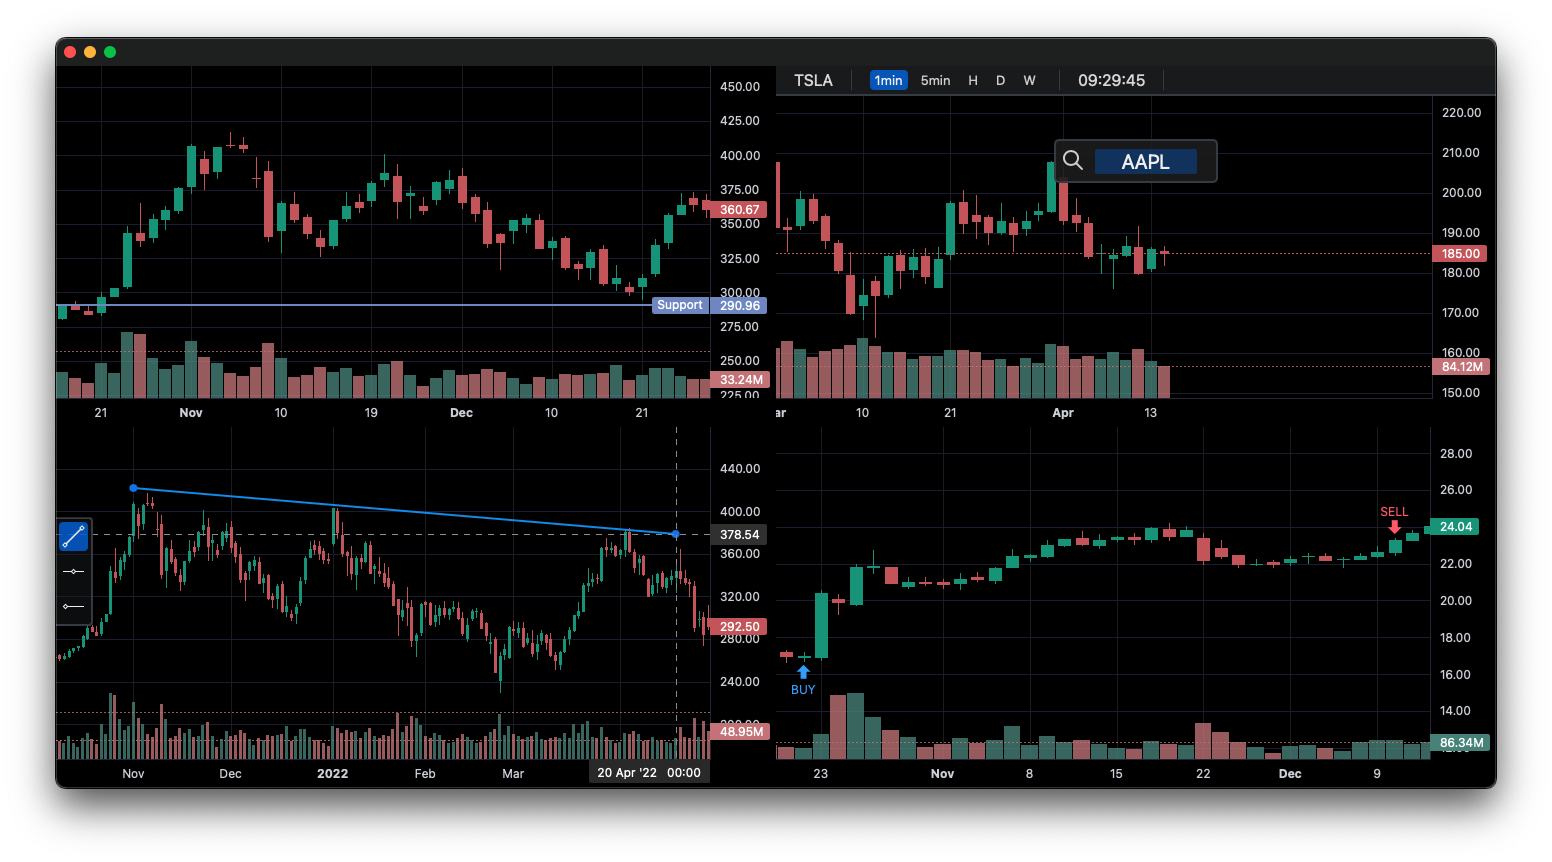
- Callbacks allowing for timeframe (1min, 5min, 30min etc.) selectors, searching, and more.
- Multi-Pane Charts using the
SubChart. - Direct integration of market data through Polygon.io's market data API.
1. Display data from a csv:
import pandas as pd
from lightweight_charts import Chart


if __name__ == '__main__':

    chart = Chart()

    # Columns: | time | open | high | low | close | volume (if volume is enabled) |
    df = pd.read_csv('ohlcv.csv')
    chart.set(df)

    chart.show(block=True)
2. Updating bars in real-time:
import pandas as pd
from time import sleep
from lightweight_charts import Chart

if __name__ == '__main__':

    chart = Chart()

    df1 = pd.read_csv('ohlcv.csv')
    df2 = pd.read_csv('next_ohlcv.csv')

    chart.set(df1)

    chart.show()

    last_close = df1.iloc[-1]

    for i, series in df2.iterrows():
        chart.update(series)

        if series['close'] > 20 and last_close < 20:
            chart.marker(text='The price crossed $20!')

        last_close = series['close']
        sleep(0.1)
3. Updating bars from tick data in real-time:
import pandas as pd
from time import sleep
from lightweight_charts import Chart


if __name__ == '__main__':

    df1 = pd.read_csv('ohlc.csv')

    # Columns: | time | price | volume (if volume is enabled) |
    df2 = pd.read_csv('ticks.csv')

    chart = Chart(volume_enabled=False)

    chart.set(df1)

    chart.show()

    for i, tick in df2.iterrows():
        chart.update_from_tick(tick)

        sleep(0.3)
4. Line Indicators:
import pandas as pd
from lightweight_charts import Chart


def calculate_sma(data: pd.DataFrame, period: int = 50):
   def avg(d: pd.DataFrame):
      return d['close'].mean()

   result = []
   for i in range(period - 1, len(data)):
      val = avg(data.iloc[i - period + 1:i])
      result.append({'time': data.iloc[i]['date'], 'value': val})
   return pd.DataFrame(result)


if __name__ == '__main__':
   chart = Chart()

   df = pd.read_csv('ohlcv.csv')
   chart.set(df)

   line = chart.create_line()
   sma_data = calculate_sma(df)
   line._set(sma_data)

   chart.show(block=True)
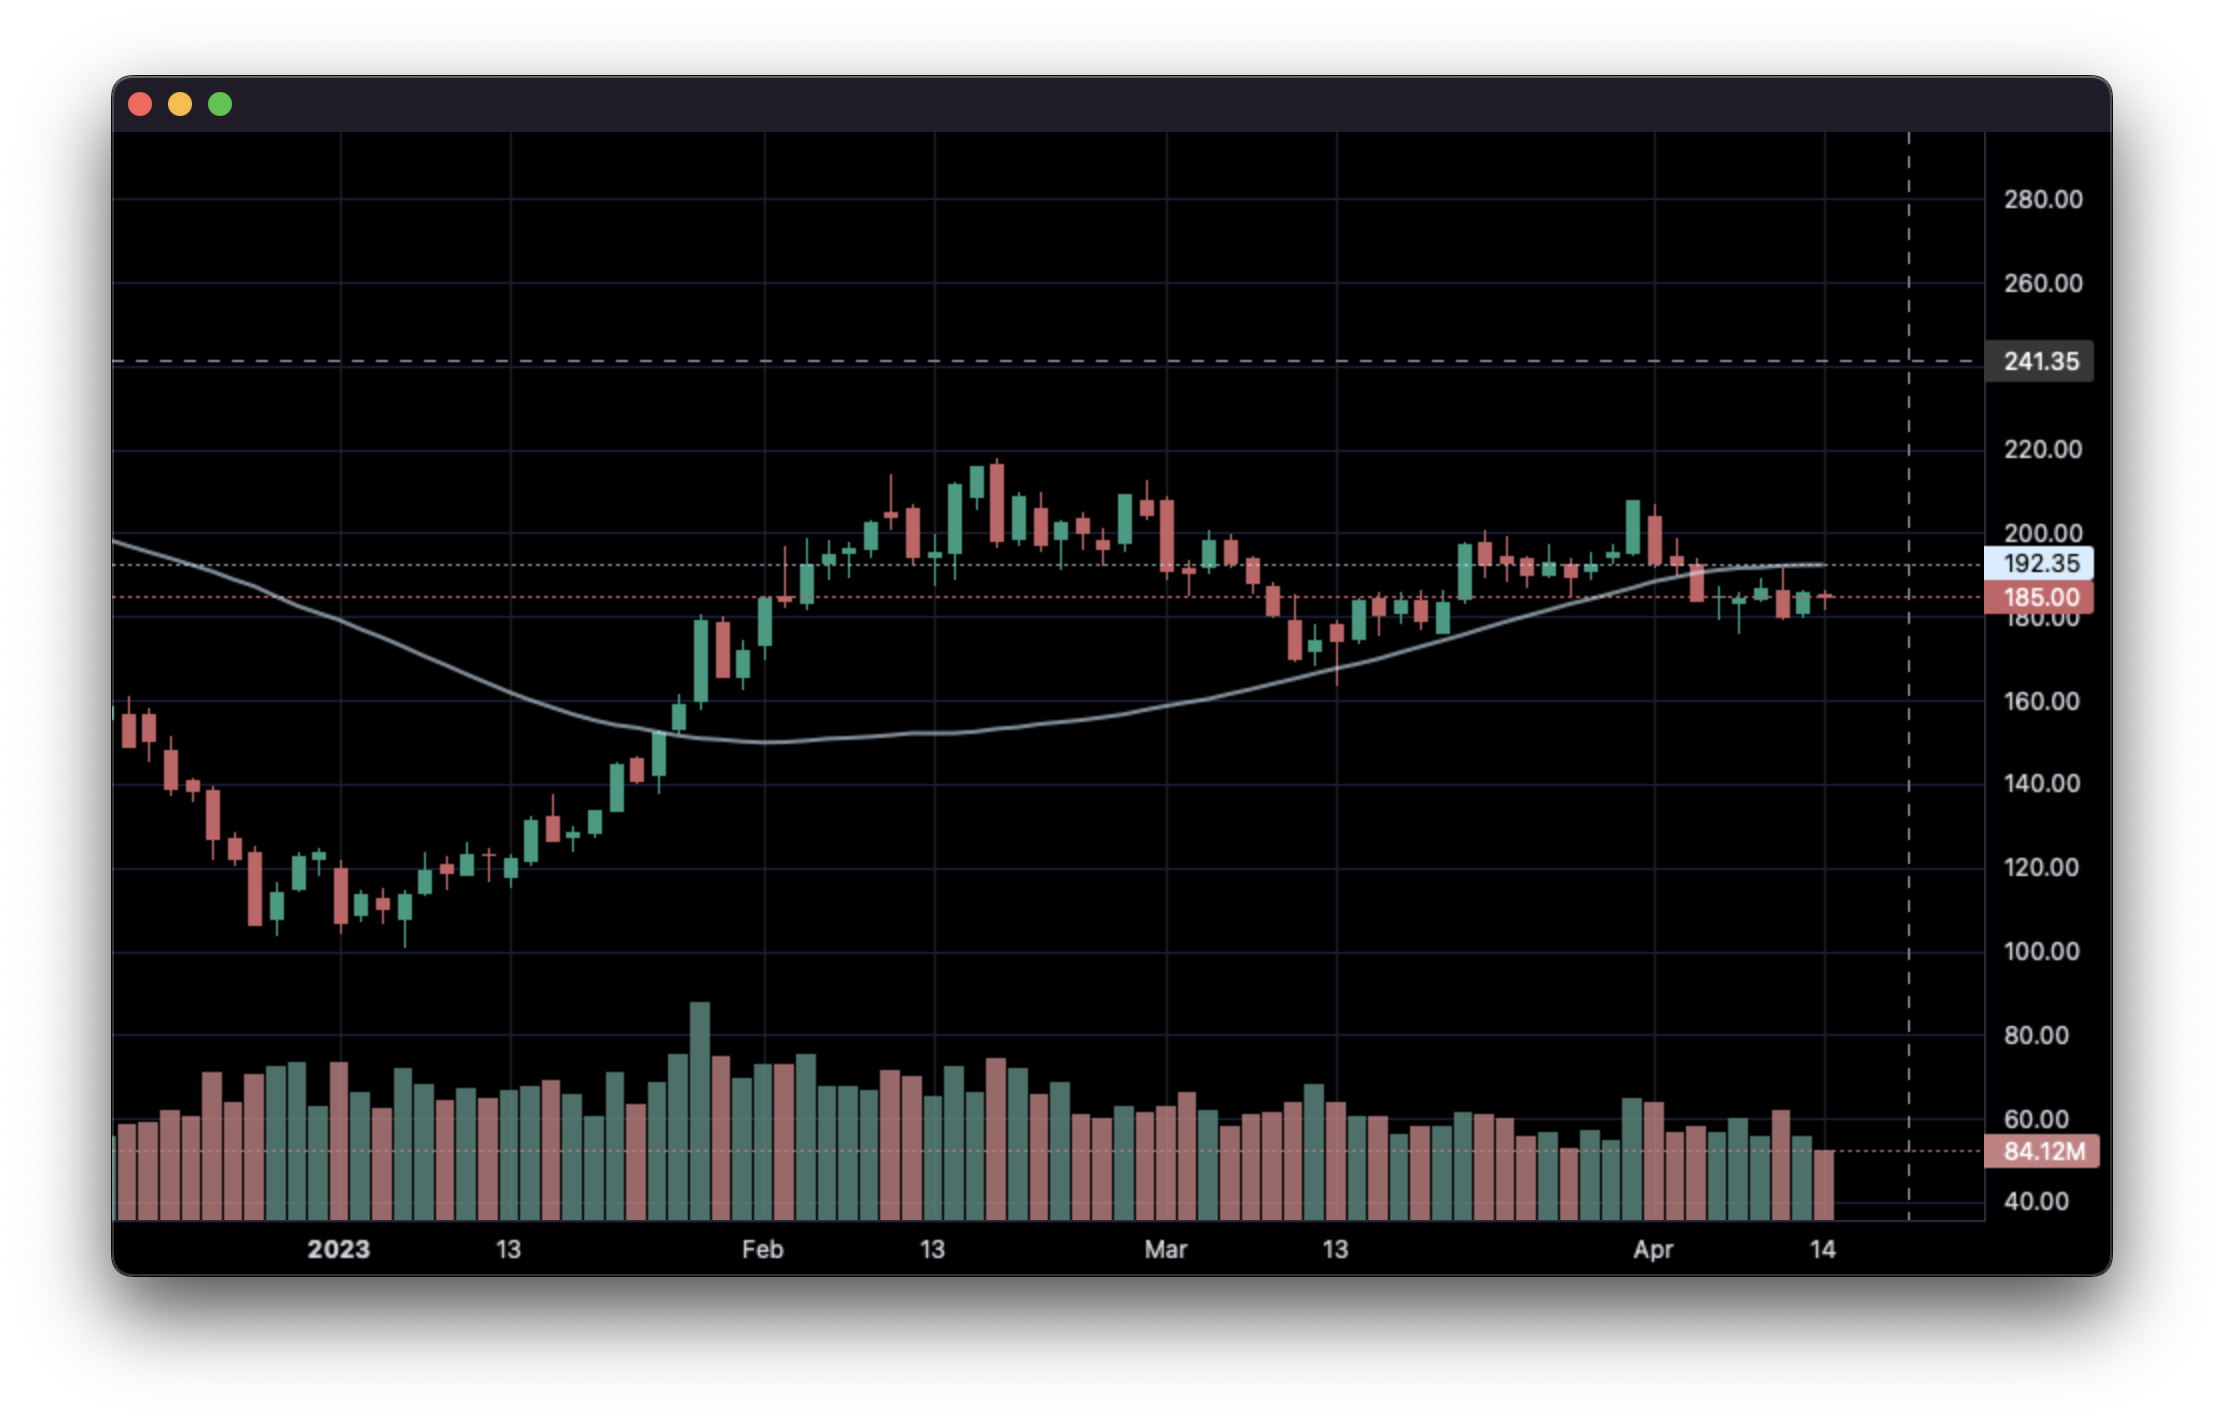
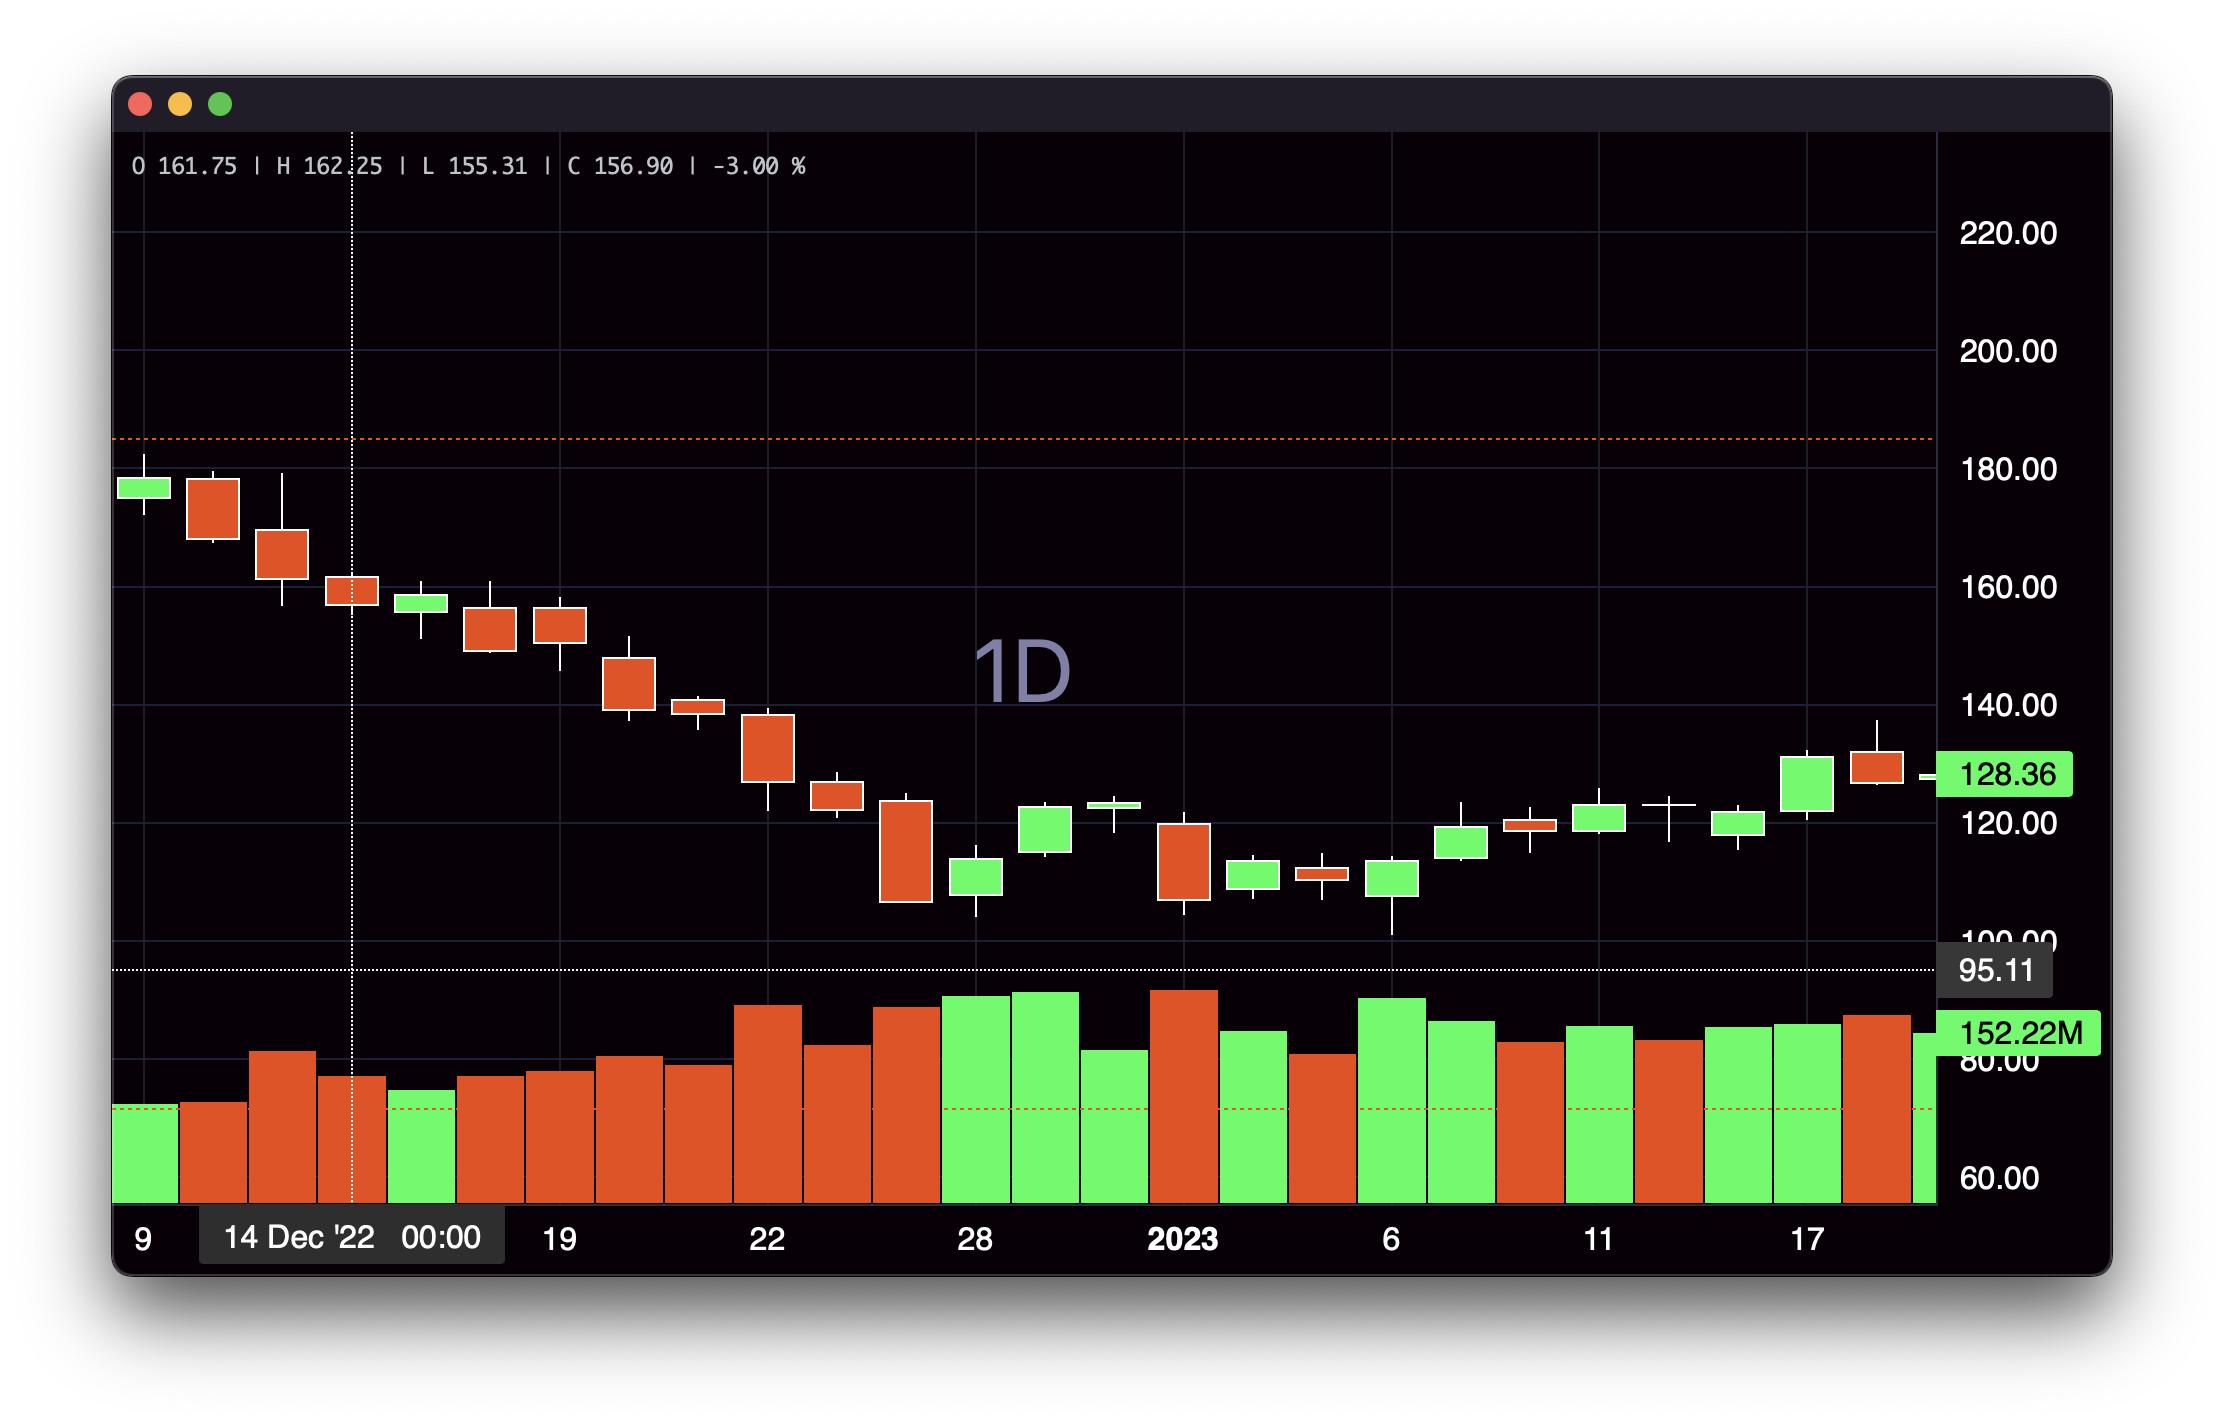
5. Styling:
import pandas as pd
from lightweight_charts import Chart


if __name__ == '__main__':

    chart = Chart(debug=True)

    df = pd.read_csv('ohlcv.csv')

    chart.layout(background_color='#090008', text_color='#FFFFFF', font_size=16,
                 font_family='Helvetica')

    chart.candle_style(up_color='#00ff55', down_color='#ed4807',
                       border_up_color='#FFFFFF', border_down_color='#FFFFFF',
                       wick_up_color='#FFFFFF', wick_down_color='#FFFFFF')

    chart.volume_config(up_color='#00ff55', down_color='#ed4807')

    chart.watermark('1D', color='rgba(180, 180, 240, 0.7)')

    chart.crosshair(mode='normal', vert_color='#FFFFFF', vert_style='dotted',
                    horz_color='#FFFFFF', horz_style='dotted')

    chart.legend(visible=True, font_size=14)

    chart.set(df)

    chart.show(block=True)
6. Callbacks:
import asyncio
import pandas as pd

from lightweight_charts import Chart


def get_bar_data(symbol, timeframe):
    if symbol not in ('AAPL', 'GOOGL', 'TSLA'):
        print(f'No data for "{symbol}"')
        return pd.DataFrame()
    return pd.read_csv(f'bar_data/{symbol}_{timeframe}.csv')


class API:
    def __init__(self):
        self.chart = None  # Changes after each callback.

    async def on_search(self, searched_string):  # Called when the user searches.
        new_data = get_bar_data(searched_string, self.chart.topbar['timeframe'].value)
        if new_data.empty:
            return
        self.chart.topbar['corner'].set(searched_string)
        self.chart.set(new_data)

    async def on_timeframe_selection(self):  # Called when the user changes the timeframe.
        new_data = get_bar_data(self.chart.topbar['corner'].value, self.chart.topbar['timeframe'].value)
        if new_data.empty:
            return
        self.chart.set(new_data)


async def main():
    api = API()

    chart = Chart(api=api, topbar=True, searchbox=True)
    chart.legend(True)

    chart.topbar.textbox('corner', 'TSLA')
    chart.topbar.switcher('timeframe', api.on_timeframe_selection, '1min', '5min', '30min', default='5min')

    df = get_bar_data('TSLA', '5min')
    chart.set(df)

    await chart.show_async(block=True)


if __name__ == '__main__':
    asyncio.run(main())

This package is an independent creation and has not been endorsed, sponsored, or approved by TradingView. The author of this package does not have any official relationship with TradingView, and the package does not represent the views or opinions of TradingView.
Release history Release notifications | RSS feed


Download files
Download the file for your platform. If you're not sure which to choose, learn more about installing packages.
Source Distribution
Built Distribution
Filter files by name, interpreter, ABI, and platform.
If you're not sure about the file name format, learn more about wheel file names.
Copy a direct link to the current filters
File details
Details for the file lightweight_charts-1.0.13.2.tar.gz.
File metadata
- Download URL: lightweight_charts-1.0.13.2.tar.gz
- Upload date:
- Size: 82.6 kB
- Tags: Source
- Uploaded using Trusted Publishing? No
- Uploaded via: twine/4.0.2 CPython/3.10.2
File hashes
| Algorithm | Hash digest | |
|---|---|---|
| SHA256 |
8bb91ba244ebc2ab06ac97001e764890bc96517d51e4cd3242bcfad3f806b1c7
|
|
| MD5 |
e91301ea9a03f0983293d4aaffa6ba5d
|
|
| BLAKE2b-256 |
14a53cafd34df848109148394dc4e8f0e010de39f30425995a18df877e041834
|
File details
Details for the file lightweight_charts-1.0.13.2-py3-none-any.whl.
File metadata
- Download URL: lightweight_charts-1.0.13.2-py3-none-any.whl
- Upload date:
- Size: 83.8 kB
- Tags: Python 3
- Uploaded using Trusted Publishing? No
- Uploaded via: twine/4.0.2 CPython/3.10.2
File hashes
| Algorithm | Hash digest | |
|---|---|---|
| SHA256 |
5a57e76da88ff5f03b8877a2ef91e529598181c50181b68c7311467911307e65
|
|
| MD5 |
9c7cdc1feac6d47428180d349bfbcbc3
|
|
| BLAKE2b-256 |
16896587dac80f1044e40610aa38d5a6411caa3ae1a29dfa7f0d54c036f9d21b
|


