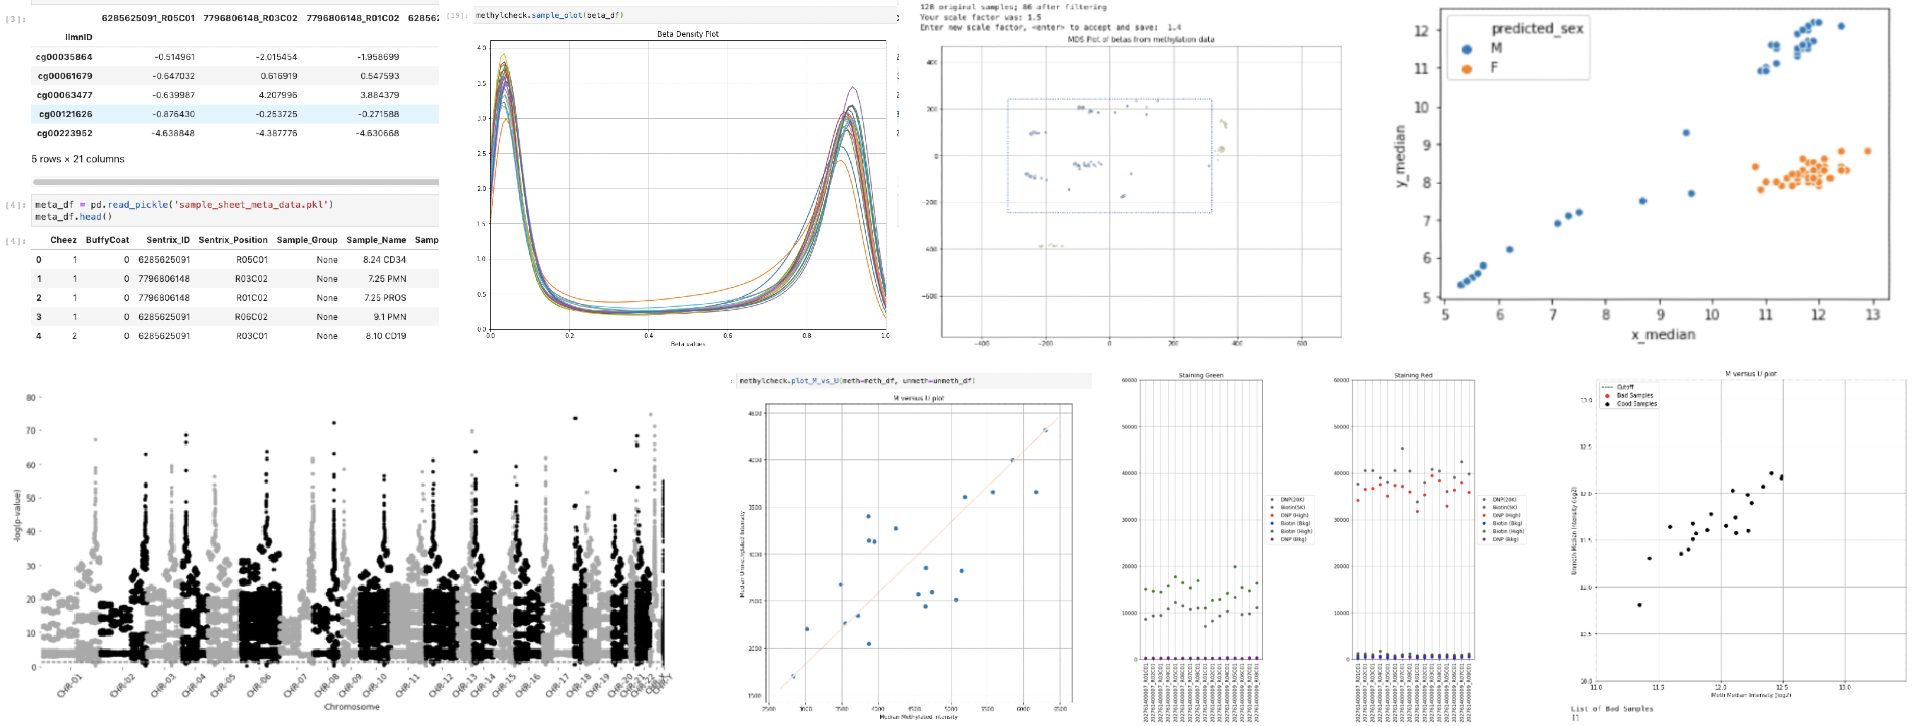
Quality Control (QC), Visualization/plotting, and postprocessing software for Illumina methylation array data. See https://life-epigenetics-methylcheck.readthedocs-hosted.com/en/latest/ for full documentation and examples.
Project description
methylcheck is a Python-based package for filtering and visualizing Illumina methylation array data. The focus is on quality control.
Methylcheck Package
This package contains high-level APIs for filtering processed data from local files. 'High-level' means that the details are abstracted away, and functions are designed to work with a minimum of knowledge and specification required. But you can always override the "smart" defaults with custom settings if things don't work. Before starting you must first process a set of idat files with the associated methylprep package or download processed data from the NIH GEO database. Refer to methylprep for instructions on this step.
Installation
This package is available in PyPi.
pip install methylcheck or pip3 install methylcheck if your OS defaults to python2x. This package only works in python3.6+.
Importing your data
Methylcheck is designed to accept the output from the methylprep package. If you have a bunch of idat samples, methylprep will return a single pickled pandas dataframe containing all the beta values for probes.
Load your data in a Jupyter Notebook like this:
mydata = pandas.read_pickle('beta_values.pkl')
For pandas you must specify the file name.
If you used methylprep process with the --all option, there's a convenience function in methylcheck (methylcheck.load) to open methylation files in a variety of formats.
import methycheck
df = methylcheck.load('<path to folder with methylprep output>')
# or
df,meta = methylcheck.load_both('<path to folder with methylprep output>')
meta data
.load_both() also conveniently loads a dataframe of all meta data associated with the samples. If you are using public GEO data, it will load that collection's meta data. Some analysis functions require specifying which samples are part of a treatment group (vs control) and the meta dataframe object can be used for this.
csv
If you point to a folder with processed CSVs, this will load and combine these output files and return a dataframe:
import methycheck
df = methylcheck.load('docs/example_data/GSE29852/9247377093/')
raw data
You can also use .load() to read processed files in these formats:
('beta_value', 'm_value', 'meth', 'meth_df', 'noob_df', 'sesame')
Specify these using the format=... parameter.
sesame
[Experimental] It will also load methylation data files processed using R's sesame package:
df = methylcheck.load(<filename>, format='sesame')
For more, check out our examples of loading data into methylcheck
GEO (idat)
Alternatively, you can download and process public GEO datasets. If you have a gzip of idat files, process them first with methylprep, or use the methylprep download -i <GEO_ID> option to download and process public data.
In general, the best way to import data is to use methylprep and run
import methylprep
methylprep.run_pipeline(data_folder, betas=True)

# or from the command line:
python -m methylprep process -d <filepath to idats> --all
collect the beta_values.pkl file it returns/saves to disk, and load that in a Jupyter notebook.
GEO (processed data in csv, txt, xlsx formats)
If idats are not available on GEO, you can imported the processed tabular data using methylcheck.read_geo. This will convert methylation/unmethylated signal intensities to beta values by default, returning a Pandas dataframe with samples in columns and probes in rows. As of version 0.6, it recognizes six different ways authors have organized their data, but does not handle these cases yet:
- Combining two files containing methylated and unmethylated values for a set of samples
- Reading GSM12345-tbl-1.txt type files (found in GSExxxx_family.tar.gz packages)
To obtain probe beta values for samples or methylated/unmethylated signal intensities, download the file locally and run:
import methylcheck
df = methylcheck.read_geo(filepath)
If you include verbose=True it will explain what it is doing. You can also use test_only=True to ensure the parser will work without loading the whole file (which can be several gigabytes in size). Test mode will only return the first 200 probes, but should parse the header and detect the file structure if it can.
From there, each data transformation is a single line of code using Pandas DataFrames. methylcheck will keep track of the data format/structures for you, and you can visualize the effect of each filter as you go. You can also export images of your charts for publication.
Refer to the Jupyter notebooks on readthedocs for examples of filtering probes from a batch of samples, removing outlier samples, and generating plots of data.
Quality Control (QC) reports
Methylcheck provides multiple report formats and flavors. These include a python clone of Illumina's Windows software (BeadArray Controls Reporter) and a PDF/excel report based on Genome Studio's QC plots. These highlight any irregularities with a sample's array processing (Bisulfite conversion, staining, fluorescence variation, etc) in a simple summary format.
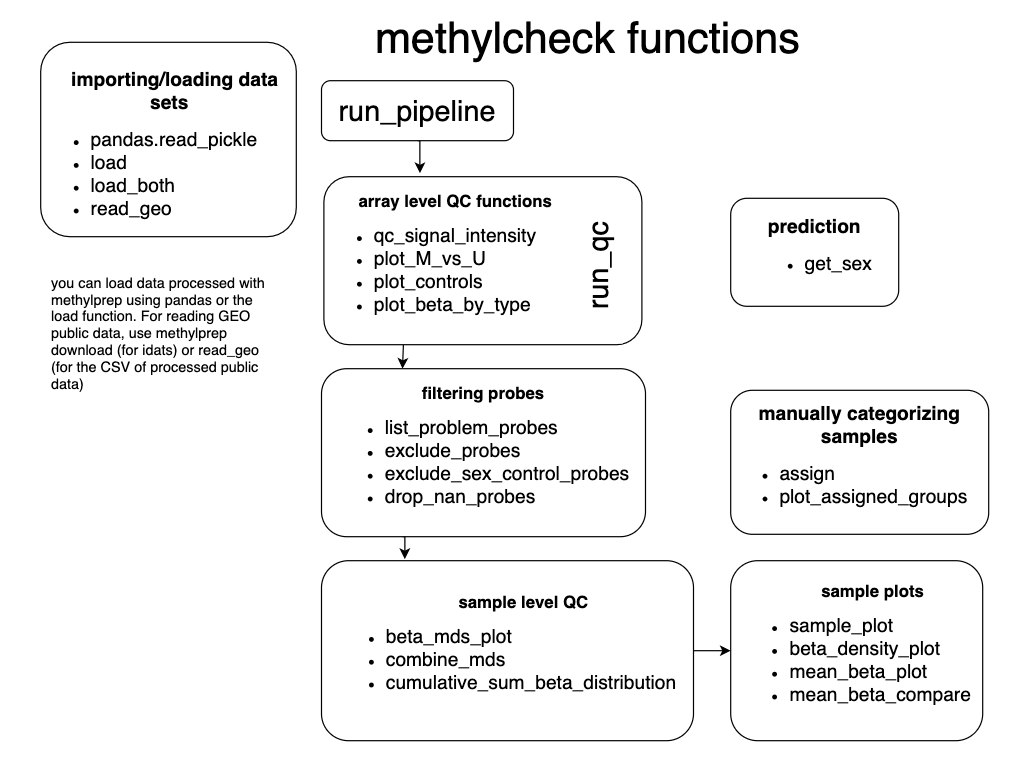
run_qc()
run_qc() is adapted from Illumina's Genome Studio QC functions.
The simplest way to generate a set of plots about the quality of your probes/array is to run this function in a Jupyter notebook:
import methylcheck
methylcheck.run_qc('<path to your methylprep processed files>')
Or from the command line:
python -m methylcheck qc -d <file location> --plot all
BeadArray Controls Reporter
This is a clone of Illumina's Windows software, BeadArray Controls Reporter. This generates
a color-coded excel document showing any irregularities with array processing. We've added some enhancements to the output, such as matching the [M]ale or [F]emale in the Sex/Gender column of your sample sheet with the predicted sex from the data, and an overall result column that gives an OK|FAIL|MARGINAL based on the battery of tests. But you can still generate an exact match of the Illumina excel document output using the --legacy option.
Example command line usage: python -m methylcheck controls -d <file location>
run_pipeline()
A second, more customizable quality control pipeline is the methylcheck.run_pipeline() function. run_pipeline() wraps run_qc() but adds several sample outlier detection tools. One method, multi-dimensional scaling, is interactive, and allows you to identify samples within your batch that you can statistically reject as outliers. Note that methylprep process automatically removes probes that fail the poobah p-value detection limit test by default; run_pipeline() examines where samples with lots of unreliable probes should be disregarded entirely.
ReportPDF
The most customizable format is a methylcheck.ReportPDF class that allows you to build your own QC report and save it to PDF. You can specify which tests to include and inject your own custom tables into the PDF. This is most useful if you process multiple batches of data in a lab and want to create a standardized, detailed, easy-to-read PDF report about the quality of samples in each batch. It also works within AWS.
Other functions
methylcheck provides functions to
- predict the sex of samples (
.get_sex) - detect probes that differ between two sets of samples within a batch (
.diff_meth_probes) inmethylize - remove sex-chromosome-linked probes and control probes
- remove "sketchy" probes, deemed unreliable by researchers. Note that
methylprepv1.4.0 and above will exclude unreliable probes from output to match those thatsesameremoves, unless disabled. This feature allows you to select additional probes to remove based on other published research results. - identify and excluder sample outliers based on multi-dimensional scaling (MDS)
- combine datasets for analysis, and load data in a variety of formats (from methylprep, sesame, and NIH GEO sources)
- plot sample beta or m-value distributions, or raw uncorrected probe channel intensities
Authors
Parts of this package were ported from minfi, an R package, and extended/developed by the team at Foxo Bioscience, who maintains it. You can write to info@FoxoTechnologies.com to give feedback, ask for help, or suggest improvements. For bugs, report issues on our github repo page.
Project details
Release history Release notifications | RSS feed
Download files
Download the file for your platform. If you're not sure which to choose, learn more about installing packages.
Source Distribution
Built Distribution
Hashes for methylcheck-0.7.3-py3-none-any.whl
| Algorithm | Hash digest | |
|---|---|---|
| SHA256 | f25c77d138833d1e04ad5c14e81b593e2388dfaff1df2d105b8c864da2dac940 |
|
| MD5 | cbed1b4a8d8d1928a633e3578e04e820 |
|
| BLAKE2b-256 | eb5d3d22f7f1154073cac0f1cd7d78f65a15ae37aef539d2fd4b52cc46a1032b |


