
MKTXP







MKTXP is an extensible toolkit for MikroTik RouterOS network engineering. It provides interactive terminal diagnostics, deterministic GitOps configuration management, and a Prometheus metrics exporter within a single command-line tool.
Choose Your Workflow
| I need to … | Start with | Full Guide |
|---|---|---|
| Troubleshoot a router now | mktxp diag … |
CLI Diagnostics Guide |
| Clean up / version RouterOS configs | mktxp rsc … |
GitOps RSC Guide |
| Monitor routers continuously | mktxp export |
Prometheus Exporter Guide |
Install
Standalone CLI & Exporter
# Recommended for local CLI usage
❯ pipx install mktxp

# Or via standard pip
❯ pip install mktxp

# Via Homebrew
❯ brew install mktxp

# Via Docker
❯ docker pull ghcr.io/akpw/mktxp:latest
Requirements: Python >= 3.9. Supported on Linux, macOS, and FreeBSD.
Ready-to-Run Monitoring & Logging Stack
If you need a turnkey environment without manually wiring services, MKTXP Stack is an out-of-the-box Docker Compose deployment that packages MKTXP alongside Prometheus / Grafana stack with pre-configured dashboards, and adds centralized MikroTik syslog processing via Loki and Promtail.
Quick Start: GitOps Configuration (mktxp rsc)
For local .rsc files, mktxp rsc works with zero configuration or router setup required:
# Deterministic formatting: single-line commands, standardized headers, and clean Git diffs
❯ mktxp rsc format -i backup.rsc -o clean_backup.rsc

# Modular domain splitting: break a monolithic export into numbered component files and extracted scripts
❯ mktxp rsc split -i backup.rsc -o ./config-repo/ --extract-scripts
📖 For AST architecture, custom domain handlers, live backups over SSH, and CI/CD automation, see the GitOps RSC Guide.
Connect to a Router
Both Live Diagnostics and the Prometheus Exporter connect to your routers via the standard RouterOS API.
MKTXP uses two configuration files:
mktxp.conf: Router connection profiles, credentials, custom labels, and metrics switches. Edit withmktxp edit._mktxp.conf: Daemon listen sockets, timeouts, parallel scraping, GitOps rules, and CLI diagnostic thresholds. Edit withmktxp edit -i.
Files are resolved automatically from ~/.config/mktxp/ (XDG standard) or /etc/mktxp/ (system/Docker). Check active paths anytime with mktxp show -cfg.
1. Minimal Configuration (mktxp.conf)
Add your router entry to mktxp.conf:
[My-Router]
    hostname = 192.168.88.1
    username = mktxp_user
    password = secret_password
(For Docker, simply mount your config directory: -v "$(pwd)/mktxp-config:/etc/mktxp")
2. Router User Setup
Create a dedicated monitoring user on your MikroTik router:
/user group add name=mktxp_group policy=api,read
/user add name=mktxp_user group=mktxp_group password=secret_password
(Note: For LTE metrics on RouterOS v6, the user also needs the test permission policy.)
📖 For complete parameter references,
[default]section inheritance, custom labels, parallel fetching, and diagnostic tuning, see the Configuration Guide.
Quick Start: Live Diagnostics (mktxp diag)
Run targeted, domain-specific diagnostic one-liners directly in your terminal:
# Find sticky wireless clients clinging to distant APs with poor signal or low rates
❯ mktxp diag -en My-Router -cc --low-signal --low-rate 1M

# Surface top bandwidth consumers across the network
❯ mktxp diag -en My-Router -kc --top 5

# Audit mystery DHCP devices with no hostname
❯ mktxp diag -en My-Router -dc --unidentified

# Check active dynamic firewall threat bans
❯ mktxp diag -en My-Router -al blacklist --dynamic-only
Sample output:
+----------------------+--------------+-------------------+-----------+------------------+--------+---------+---------+---------+
|      dhcp_name       | dhcp_address |    mac_address    | rx_signal |    interface     |  ssid  | tx_rate | rx_rate | uptime  |
+======================+==============+===================+===========+==================+========+=========+=========+=========+
| wlan0 (Conf Printer) | 10.20.10.49  | D8:1F:12:AD:3C:55 |    -87    | AP-Breakroom-2G  | Office | 36 Mbps | 1 Mbps  | 6 hours |
| wlan0 (Boardroom Tab)| 10.20.10.97  | 10:5A:17:0C:B9:C8 |    -84    | AP-Reception-2G  | Office | 24 Mbps | 1 Mbps  |  a day  |
+----------------------+--------------+-------------------+-----------+------------------+--------+---------+---------+---------+
Matching CAPsMAN clients: 2 (Total connected: 127)
💡 Tip: Appending
-hto any command (e.g.mktxp diag -kc -h) dynamically scopes help to only that command's filters.
📖 For more diagnostic domains, table schemas, and recipes, see the Diagnostics Guide.
Quick Start: Prometheus Exporter (mktxp export)
Start the exporter daemon to scrape configured routers and serve metrics to Prometheus:
❯ mktxp export
# Serving Prometheus metrics at http://localhost:49090/metrics
Add the scrape target to /etc/prometheus/prometheus.yml:
scrape_configs:
  - job_name: 'mktxp'
    static_configs:
      - targets: ['localhost:49090']
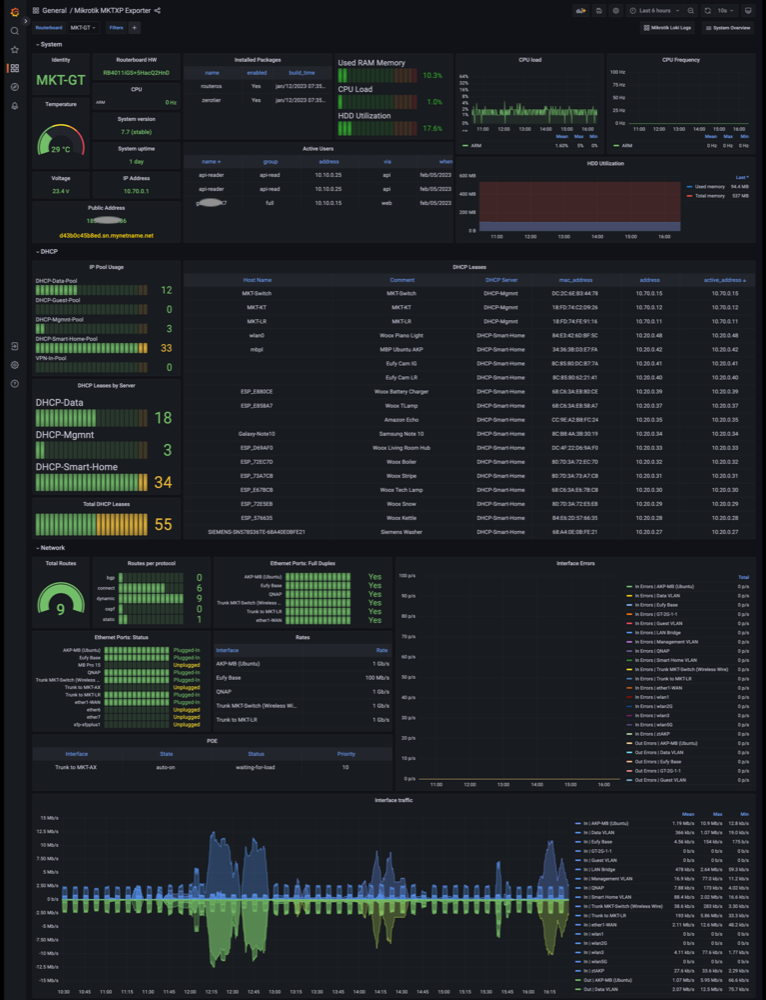
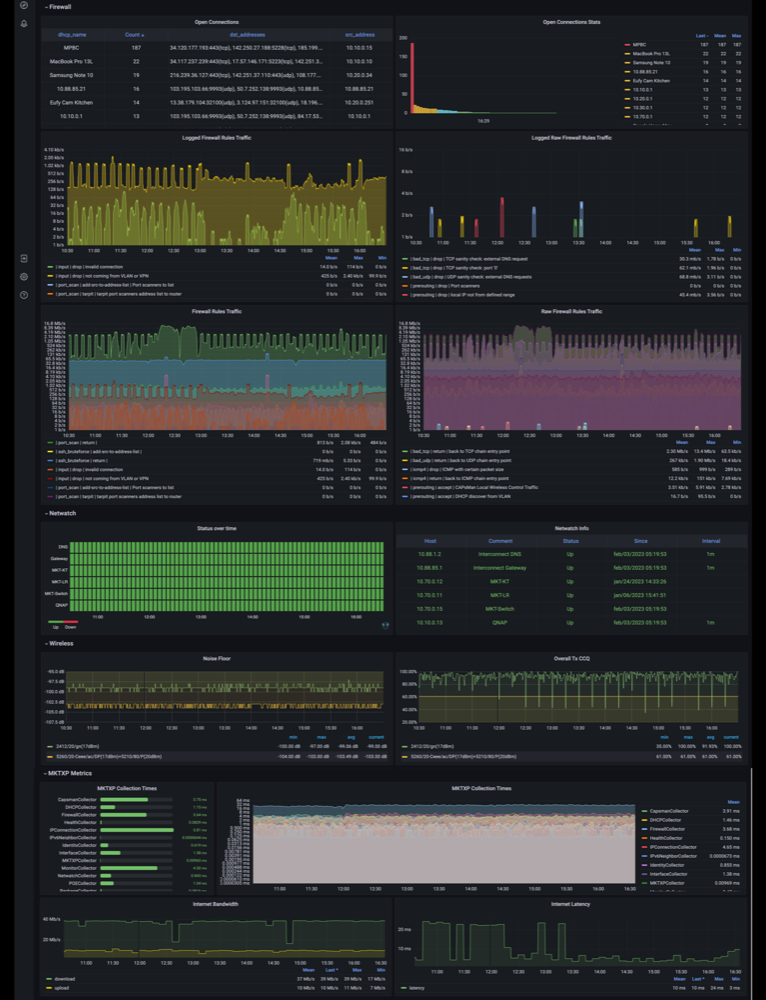
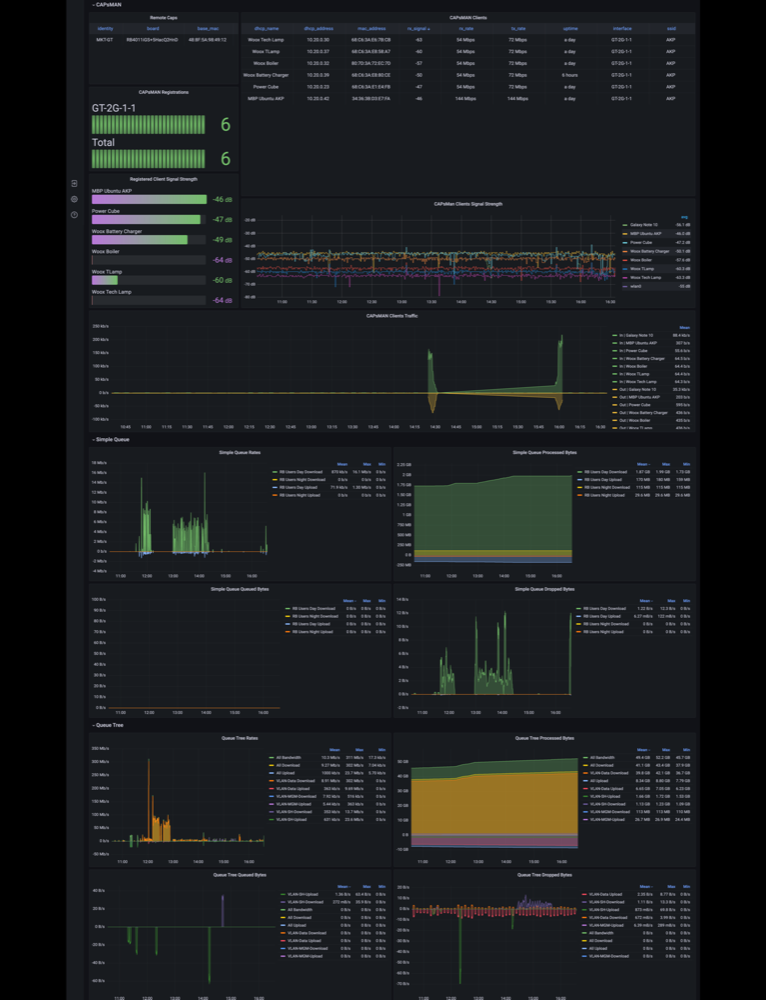
Import the official Grafana Dashboard (ID: 13679):
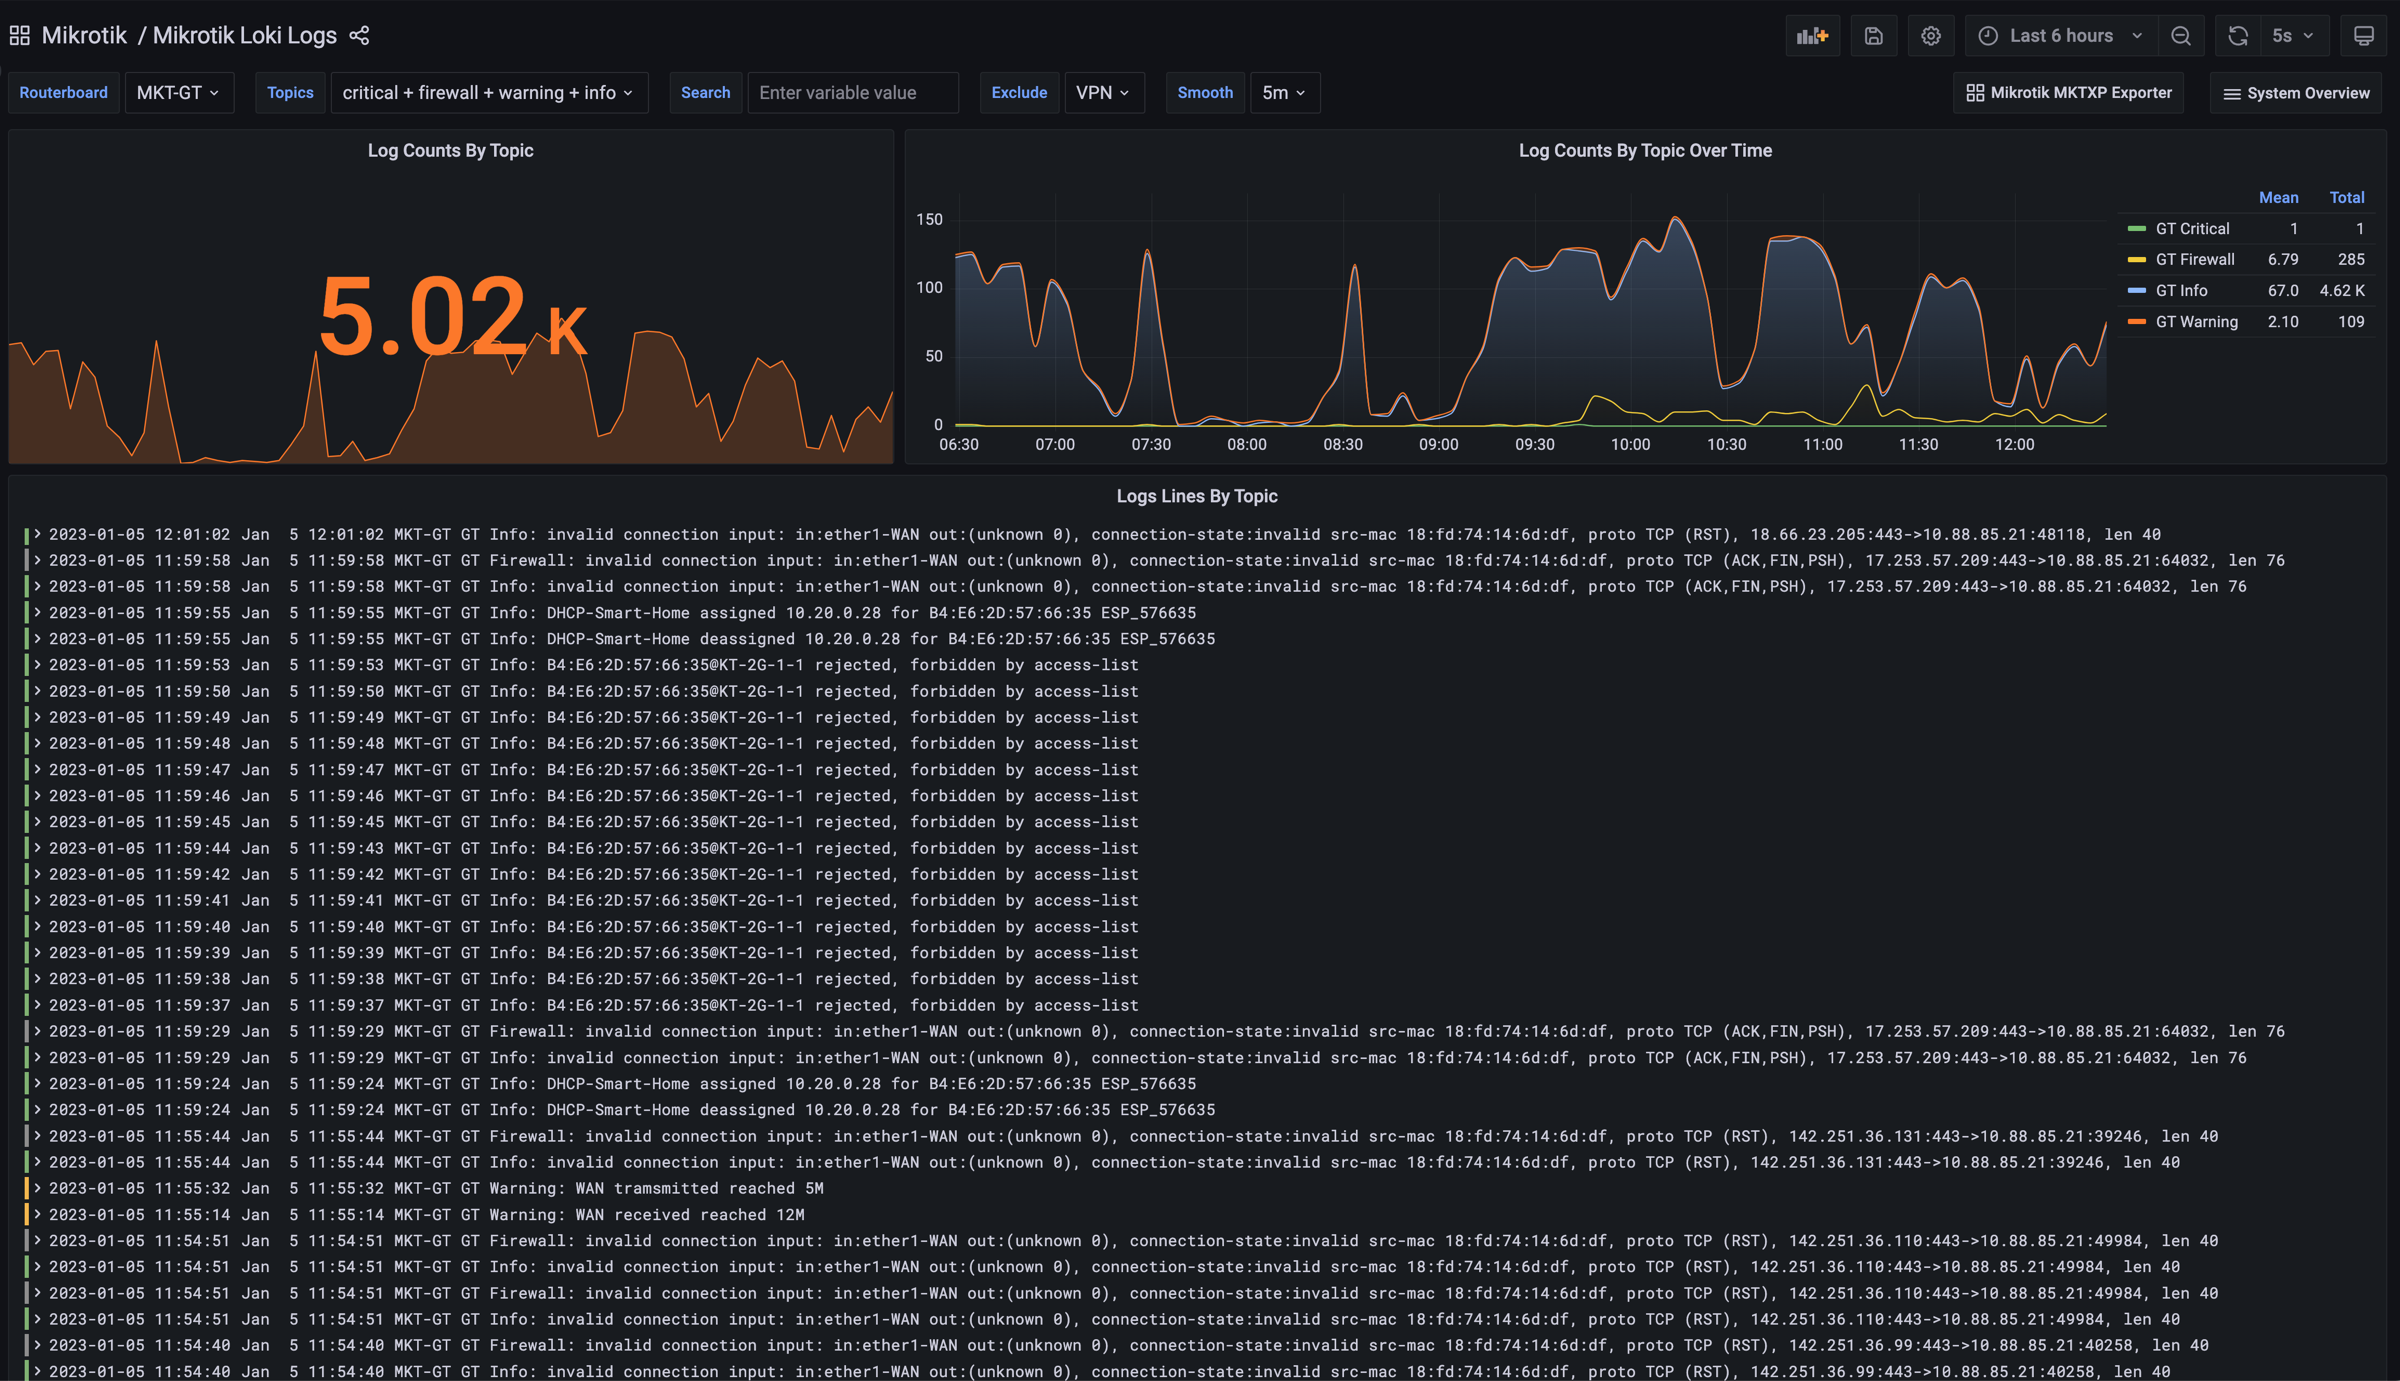
💡 Tip: Want centralized RouterOS logs too? MKTXP Stack is an out-of-the-box Docker Compose deployment that packages MKTXP alongside Prometheus / Grafana stack with pre-configured dashboards, and adds centralized MikroTik syslog processing via Loki and Promtail.
💡 Tip: 📖 For dynamic multi-target discovery (
/probe), Docker/Kubernetes, and systemd/FreeBSD service deployment, see the Exporter Guide.
Detailed Documentation
- Live CLI Diagnostics Guide: Detailed filter reference, table schemas, and recipes for multiple diagnostic domains.
- RouterOS GitOps RSC Guide: AST formatting, modular domain splitting, script extraction, and CI/CD pipelines.
- Prometheus Exporter Guide: Metrics catalog,
/probemulti-target pattern, container manifests, and service files. - Configuration Reference Guide: Complete anatomy of
mktxp.confand_mktxp.conf, multi-router inheritance, tuning, and Docker mounts.
Blogs
- Beyond Metrics: Instant RouterOS Diagnostics with MKTXP 2.0
- Under the Hood: Refactoring MKTXP for 2.0
- Wrangling RouterOS Configs: Introducing GitOps for MikroTik with MKTXP
License & Contributing
- Distributed under the GNU General Public License v2.
- Local development:
- Create a virtual environment:
python3 -m venv .venv && source .venv/bin/activate - Install editable with test dependencies:
pip install -e ".[test]" - Run test suite:
pytest - Install latest development build directly:
pip install git+https://github.com/akpw/mktxp
- Create a virtual environment:
1 maintainer

Download files
Download the file for your platform. If you're not sure which to choose, learn more about installing packages.
Source Distribution
Built Distribution
Filter files by name, interpreter, ABI, and platform.
If you're not sure about the file name format, learn more about wheel file names.
Copy a direct link to the current filters
File details
Details for the file mktxp-2.0.1.tar.gz.
File metadata
- Download URL: mktxp-2.0.1.tar.gz
- Upload date:
- Size: 104.0 kB
- Tags: Source
- Uploaded using Trusted Publishing? No
- Uploaded via:
twine/6.2.0 CPython/3.14.7
File hashes
| Algorithm | Hash digest | |
|---|---|---|
| SHA256 |
feadace67025b9db2e26a530d3778da85be0ae8dd42e4a5b3329064ac4cfdd54
|
|
| MD5 |
dd92a457860e88c45dae2a650aff8feb
|
|
| BLAKE2b-256 |
0fc4dfd89ec348dc1f4526fb79fff8d153abe91c033cb9ec0be965f43b442f41
|
File details
Details for the file mktxp-2.0.1-py3-none-any.whl.
File metadata
- Download URL: mktxp-2.0.1-py3-none-any.whl
- Upload date:
- Size: 191.9 kB
- Tags: Python 3
- Uploaded using Trusted Publishing? No
- Uploaded via:
twine/6.2.0 CPython/3.14.7
File hashes
| Algorithm | Hash digest | |
|---|---|---|
| SHA256 |
c94340fde943256b5bba84ec1ca5e744dd6d3c6b79dff103ac5f46a3d0759660
|
|
| MD5 |
606d2fceb4e2c7792cf4884ab54d6e41
|
|
| BLAKE2b-256 |
c1f733be243a5dbb4c25f1873bd2a201bd79d3f22ee36032509dbbb7ac34a3e0
|














