Simple and interactive plots using d3js


Project description

Moonframe
Moonframe is an open-source Python library that helps you create interactive graphs using D3.js without writing a single line of JavaScript.
It’s built for quick data exploration and aims to be as simple and accessible as possible.
Main features
Customizable charts without coding
Moonframe provides a simple user interface that handles all customization in real time, with no need to code. You can set the color palette, change the element properties (color, size, ...), filter the displayed data, and more.
Dynamic navigation
All graphs are interactive and dynamic, thanks to D3.js. Navigate your way through click, hover, zoom, and pan.
Ways of exploring your data
Moonframe lets you deeply explore your dataset: access your data with tooltips or cards, reveal relationships between elements with highlighting, flag important points, or hide useless ones.
You are also free to remove or add fields to be displayed in tooltips or cards.
Others features
- Easy to use
- Handling missing data
- Dark/light theme
- Search
Usage
Moonframe handles web applications based on Flask. Each application is run on a server and is rendered in a web browser.
[!IMPORTANT] For Moonframe's applications, a server doesn't refer to a cloud or remote machine. Instead, it refers to an application running locally on your own computer. You will notice the URL of any Moonframe application is looking like
127.0.0.1:5000, where127.0.0.1refers to your local machine (equivalent tolocalhost) and5000is the port used on your computer (can be something else, of course).
To keep things simple, Moonframe follows the philosophy: "one application = one graph". All available applications are stored in the app_builder module.
In practice, you can either include Moonframe directly in your Python projects:
from moonframe.app_builder import build_scatter_app
from moonframe.serve import serve_app

# Create a scatter plot app
app = build_scatter_app(filepath="dataset.csv", delimiter=";")
# Serve it locally
serve_app(app=app)
Or use it through the CLI:
> moonframe
Usage: moonframe [OPTIONS] COMMAND [ARGS]...

  Package moonframe v0.7.0

                  ⠀⠀⠀⠀⠀⠀⠀⠀⠀⠀⠀⠀⠀⠀⠀⠀⠀⠀⠀⠀⠀⠀⠀⠀⠀⠀⠀⠀⠀⠀⠀⠀⠀⠀⠀⠀⠀⠀
                  ⠀⠀⠀⠀⠀⠀⠀⠀⠀⠀⠀⠀⣀⣤⣴⡶⠖⠋⠉⠀⠀⠀⠀⠀⠀⠀⠀⠀⠀⠀⠀⠀⠀⠀⠀⠀⠀
                  ⠀⠀⠀⠀⠀⠀⠀⠀⠀⢠⣴⣾⣿⠟⠉⠀⠀⠀⠀⠀⠀⠀⠀⠀⠀⠀⠀⠀⠀⠀⠀⠀⠀⠀⠀⠀⠀⠀
                  ⠀⠀⠀⠀⠀⠀⠀⢀⣾⣿⣿⡿⠁⠀⠀⠀⠀⠀⠀⠀⠀⠀⠀⠀⠀⠀⠀⠀⠀⠀⠀⠀⠀⠀⠀⠀⠀⠀
                  ⠀⠀⠀⠀⠀⠀⣰⣿⣿⣿⣿⠁⠀⠀⠀⠀⠀⠀⠀⠀⠀⠀⠀⠀⠀⣶⣶⡆⠀⠀⠀⠀⠀⠀⠀⠀⠀⠀⠀
                  ⠀⠀⠀⠀⠀⢀⣿⣿⣿⣿⡇⠀⠀⠀⠀⠀⠀⠀⠀⠀⠀⣶⣶⡆⠀⣿⣿⡇⠀⠀⠀⠀⠀⠀⠀⠀⠀⠀⠀
                  ⠀⠀⠀⠀⠀⢸⣿⣿⣿⣿⣧⠀⠀⠀⠀⠀⠀⣶⣤⡄⠀⣿⣿⡇⠀⣿⣿⡇⠀⠀⠀⠀⠀⡄⠀⠀⠀⠀⠀
                  ⠀⠀⠀⠀⠀⠸⣿⣿⣿⣿⣿⡆⠀⣶⣶⡆⠀⣿⣿⡇⠀⣿⣿⡇⠀⣿⣿⡇⠀⠀⠀⠀⢠⠇⠀⠀⠀⠀⠀
                  ⠀⠀⠀⠀⠀⠀⢻⣿⣿⣿⣿⣿⣦⡙⢿⡇⠀⣿⣿⡇⠀⣿⣿⡇⠀⣿⣿⡇⠀⠀⢀⣴⡟⠀⠀⠀⠀⠀⠀
                  ⠀⠀⠀⠀⠀⠀⠀⠻⣿⣿⣿⣿⣿⣿⣦⣀⡀⠿⢿⡇⠀⣿⣿⡇⠀⡿⠿⢃⣠⣴⣿⠟⠀⠀⠀⠀⠀⠀⠀
                  ⠀⠀⠀⠀⠀⠀⠀⠀⠙⠿⣿⣿⣿⣿⣿⣿⣿⣷⣶⣦⣤⣭⣭⣤⣴⣶⣾⣿⣿⠿⠋⠀⠀⠀⠀⠀⠀⠀⠀
                  ⠀⠀⠀⠀⠀⠀⠀⠀⠀⠀⠈⠛⠿⢿⣿⣿⣿⣿⣿⣿⣿⣿⣿⣿⣿⡿⠿⠋⠁⠀⠀⠀⠀⠀⠀⠀⠀⠀⠀
                  ⠀⠀⠀⠀⠀⠀⠀⠀⠀⠀⠀⠀⠀⠀⠈⠉⠉⠛⠛⠛⠛⠛⠉⠉⠁⠀⠀⠀⠀⠀⠀⠀⠀⠀⠀⠀⠀⠀⠀⠀⠀⠀⠀⠀⠀⠀⠀⠀⠀⠀⠀⠀⠀⠀⠀⠀⠀

  ------------------------------  Moonframe  ------------------------------

  You are now using the Command line interface of moonframe package, a set of
  tools created at CERFACS (https://cerfacs.fr).

  This is a python package currently installed in your python environement.

  All graphs are displayed in your default web browser.

Options:
  --help  Show this message and exit.

Commands:
  circular-packing  Circular packing graph.
  network           Network graph.
  scatter           Scatter plot
Getting started
If you’re completely new to Python, the easiest way to begin is by following the getting started tutorial. This guide walks you through installing Moonframe and introduces a few essential basics. Give it a try!
Requirements
- Web browser
- Python >= 3.7
- An internet connexion (just during graph generation, see Important note above)
Installation
Install it from PyPI with :
pip install moonframe
[!IMPORTANT] Since Moonframe is a Python package, it cannot directly include JavaScript packages as dependencies. Therefore, the required JavaScript libraries are loaded at runtime from jsDelivr, a public content delivery network (CDN) for open-source software projects. In other words, when you open a graph, the browser loads the necessary JavaScript libraries (such as D3.js) from the word wild web (usually from NPM, the JavaScript package registry; comparable to PyPi in the Python ecosystem).
Available charts
Table of contents
 Scatter |
 Circular packing |
 Network |
|---|
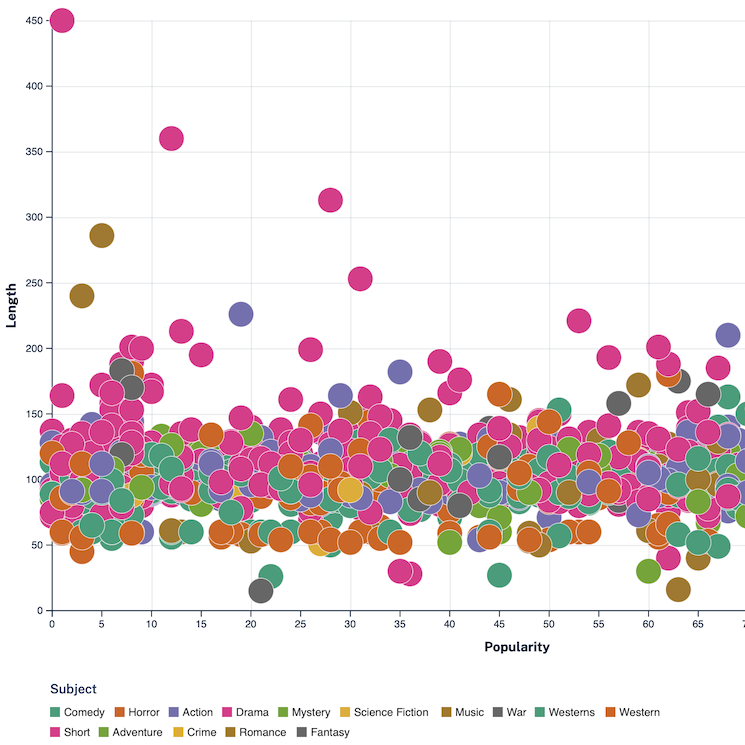
Scatter plot
The scatter plot displays data as points on a 2D axis. It is perfect to do quick data exploration on a variety of datasets.
It takes as input CSV files structured in columns. It must include a header row to name each column. For example, the film dataset from the personal website of James R. Eagan:
Year;Length;Title;Subject;Actor;Actress;Director;Popularity;Awards;*Image
1990;111;Tie Me Up! Tie Me Down!;Comedy;Banderas, Antonio;Abril, Victoria;AlmodÛvar, Pedro;68;No;NicholasCage.png
1991;113;High Heels;Comedy;BosÈ, Miguel;Abril, Victoria;AlmodÛvar, Pedro;68;No;NicholasCage.png
1983;104;Dead Zone, The;Horror;Walken, Christopher;Adams, Brooke;Cronenberg, David;79;No;NicholasCage.png
[!NOTE] Since you can specify the separator when running Moonframe, any separator should work.
More on this subject on the dataset documentation.
You can open the scatter plot either using the following command:
moonframe scatter film.csv -d ";"
Or in your application:
from moonframe.app_builder import build_scatter_app
from moonframe.serve import serve_app

# Create a scatter plot app
app = build_scatter_app(filepath="film.csv", delimiter=";")
# Serve it locally
serve_app(app=app)
Learn more on the scatter plot documentation.
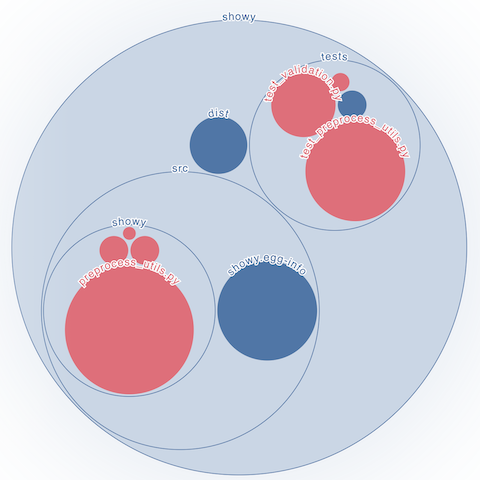
Circular packing
The circular packing graph displays hierarchical data as nested circles.
It takes as input JSON files looking like this:
{
  "root": {
    "field1": 5,
    "field2": true,
    "field3": "coffee",
    "field4": 1.5,
    "field5": ["hello", "world"],
    "field6": { "hello": 1, "world": 2 }
  },
  "root/element1": {
    "field1": 2,
    "field2": false,
    "field3": "tea",
    "field4": 3.2,
    "field5": ["hello", "world"],
    "field6": { "hello": 1, "world": 2 }
  }
}
Hierarchy is expresses as paths using "/" to separate the different levels. A common root is required to work.
You can open the graph either using the following command:
moonframe circular-packing dataset.json
Or directly in your application:
from moonframe.app_builder import build_app_circular_packing
from moonframe.serve import serve_app
from json import load

with open("dataset.json", "r") as file:
    data = load(file)

app = build_app_circular_packing(filedata=data, delimiter=";")
serve_app(app=app)
Learn more on the circular packing plot documentation.
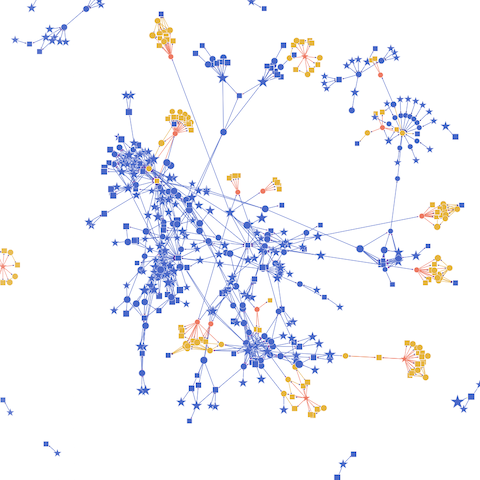
Network
The network graph displays relationships between elements within a network as nodes and edges (links).
It takes as input NetworkX graph or a JSON file generated from one (using node_link_data, see the offical documentation).
For example, you can open a Network graph in a Python script:
import networkx as nx
from moonframe.app_builder import build_app_network
from moonframe.server import serve_app

# set the graph - example taken from https://networkx.org/documentation/latest/auto_examples/basic/plot_simple_graph.html
G = nx.Graph()
G.add_edge(1, 2)
G.add_edge(1, 3)
G.add_edge(1, 5)
G.add_edge(2, 3)
G.add_edge(3, 4)
G.add_edge(4, 5)

# create the graph and opens it with Moonframe
app = build_app_network(G, title="Simple Network")
serve_app(app)
Or using the following command:
moonframe network dataset.json
dataset.json is, in this case, the output of the NetworkX function node_link_data dumped to JSON:
data = nx.readwrite.json_graph.node_link_data(G)

with open("dataset.json", "w") as f:
    json.dump(data, f, indent=4)
Giving the following:
{
  "directed": false,
  "multigraph": false,
  "graph": {},
  "nodes": [
    {
      "id": 1
    },
    {
      "id": 2
    },
    {
      "id": 3
    },
    {
      "id": 5
    },
    {
      "id": 4
    }
  ],
  "edges": [
    {
      "source": 1,
      "target": 2
    },
    {
      "source": 1,
      "target": 3
    },
    {
      "source": 1,
      "target": 5
    },
    {
      "source": 2,
      "target": 3
    },
    {
      "source": 3,
      "target": 4
    },
    {
      "source": 5,
      "target": 4
    }
  ]
}
Learn more on the network graph documentation.
Most common troubleshoots
- Wrong data format : Makes sure to double check the input data format requirements. You can take a look at the Dataset documentation. Be extra careful with the delimiter of your CSV file when using the scatter plot.
- Internet connexion : Even though the graph is hosted locally, an internet connection is briefly required during generation to load the necessary packages.
- Port number: If you manually set the port using the
-poption, make sure the port is available and not reserved by your system. If unsure, simply run the application without specifying a port, this lets it automatically choose a suitable one. - Cache : If something isn't working as expected, try clearing your browser cache and restarting the application.
- Version : Of course, make sure you are up-to-date. Run
pip install --upgrade moonframe. - Not responsive: Either your dataset is too big and it takes a lot of time to load - either you have disconnect your server by closing your terminal or pression
CTRL+D.
[!IMPORTANT] Don't forget to tracks errors in your browser’s console !
Frontend issues (coming from JavaScript, HTML or CSS) are displayed on your browser's console and not in your terminal. As most of Moonframe mechanics are developped in JavaScript, there is a good chance that an error occurs here.


Download files
Download the file for your platform. If you're not sure which to choose, learn more about installing packages.
Source Distribution
Built Distribution
Filter files by name, interpreter, ABI, and platform.
If you're not sure about the file name format, learn more about wheel file names.
Copy a direct link to the current filters
File details
Details for the file moonframe-1.0.3.tar.gz.
File metadata
- Download URL: moonframe-1.0.3.tar.gz
- Upload date:
- Size: 68.1 kB
- Tags: Source
- Uploaded using Trusted Publishing? No
- Uploaded via: twine/6.1.0 CPython/3.13.9
File hashes
| Algorithm | Hash digest | |
|---|---|---|
| SHA256 |
c58ae8dc2b9fb6c6e35b48543b63167db2ca6e68c65a062564cdee25e156299f
|
|
| MD5 |
cd490ef4ea918b0802e0d1c607105a5e
|
|
| BLAKE2b-256 |
66b8d193c46ef04c83416cba82896371ac72a2d6634d97023bc4f1a2e5a3cc09
|
File details
Details for the file moonframe-1.0.3-py3-none-any.whl.
File metadata
- Download URL: moonframe-1.0.3-py3-none-any.whl
- Upload date:
- Size: 81.7 kB
- Tags: Python 3
- Uploaded using Trusted Publishing? No
- Uploaded via: twine/6.1.0 CPython/3.13.9
File hashes
| Algorithm | Hash digest | |
|---|---|---|
| SHA256 |
bd13747138f65509c9997fa4552e5a87063047ac3a5e5538148a298a23db4c21
|
|
| MD5 |
748cb58330701aa8cf2e4e588767cffe
|
|
| BLAKE2b-256 |
cc1ba602268f1e4cc55dbbbee9583ccc9c6e9d4655efb0ece4378a50e2ec31c4
|


