moonframe : simple and interactive plots using d3js.


Project description

Moonframe
Moonframe is an open-source Python library that helps you create interactive graphs using D3.js without writing a single line of JavaScript.
It’s built for quick data exploration and aims to be as simple and accessible as possible.
Main features
Customizable charts without coding
Moonframe provides a clear interface that handles all customization. You can easily navigate between graph views to explore your dataset.


Interact with the data
Tooltips are available on all charts. They show details from your data when you hover over a point, and you can fully customize what they display. This can be helpful for getting quick insights. You can also highlight color groups on hover to spot trends more easily in your dataset.


Easy to setup
Moonframe comes with a minimalist CLI: one command, one graph.
Your data just needs to be in CSV format; a widely used and simple standard in the data visualization community.
Just type moonframe in any terminal:
>moonframe
Usage: moonframe [OPTIONS] COMMAND [ARGS]...
  Package moonframe v0.2.0

                  ⠀⠀⠀⠀⠀⠀⠀⠀⠀⠀⠀⠀⠀⠀⠀⠀⠀⠀⠀⠀⠀⠀⠀⠀⠀⠀⠀⠀⠀⠀⠀⠀⠀⠀⠀⠀⠀⠀
                  ⠀⠀⠀⠀⠀⠀⠀⠀⠀⠀⠀⠀⣀⣤⣴⡶⠖⠋⠉⠀⠀⠀⠀⠀⠀⠀⠀⠀⠀⠀⠀⠀⠀⠀⠀⠀⠀
                  ⠀⠀⠀⠀⠀⠀⠀⠀⠀⢠⣴⣾⣿⠟⠉⠀⠀⠀⠀⠀⠀⠀⠀⠀⠀⠀⠀⠀⠀⠀⠀⠀⠀⠀⠀⠀⠀⠀
                  ⠀⠀⠀⠀⠀⠀⠀⢀⣾⣿⣿⡿⠁⠀⠀⠀⠀⠀⠀⠀⠀⠀⠀⠀⠀⠀⠀⠀⠀⠀⠀⠀⠀⠀⠀⠀⠀⠀
                  ⠀⠀⠀⠀⠀⠀⣰⣿⣿⣿⣿⠁⠀⠀⠀⠀⠀⠀⠀⠀⠀⠀⠀⠀⠀⣶⣶⡆⠀⠀⠀⠀⠀⠀⠀⠀⠀⠀⠀
                  ⠀⠀⠀⠀⠀⢀⣿⣿⣿⣿⡇⠀⠀⠀⠀⠀⠀⠀⠀⠀⠀⣶⣶⡆⠀⣿⣿⡇⠀⠀⠀⠀⠀⠀⠀⠀⠀⠀⠀
                  ⠀⠀⠀⠀⠀⢸⣿⣿⣿⣿⣧⠀⠀⠀⠀⠀⠀⣶⣤⡄⠀⣿⣿⡇⠀⣿⣿⡇⠀⠀⠀⠀⠀⡄⠀⠀⠀⠀⠀
                  ⠀⠀⠀⠀⠀⠸⣿⣿⣿⣿⣿⡆⠀⣶⣶⡆⠀⣿⣿⡇⠀⣿⣿⡇⠀⣿⣿⡇⠀⠀⠀⠀⢠⠇⠀⠀⠀⠀⠀
                  ⠀⠀⠀⠀⠀⠀⢻⣿⣿⣿⣿⣿⣦⡙⢿⡇⠀⣿⣿⡇⠀⣿⣿⡇⠀⣿⣿⡇⠀⠀⢀⣴⡟⠀⠀⠀⠀⠀⠀
                  ⠀⠀⠀⠀⠀⠀⠀⠻⣿⣿⣿⣿⣿⣿⣦⣀⡀⠿⢿⡇⠀⣿⣿⡇⠀⡿⠿⢃⣠⣴⣿⠟⠀⠀⠀⠀⠀⠀⠀
                  ⠀⠀⠀⠀⠀⠀⠀⠀⠙⠿⣿⣿⣿⣿⣿⣿⣿⣷⣶⣦⣤⣭⣭⣤⣴⣶⣾⣿⣿⠿⠋⠀⠀⠀⠀⠀⠀⠀⠀
                  ⠀⠀⠀⠀⠀⠀⠀⠀⠀⠀⠈⠛⠿⢿⣿⣿⣿⣿⣿⣿⣿⣿⣿⣿⣿⡿⠿⠋⠁⠀⠀⠀⠀⠀⠀⠀⠀⠀⠀
                  ⠀⠀⠀⠀⠀⠀⠀⠀⠀⠀⠀⠀⠀⠀⠈⠉⠉⠛⠛⠛⠛⠛⠉⠉⠁⠀⠀⠀⠀⠀⠀⠀⠀⠀⠀⠀⠀⠀⠀⠀⠀⠀⠀⠀⠀⠀⠀⠀⠀⠀⠀⠀⠀⠀⠀⠀⠀

  ------------------------------  Moonframe  ------------------------------

  You are now using the Command line interface of moonframe package, a set of
  tools created at CERFACS (https://cerfacs.fr).

  This is a python package currently installed in your python environement.

  All graphs are displayed in your default web browser.

Options:
  --help  Show this message and exit.

Commands:
  scatter  Scatter plot
Available charts
In Moonframe :
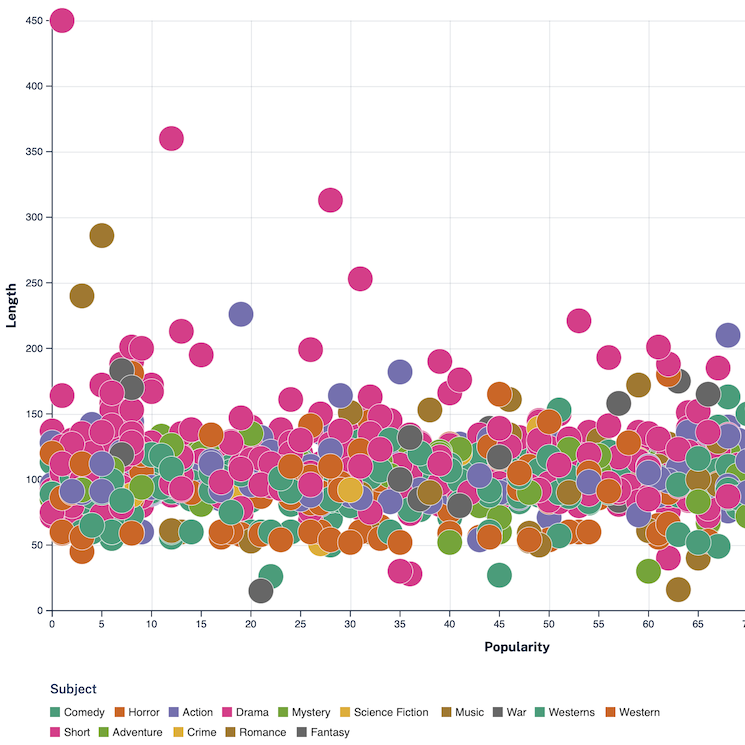 Scatter |
|---|
In Marauder's map :
Marauder's map is a python helper tool to create visual representations of the internal structure of python and Fortran packages. It is developed by the same team as Moonframe.
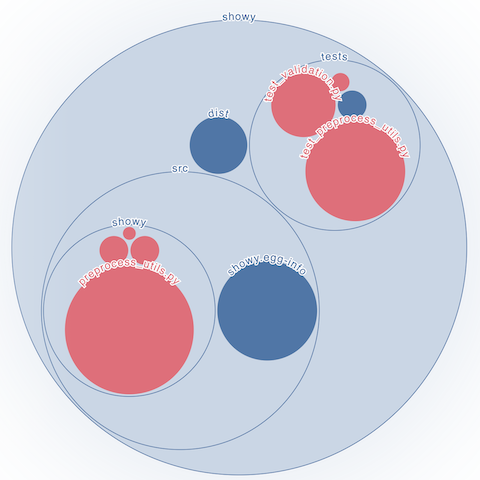 Circular packing |
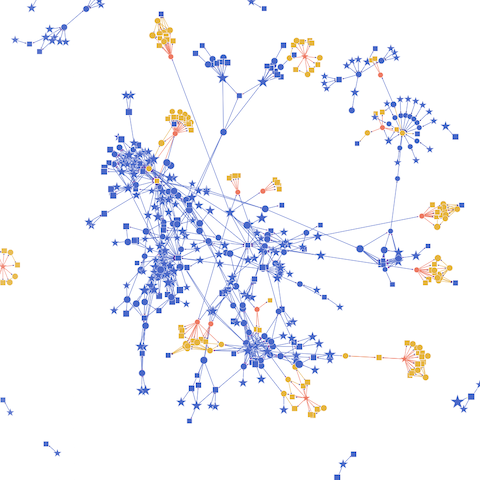 Network |
|---|
Installation
Install it from PyPI with :
pip install moonframe


Download files
Download the file for your platform. If you're not sure which to choose, learn more about installing packages.
Source Distribution
Built Distribution
Filter files by name, interpreter, ABI, and platform.
If you're not sure about the file name format, learn more about wheel file names.
Copy a direct link to the current filters
File details
Details for the file moonframe-0.3.0.tar.gz.
File metadata
- Download URL: moonframe-0.3.0.tar.gz
- Upload date:
- Size: 46.7 kB
- Tags: Source
- Uploaded using Trusted Publishing? No
- Uploaded via: twine/4.0.2 CPython/3.11.4
File hashes
| Algorithm | Hash digest | |
|---|---|---|
| SHA256 |
bf8e2760b3bb1a824517cf8ab97aa4ebf7994faa3af820a3f988c607bcc8bd40
|
|
| MD5 |
300302d0a37a79517db47b05b5fe698e
|
|
| BLAKE2b-256 |
4b73081712d743b77b78f782b352d021d75c7e085c5a8d217ea8e9d5336bf14a
|
File details
Details for the file moonframe-0.3.0-py3-none-any.whl.
File metadata
- Download URL: moonframe-0.3.0-py3-none-any.whl
- Upload date:
- Size: 58.8 kB
- Tags: Python 3
- Uploaded using Trusted Publishing? No
- Uploaded via: twine/4.0.2 CPython/3.11.4
File hashes
| Algorithm | Hash digest | |
|---|---|---|
| SHA256 |
beb703cb68c6e97b55d90a7c7d768762e67265d28160d104b262af4e8df49154
|
|
| MD5 |
932923f5de4526676ca0f82f0ef0f04d
|
|
| BLAKE2b-256 |
f01683ebbd108ee6a1316f188bedf964d680234e7583d966425d1140f4a7eccc
|


