
nahiarhdlog




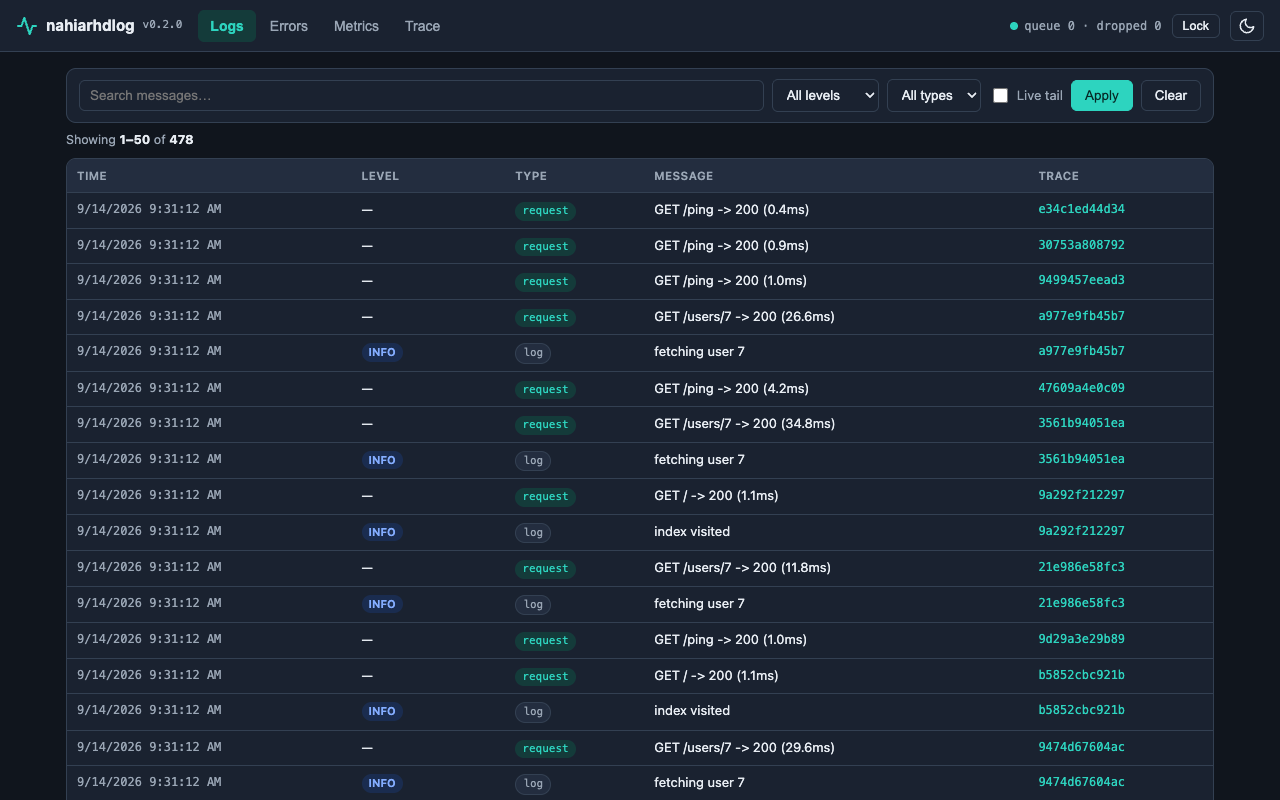
Embedded observability for FastAPI — searchable logs, error tracking, alerts, metrics, tracing, and a token-locked dashboard. Zero infrastructure: everything lives in one SQLite file.
Why nahiarhdlog?
- No infrastructure. No ELK, no agents, no SaaS —
pip installand you have history, search, and a UI. - Embedded dashboard. Your logs live at
/nahiarhdloginside your own app, behind your own token. - Negligible overhead. Requests enqueue a small dict (p95 ~0.04 ms); SQLite writes happen in batches on a background thread. The queue is bounded — when full, events drop with a visible counter instead of ever blocking a request.
- Framework-agnostic core. FastAPI first; the core imports no web framework, so Flask/Django adapters can follow without changing it.
New project setup
Four steps. Nothing else is required for a FastAPI app.
1. Install
uv add nahiarhdlog python-dotenv
# or: pip install nahiarhdlog python-dotenv
Python ≥ 3.10. Logs land in .nahiarhdlog/nahiarhdlog.db (created automatically).
2. Put a token in .env
# .env  — do not commit this file
NAHILOG_TOKEN=change-me-to-a-long-random-string
nahiarhdlog does not read .env for you. Your app loads it and passes the value in. That way the same package works in every project.
3. One call in your app
import os
from dotenv import load_dotenv
from fastapi import FastAPI
from nahiarhdLOG import observe

load_dotenv()

app = FastAPI()
observe(app, dashboard_token=os.environ.get("NAHILOG_TOKEN"))
That captures every request, every stdlib log, and every uncaught exception.
4. Run and open the dashboard
uv run uvicorn main:app --reload
Open http://127.0.0.1:8000/nahiarhdlog/ and type the token from .env.
No token set? Collection still runs; the URL shows a setup page instead of data.
Optional: a worker, cron job, or script
A second process has no FastAPI app, so observe() does not apply. In that process, point at the same database:
from nahiarhdLOG import attach
attach()  # same default path: .nahiarhdlog/nahiarhdlog.db
Call it in the process that logs (after fork, if you use a prefork pool). Using loguru? It does not go through stdlib — add the handler as a sink:
from nahiarhdLOG import attach
from nahiarhdLOG.handler import NahiarhdHandler

collector = attach()
logger.add(NahiarhdHandler(collector), format="{message}")
Features
| Area | What you get |
|---|---|
| Logs | Auto-captured stdlib records + requests; full-text search (FTS5), level/type/time/trace filters, pagination |
| Errors | Grouped by ExcType@file.py:line, full tracebacks, top-errors ranking |
| Alerts | Threshold rules (N events in M seconds) + cooldown; webhook, Telegram, and SMTP sinks |
| Metrics | RPS, error rate, latency p50/p95, time-bucketed series — computed from the same request events |
| Tracing | W3C traceparent in and out; one trace_id per request; interactive waterfall timeline; AI agent span tracing (ai_span, span); request & response payload inspection |
| Dashboard | Embedded at /nahiarhdlog, token-locked, dark/light mode, mobile-friendly, live tail |
Configuration — all arguments and .env wiring
observe() takes explicit arguments and never reads your environment or .env file itself — each app owns its config, so the same package works unchanged across projects:
| Argument | Default | Meaning |
|---|---|---|
db_path |
".nahiarhdlog/nahiarhdlog.db" |
SQLite file for events (parent dirs auto-created) |
dashboard_token |
None (setup page) |
Token for the dashboard; unset = setup page, data stays off |
dashboard_prefix |
"/nahiarhdlog" |
Where the dashboard lives |
retention_days |
7 |
How long events are kept |
sample_rate |
1.0 |
1.0 = every request; 500s are always kept |
level |
logging.INFO |
Minimum stdlib level captured |
skip_paths |
[] |
Extra paths the middleware ignores (dashboard prefix is always excluded) |
capture_body |
True |
Automatically capture request & response headers and payloads (with secret redaction) |
max_body_size |
65536 |
Maximum payload bytes captured before safe truncation |
AI Agent & Span Tracing — instrumenting LLMs, embeddings, and tools
Trace multi-step AI agent workflows with child spans, token metrics, model parameters, and tool calls automatically tied to the active request's trace_id:
from fastapi import FastAPI
import nahiarhdLOG
from nahiarhdLOG import ai_span, span

app = FastAPI()
nahiarhdLOG.observe(app, dashboard_token="secret", capture_body=True)

@app.post("/api/proxy/v1/responses")
def chat_agent(req: dict):
    # Step 1: Knowledge retrieval / vector embedding
    with span("vector_search", span_type="embedding", input_data={"q": req["prompt"]}) as s:
        s.set_output({"matches": 5})

    # Step 2: AI LLM reasoning & tool execution
    with ai_span("agent_reasoning", model="gpt-4o", messages=req.get("messages")) as ai:
        with span("calculator", span_type="tool", input_data={"expr": "2+2"}) as tool:
            tool.set_output({"res": 4})
        ai.set_completion("The answer is 4")
        ai.set_tokens(prompt_tokens=45, completion_tokens=15)
        ai.set_tool_calls([{"name": "calculator", "args": {"expr": "2+2"}}])

    return {"response": "The answer is 4"}
Open /nahiarhdlog and click View trace to see an interactive waterfall chart of every step, latency breakdowns, tokens used, and expandable request/response payloads.
Typical .env-based wiring in your app:
# .env (never commit this file)
NAHILOG_DB=/var/lib/myapp/nahiarhdlog.db
NAHILOG_TOKEN=long-random-secret
import os
from fastapi import FastAPI
from nahiarhdLOG import observe

app = FastAPI()
observe(
    app,
    db_path=os.environ.get("NAHILOG_DB", ".nahiarhdlog/nahiarhdlog.db"),
    dashboard_token=os.environ.get("NAHILOG_TOKEN"),  # None = setup page, data stays off
)
If your app loads
.envviadotenv_values(read-only dict) instead ofload_dotenv,os.environwon't see those values — pass them through your env helper instead.
Alerts & OpenTelemetry — rules, sinks, trace export
from nahiarhdLOG.alerter import Rule, SmtpSink, TelegramSink, WebhookSink

observe(
    app,
    rules=[Rule("api-errors", count=10, window_seconds=600, cooldown_seconds=1800)],
    sinks=[
        WebhookSink("https://hooks.example/deploy"),          # POSTs {"subject","body"} as JSON
        TelegramSink(bot_token="123:ABC", chat_id="-100..."),  # Bot API sendMessage
        SmtpSink("smtp.example.com", ["ops@example.com"], username="bot", password="..."),
    ],
    dashboard_token="secret",
)
Rules evaluate in a background thread; a failing sink never blocks the others.
pip install "nahiarhdlog[otel]"
from nahiarhdLOG.otel import export_trace
from nahiarhdLOG.query import get_trace

export_trace(get_trace(collector.storage, trace_id))  # keeps the original trace id
Example app
# terminal 1: run the demo
uv run python examples/basic_app.py serve

# terminal 2: generate traffic
uv run python examples/basic_app.py traffic --n 300
Open http://127.0.0.1:8000/nahiarhdlog/ with token demo-token.
FAQ
Does nahiarhdlog read my .env? No. Load it yourself (load_dotenv(), your env helper, or the platform's env) and pass dashboard_token= / db_path= in. The package never opens .env, so it behaves the same in every project.
Which Python versions? 3.10+ (3.10, 3.11, 3.12 tested in CI).
Where is data stored? One SQLite file (.nahiarhdlog/nahiarhdlog.db by default), WAL mode, FTS5 index for search. Delete the directory to wipe everything. Set retention_days for automatic purging. Pass a postgresql:// URL as db_path instead (with pip install nahiarhdlog[postgres]) and history lives in one shared nahiarhdlog_events table.
Can two machines share one SQLite file? No. WAL requires every process on the same host (same volume). It does not work over a network filesystem, so an API pod and a worker pod each get their own database unless they mount the same disk. That is a SQLite limit, not a bug. For multi-host history, use the Postgres backend: every process points db_path at the same URL, or plug a custom storage backend via Collector(storage=...).
Why does the dashboard sometimes show empty results, then data after re-clicking? Reads drain the pending write queue first, so fresh events appear on the first click. If empty-then-data persists across clicks seconds apart, consecutive requests are reaching different backends: with replicas > 1 each pod has its own SQLite file and a round-robin load balancer flips you between them. The footer shows which backend (host/pid) served the last call, and with per-process (SQLite) storage a banner appears when it changes; shared Postgres storage stays silent, since every replica reads the same events. Fix it with the shared Postgres backend, sticky sessions, or a single replica for the dashboard.
How do traces line up with my gateway / OpenTelemetry? Incoming traceparent is reused as trace_id; the response gets a new parent-id for this hop (W3C Trace Context). No header → a new trace is started. Browser clients that need to read the response header must add traceparent to CORS expose_headers.
Is the dashboard secure? Data is served only when dashboard_token is configured, and every page + API call requires presenting the token (cookie set at login; old ?token= links migrate). Open the URL without the token and you get a lock screen (401). Skip dashboard_token entirely and you get a setup page instead of data. Use a long random token and HTTPS in production.
Why don't I see the dashboard's own requests in the logs? By design: the dashboard prefix is auto-excluded so its polling doesn't drown your signal. Add more with skip_paths.
What's the overhead? Requests only enqueue a small dict; SQLite writes happen in batches on a background thread. Run python scripts/probe_perf.py to measure on your machine.
Celery / workers / scripts? attach(db_path) in that process, same path as observe(). No app object, no new event type. Optional source= is stored on data for your own filtering; the dashboard does not special-case it.
Flask / Django / plain scripts? Scripts can attach() today. Flask/Django HTTP adapters are on the roadmap. The core (collector, storage, query, alerter, metrics, attach) imports no web framework — only the thin adapters/ layer does, enforced by an automated boundary test.
How do I disable the dashboard? Omit dashboard_token (default): events are still collected, but the dashboard URL serves a setup notice instead of data.
Roadmap
- Core logging, SQLite+FTS5 storage, search API
- Error tracker + webhook alerts
- Metrics + tracing (+ optional OpenTelemetry export)
- Embedded dashboard UI
Non-goals for now: Flask/Django adapters and a Postgres backend. The core stays framework-agnostic and SQLite keeps the zero-infrastructure promise — those get revisited only if real demand shows up.
Custom storage backends
SQLite is the default and stays zero-infrastructure. But storage is a small duck-typed interface — if you ever outgrow SQLite (multi-host shared history, extreme write concurrency), plug your own backend without forking:
from nahiarhdLOG.collector import Collector

collector = Collector(storage=PostgresStorage(dsn))  # your class, your infra
Implement these 9 members (mirror SQLiteStorage in storage.py):
| Member | Role |
|---|---|
insert_many(events) -> int |
Persist a batch; called from the writer thread |
search(...) -> list[dict] |
Newest-first events with text/level/type/trace/signature/time filters + limit/offset |
count(...) -> int |
Same filters, returns the match count |
top_signatures(since, limit) -> list |
[{signature, count, last_ts, last_message}] for the Errors tab |
fetch_requests(since, until) -> list |
Lightweight [{ts, status, duration_ms}] rows for metrics |
get(event_id) -> dict | None |
One event by id |
purge() -> int |
Delete events older than retention; returns rows removed |
close() -> None |
Release resources |
fts_available -> bool |
Whether full-text search is active |
Event dicts look like {id, ts, type, level, message, trace_id, data}. Implementations must be thread-safe: writes come from one background thread, reads from request threads.
Development
uv pip install -e ".[dev,otel]"
uv run --no-sync python -m pytest
uv run --no-sync python scripts/probe_perf.py --n 10000
Changelog
- 0.6.3 — Fix SQLite
database is lockedunder concurrent/multi-process writes viaBEGIN IMMEDIATEtransactions, exponential backoff retries with jitter (max_retries=5), increased busy timeout to 15s, and background writer thread crash resilience inCollector. Dashboard Live tail now persists preference inlocalStorage, auto-resumes smoothly when returning to the tab or closing detail dialogs, and no longer gets permanently disabled when clicking error cards. - 0.6.2 — Smart traceback truncation preserving head and tail at newline boundaries; max message size increased to 64KB; structured
exc_messagecapture. Dashboard error details UI redesigned with bottom-up exception detection, syntax-highlighted frames, formatted error banner callout, and one-click traceback copying. - 0.6.1 — Log rows parse HTTP methods into chips (GET/POST/PUT/PATCH/DELETE + status + duration) and CRUD lines (
Deleted document …) into action/entity/name/id. Successful deletes and updates get a gutter, not a full-row wash. Demo traffic includes document/folder DELETE and PATCH. - 0.6.0 — Dashboard scan pass: severity gutters, exception last-line in the table (not
Traceback…), compact timestamps, full trace ids with copy, favicon. Live tail no longer flashes the table. Error cards show the last exception message and a dismissible signature chip. The Trace tab lists recent traces; truncated ids uniquely resolve. Metrics charts get a legend, time axis, theme colors, and hover tooltips. Tabs are a keyboard-accessible tablist; the lock screen uses the dashboard theme tokens.top_signaturesnow includeslast_message. - 0.5.0 — Incoming W3C
traceparentis reused astrace_idand echoed on the response with a new parent-id. Uncaught exceptions inthreading.Threadare captured (threading.excepthook). Stdlibextra=fields are stored on the event. FAQ documents the SQLite WAL same-host limit. - 0.4.0 —
attach(db_path, source=...)captures stdlib logs and uncaught exceptions in any process (Celery workers, cron, scripts) with no FastAPI app. Point it at the same SQLite file asobserve()and the events show up in the existing dashboard.sourceis optional metadata, not a new event type. - 0.3.2 — The bare prefix redirects to the slashed dashboard URL (307, query preserved) instead of serving the page twice:
index.htmluses relative asset URLs, so only the slashed page renders correctly. Users only need to know/nahiarhdlog. - 0.3.1 — The dashboard page is served with and without the trailing slash, so
redirect_slashes=Falseapps don't 404 the bare prefix. (Superseded by 0.3.2: the bare URL served a page with broken CSS/JS.) - 0.3.0 — Dashboard default moved from
/admin/logsto/nahiarhdlog(passdashboard_prefix="/admin/logs"to keep the old URL). Nodashboard_tokenno longer 404s:observe()logs a startup warning and serves a setup page explaining how to enable the dashboard. - 0.2.0 — Default database moved to
.nahiarhdlog/nahiarhdlog.db(a dot-directory keeps project roots clean; missing parent dirs are auto-created). Note: apps on the old default start a fresh database here — the oldnahiarhdlog.dbis left untouched. - 0.1.3 — Dashboard login persists via cookie: refresh and new tabs stay signed in; lock screen signs in without putting the token in the URL; old
?token=bookmarks keep working and migrate to a cookie. Added Lock button. Shutdown hook moved to lifespan composition (works alongside user-defined lifespans, Starlette 0.52–1.x). - 0.1.2 — Requests capture client IP + user agent; detail dialog rebuilt (no empty rows, status chips, "view full trace" jump); log rows keyboard-accessible (Tab + Enter).
- 0.1.1 —
NahiarhdHandlerno longer appends a second traceback when the message already contains one (loguru-style pre-formatted records, manually formatted tracebacks). - 0.1.0 — Initial release: searchable logs, error tracker + alerts, metrics, tracing, embedded dashboard.
License
MIT — see LICENSE.
By Raihan Hidayatullah Djunaedi · nahiarhd.com · PyPI @nahiarhd
1 maintainer

Metadata
1 maintainer
Release files for nahiarhdlog 0.8.1
For a detailed explanation of source distributions (sdists) and built distributions (wheels), please see the package formats documentation.
Source distribution (sdist)
| File | Size | Uploaded | |
|---|---|---|---|
| nahiarhdlog-0.8.1.tar.gz | 84.4 kB | Details |
Built distribution (wheel)
| File | Interpreter | ABI | Platform | Reset |
|---|---|---|---|---|
| nahiarhdlog-0.8.1-py3-none-any.whl | Python 3 | none | any | Details |
Total release size: 150.7 kB
Release files / nahiarhdlog-0.8.1.tar.gz
| Download URL | nahiarhdlog-0.8.1.tar.gz |
|---|---|
| Size | 84.4 kB |
| Tags | Source |
|
SHA-256 checksum How to use checksums |
742418b33433dac6ccf6a115caa852521d05eb082bfe3ef2e7c1fa8f03d89d5e
|
|
BLAKE2b-256 checksum How to use checksums |
b12da8a71fb5b61e67e214f498eb573a44ca921b0fe8d169f18b41c598c3ae28
|
| Upload date | |
|
Uploaded using Trusted Publishing? What is trusted publishing? |
Yes |
| Uploaded via |
twine/7.0.0 CPython/3.13.14
|
Provenance
Provenance describes where a file came from. On PyPI, provenance is shared via attestations, which provide a verifiable record of the build or publishing details. View details, limitations and caveats.


PyPI Publish Attestation
PyPI verified that this artifact, at this checksum, originated from the publisher listed below.
Signed by GitHub Actions, verified by PyPI on Sep 23, 2026.
Transparency logRelease files / nahiarhdlog-0.8.1-py3-none-any.whl
| Download URL | nahiarhdlog-0.8.1-py3-none-any.whl |
|---|---|
| Size | 66.2 kB |
| Tags | Python 3 |
|
SHA-256 checksum How to use checksums |
ede3947296db531b2691d9920eaab5c04afb0594def87c5e9abb8c6358f1cce4
|
|
BLAKE2b-256 checksum How to use checksums |
4d3f93629f87000ee77a8c0b80e6d427a522a319a0bdd25046ee27d23840287c
|
| Upload date | |
|
Uploaded using Trusted Publishing? What is trusted publishing? |
Yes |
| Uploaded via |
twine/7.0.0 CPython/3.13.14
|
Provenance
Provenance describes where a file came from. On PyPI, provenance is shared via attestations, which provide a verifiable record of the build or publishing details. View details, limitations and caveats.
PyPI Publish Attestation
PyPI verified that this artifact, at this checksum, originated from the publisher listed below.
Signed by GitHub Actions, verified by PyPI on Sep 23, 2026.
Transparency log













