A plugin to use with napari for clustering objects according to their properties
Project description
napari-clusters-plotter
A plugin to use with napari for clustering objects according to their properties.
This napari plugin was generated with Cookiecutter using with @napari's cookiecutter-napari-plugin template.
Usage
Starting point
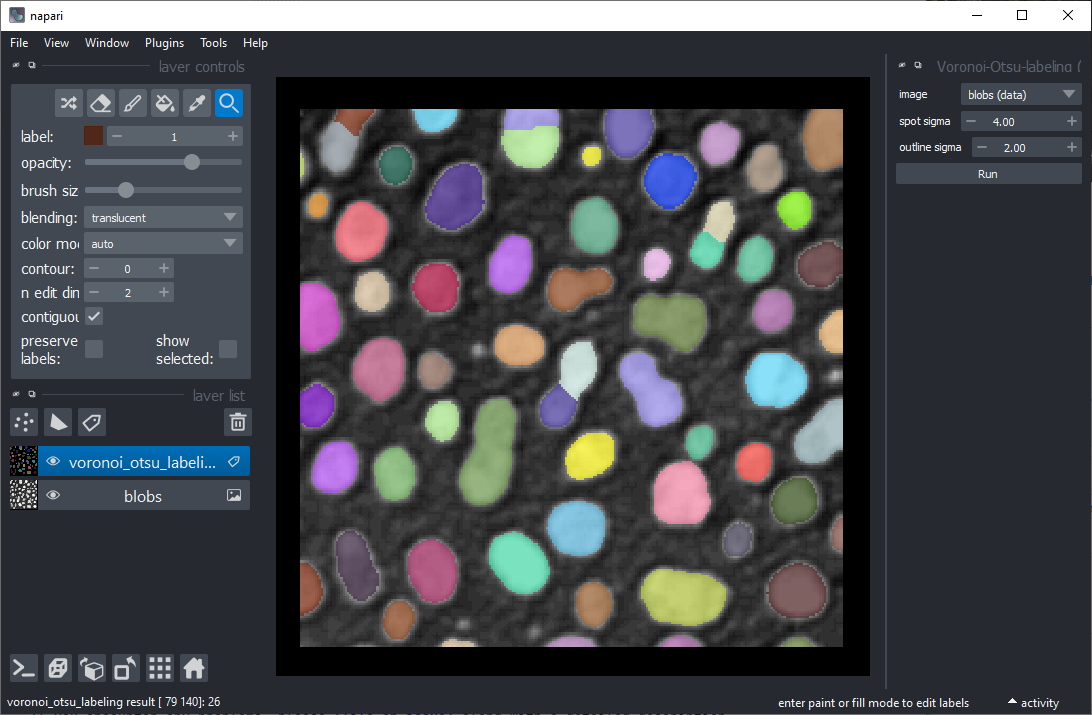
For clustering objects according to their properties, the starting point is a grey-value image and a label image representing a segmentation of objects. For segmenting objects, you can for example use the Voronoi-Otsu-labeling approach in the napari plugin napari-segment-blobs-and-things-with-membranes.
Measurements
The first step is deriving measurements from the labeled image and the corresponding pixels in the grey-value image.
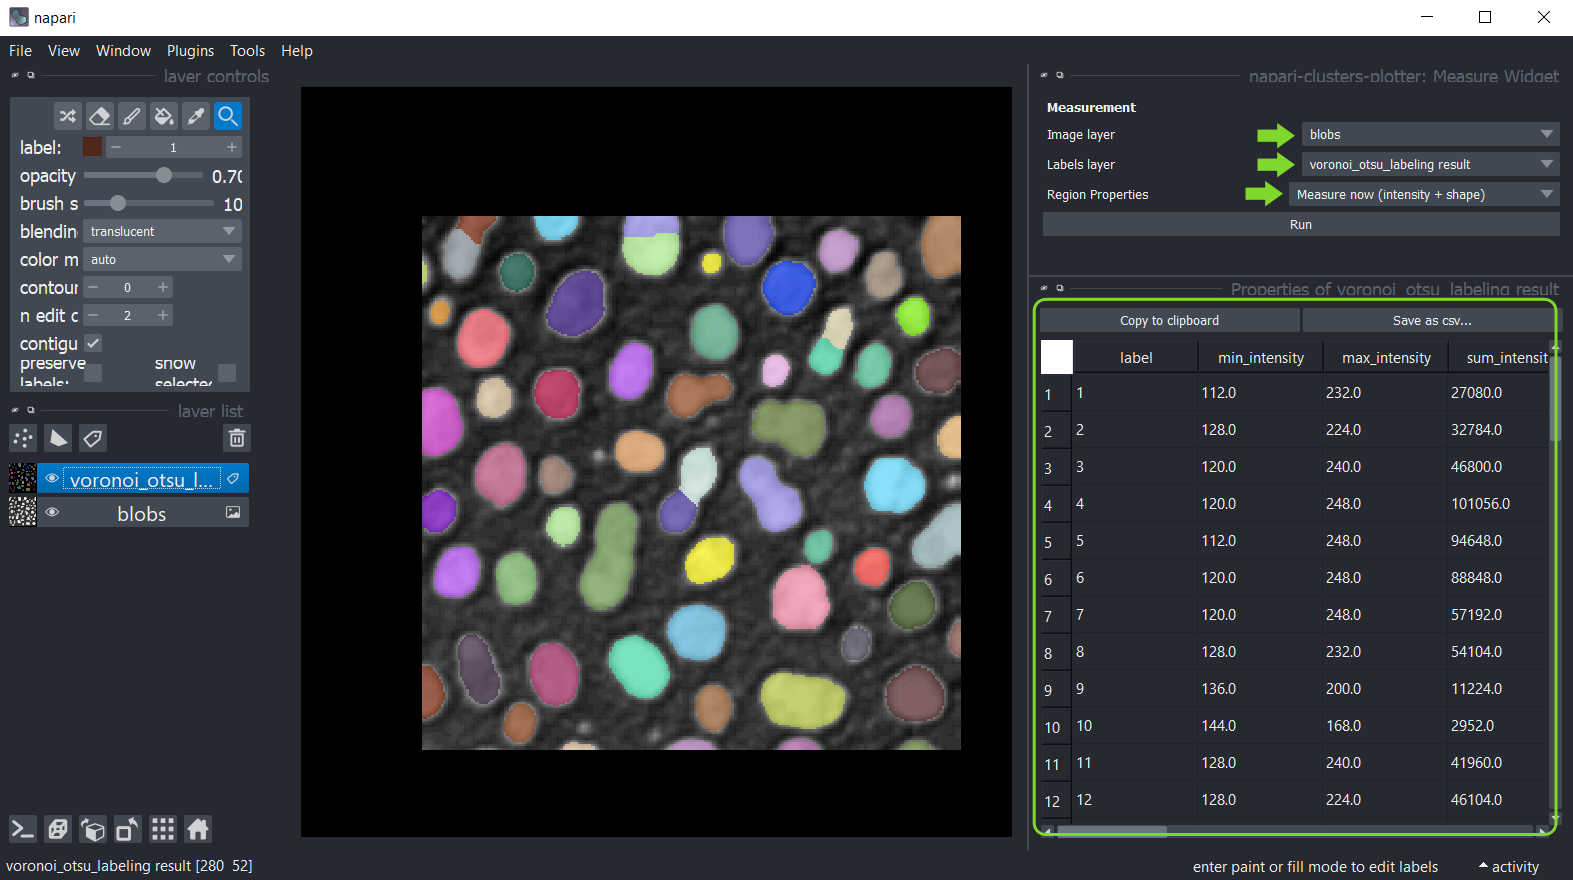
You can use the menu Tools > Measurement > Measure intensity, shape and neighbor counts (ncp) for that.
Just select the image, the corresponding label image and the measurements to analyse and click on Run.
A table with the measurements will open:
Afterwards, you can save and/or close the measurement table. Also, close the Measure widget. Or if you want you can interact with labels and see which row of the table corresponds to which labelled object. For this, use the Pick mode in napari and activate the show selected checkbox. Alternatively, you can also select a specific row of the table and appropriate label is displayed (make sure that show selected checkbox is selected).
Plotting
Once measurements were made, these measurements were saved in the properties of the labels layer which was analysed.
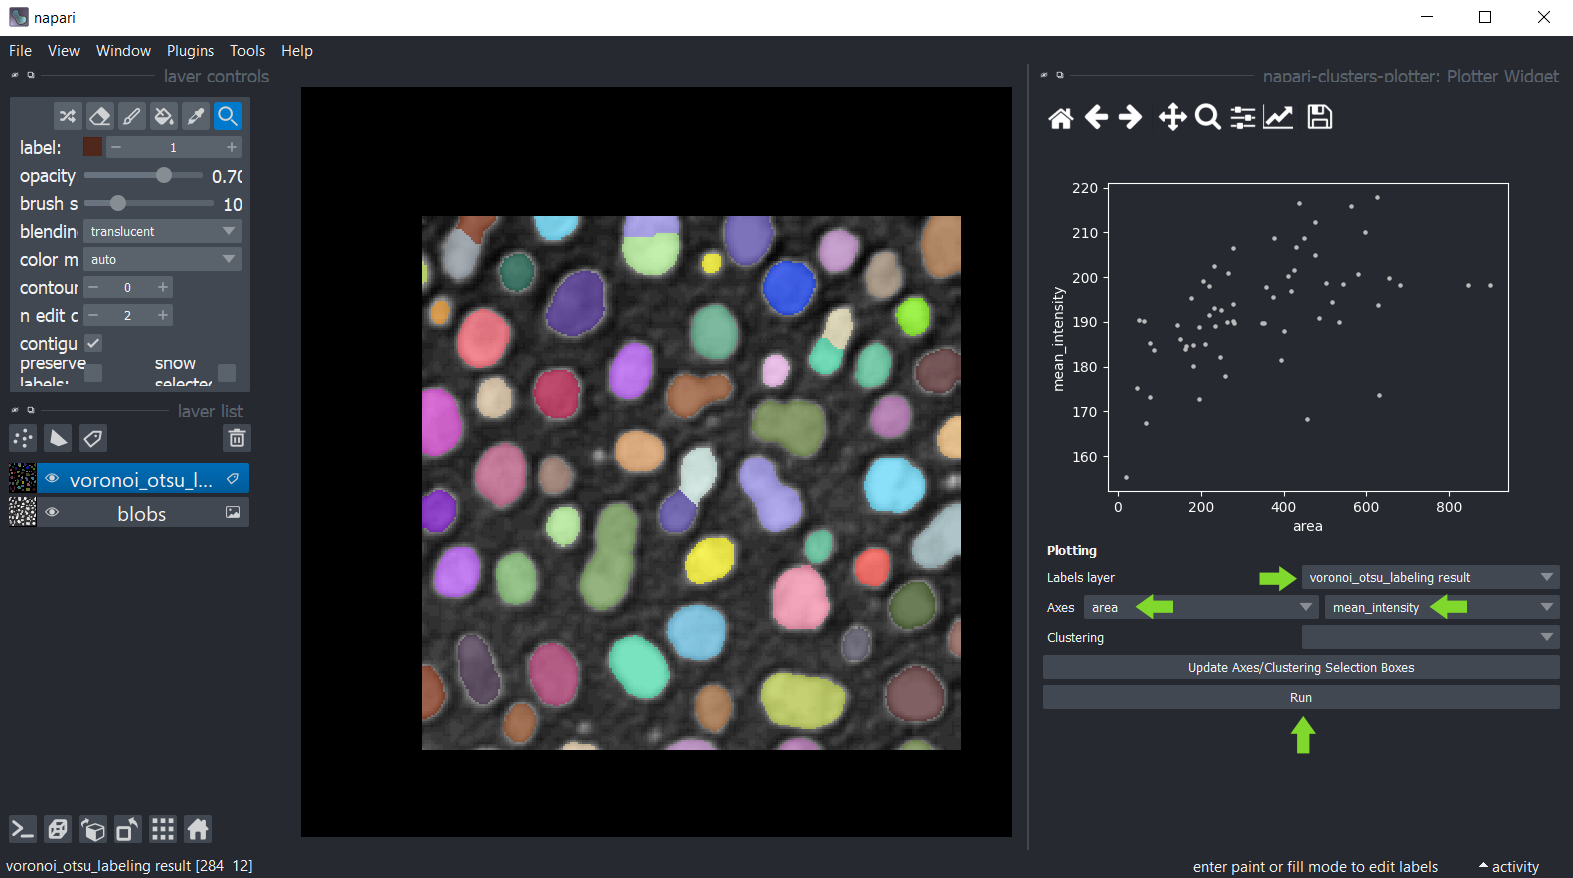
You can then plot these measurements using the menu Tools > Measurement > Plot measurement (ncp).
In this widget, you can select the labels layer which was analysed and the measurements which should be plotted on the X- and Y-axis. Click on Run to draw the data points in the plot area.
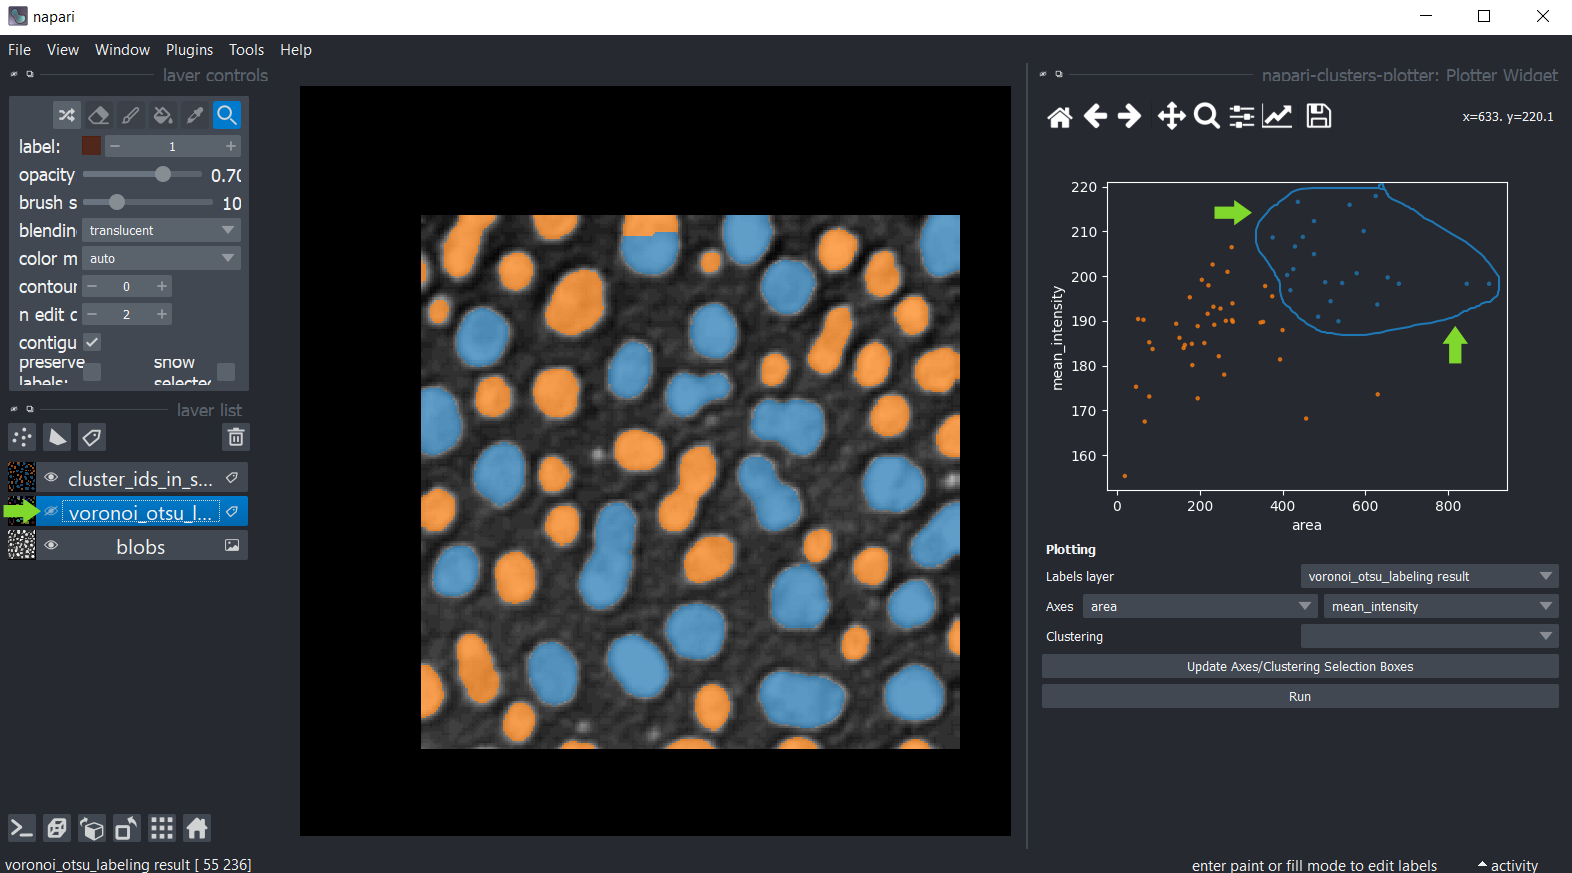
You can also manually select a region in the plot. To use lasso (freehand) tool use left mouse click, and to use a rectangle - right click. The resulting manual clustering will also be visualized in the original image. To optimize visualization in the image, turn off the visibility of the analysed labels layer.
You can also select a labeled object using the Pick mode in napari and see which data point in the plot it
corresponds to.
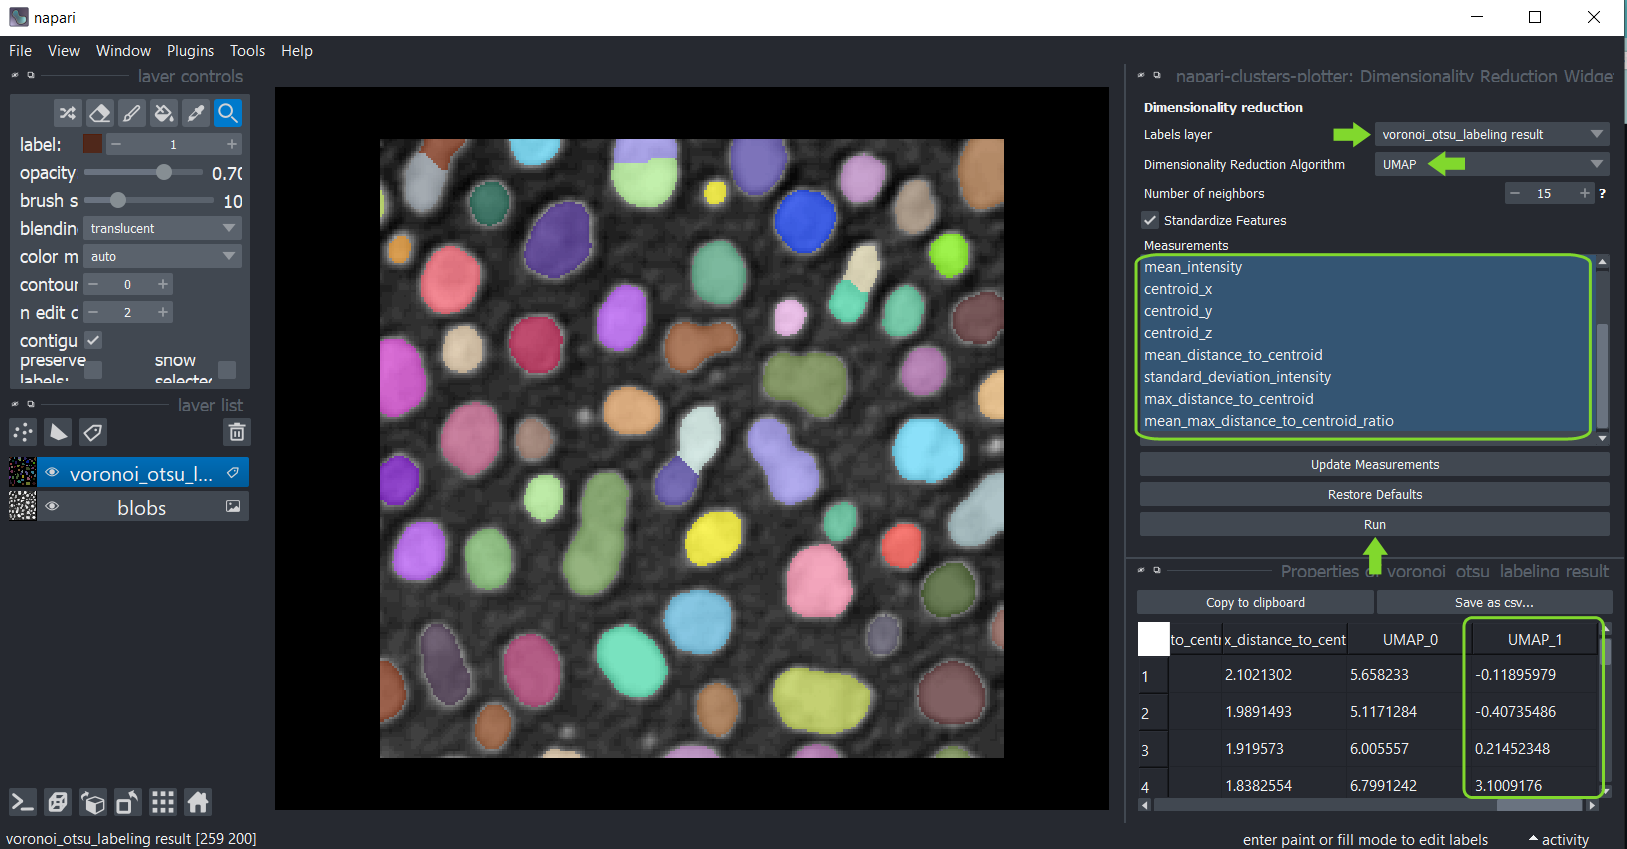
Dimensionality reduction: UMAP
For getting more insights into your data, you can reduce the dimensionality of the measurements, e.g.
using the UMAP algorithm.
To apply it to your data use the menu Tools > Measurement > UMAP dimensionality reduction (ncp).
Select the label image that was analyzed and in the list below, select all measurements that should be
dimensionality reduced. Make sure to unselect "label" and other "clustering" results, but
only quantitative measurements such as intensity, size and shape. Click on "Run" and after a moment,
the table of measurements will re-appear with two additional columns representing the reduced dimensions of the
dataset.
Afterwards, you can again save and/or close the table. Also, close the UMAP widget.
k-means clustering
If manual clustering, as shown above, is not an option, you can automatically cluster your data, e.g. using the
k-means clustering algorithm.
Therefore, click the menu Tools > Measurement > Clustering (ncp),
again, select the analyzed labels layer.
This time select the measurements for clustering, e.g. select only the UMAP measurements.
Select the clustering method KMeans and click on Run.
The table of measurements will reappear with an additional column KMEANS_CLUSTERING_ID containing the cluster ID of
each datapoint.
Afterwards, you can again save and/or close the table. Also, close the clustering widget.
Plotting k-means clustering results.
Return to the Plotter widget using the menu Tools > Measurement > Plot measurement (ncp).
Select UMAP_0 and UMAP_1 as X- and Y-axis and the KMEANS_CLUSTERING_ID as Cluster
Installation
- Get a python environment, e.g. via mini-conda. If you never used python/conda environments before, please follow the instructions here first.
- Install pyopencl, e.g. via conda:
conda install -c conda-forge pyopencl
Afterwards, you can install napari-clusters-plotter via pip:
pip install napari-clusters-plotter
Contributing
Contributions are very welcome. Tests can be run with tox, please ensure the coverage at least stays the same before you submit a pull request.
License
Distributed under the terms of the BSD-3 license, "napari-clusters-plotter" is free and open source software
Issues
If you encounter any problems, please [file an issue] along with a detailed description.
Project details
Release history Release notifications | RSS feed
Download files
Download the file for your platform. If you're not sure which to choose, learn more about installing packages.
Source Distribution
Built Distribution
Hashes for napari-clusters-plotter-0.1.1.tar.gz
| Algorithm | Hash digest | |
|---|---|---|
| SHA256 | a0624045773004b46b501f192ba0516b36d9c3889d8cd7bdeae1ab3f142ecc05 |
|
| MD5 | f56b19e6d552b7c3c249c15aab72901a |
|
| BLAKE2b-256 | 9df5a926f572add868a4ed1fcc60b69addbbfae4dd2ae2a50a23a366bfbbc119 |
Hashes for napari_clusters_plotter-0.1.1-py3-none-any.whl
| Algorithm | Hash digest | |
|---|---|---|
| SHA256 | 2f64de2914dc6ca6495d05f4517c05025128d087990882522519ffc44c361137 |
|
| MD5 | 2f2a30e915e96a5e193e932ec5a29a21 |
|
| BLAKE2b-256 | 4f2749b8f4b487906a3ffd19e5dfbcd94a26ceaf1f864f75e9c6f689dc5903db |


