A plugin to use with napari for clustering objects according to their properties


Project description
napari-clusters-plotter


A plugin to use with napari for clustering objects according to their properties.
This napari plugin was generated with Cookiecutter using with @napari's cookiecutter-napari-plugin template.

Demonstration of handling 3D time-lapse data:

Jump to:
Usage
Starting point
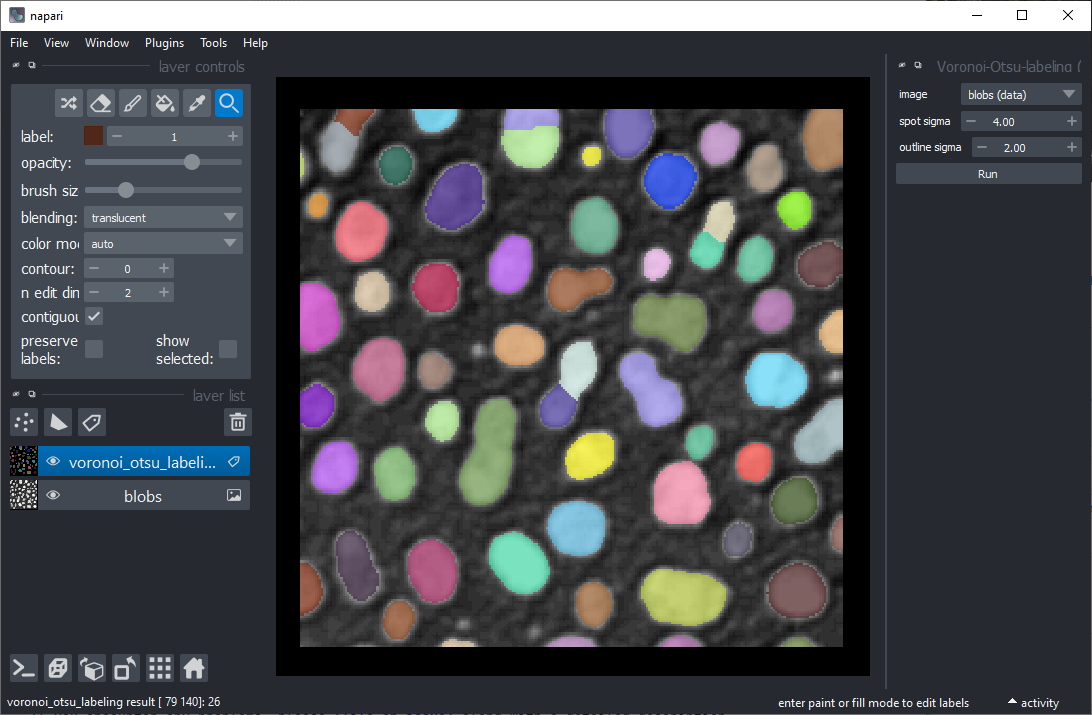
For clustering objects according to their properties, the starting point is a grey-value image and a label image representing a segmentation of objects. For segmenting objects, you can for example use the Voronoi-Otsu-labelling approach in the napari plugin napari-segment-blobs-and-things-with-membranes.
Measurements
The first step is deriving measurements from the labelled image and the corresponding pixels in the grey-value image.
Since the 0.6.0 release measurements widget is no longer part of this plugin and you will have to use other napari plugins to measure your data.
One way is to use the measurement functions in napari-skimage-regionprops, which comes pre-installed with the napari cluster plotter.
Use the menu Tools > Measurement tables > Regionprops (scikit-image, nsr) to get to the measurement widget.
Just select the image, the corresponding label image and the measurements to analyse and click on Run.
In the previous napari-cluster-plotter release a GPU dependant measurement function was implemented which you can find in the napari-pyclesperanto-assistant.
To use this function you will need to install this library (see optional installation steps) and you can find the widget under the menu Tools > Measurement tables > Label statistics (clEsperanto). As before, select the image, the corresponding label image and the measurements to analyse and click on Run.
A table with the measurements will open and afterwards, you can save and/or close the measurement table. Also, close the Measure widget.
If you want to upload your own measurements you can do this using napari-skimage-regionprops.
Under the menu Tools > Measurement tables > Load from CSV (nsr) you can find a widget to upload your own csv file.
Make sure that there is a column that specifies the which measurement belongs to which label by adding a column with the name "label".
If you don't specify this column it will be assumed that measurements start at 1 and each
column describes the next label.
Note that tables for time-lapse data need to include an additional column named "frame", which indicates which slice in time the given row refers to.
For the correct visualisation of clusters IDs in space, it is important that label images/time-points of the time-lapse
are either labelled sequentially or missing labels still exist in the loaded csv file (i.e., missing label exists in the
"label" column with NaN values for other measurements in the same row). If you perform measurements using before mentioned
plugins, the obtained dataframe is already in the correct form.
Time-Lapse Measurements
In case you have 2D time-lapse data you need to convert it into a suitable shape using the function: Tools > Utilities > Convert 3D stack to 2D time-lapse (time-slicer),
which can be found in the napari time slicer.
Note that tables for time-lapse data will include an additional column named "frame", which indicates which slice in time the given row refers to. If you want to import your own csv files for time-lapse data make sure to include this column! If you have tracking data where each column specifies measurements for a track instead of a label at a specific time point, this column must not be added.
Both napari-skimage-regionprops and napari-pyclesperanto-assistant include measuring widgets for timelapse data.
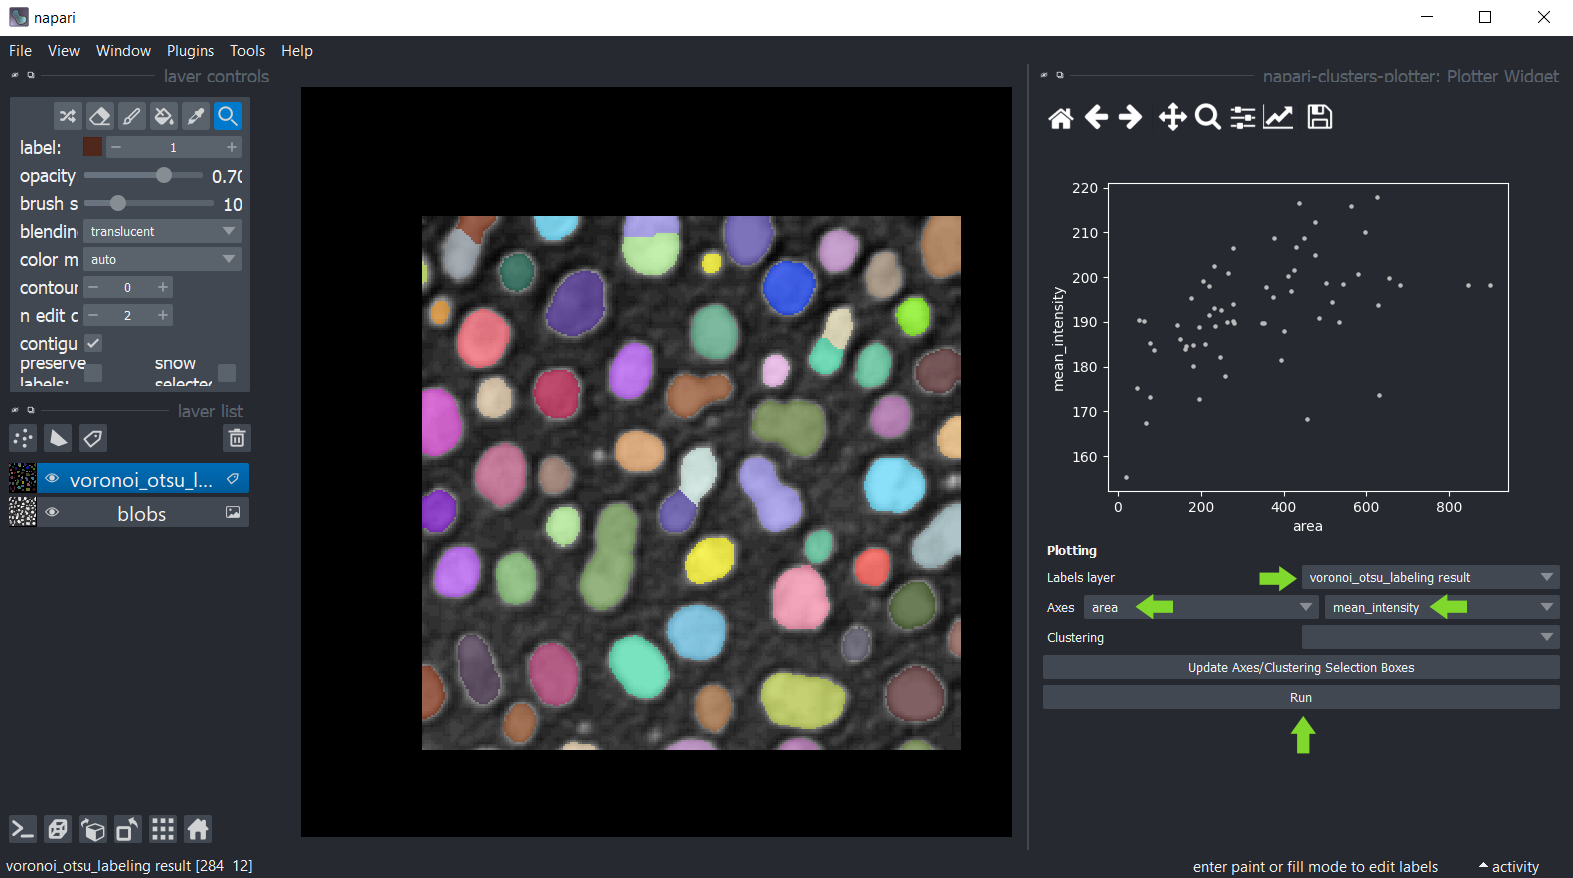
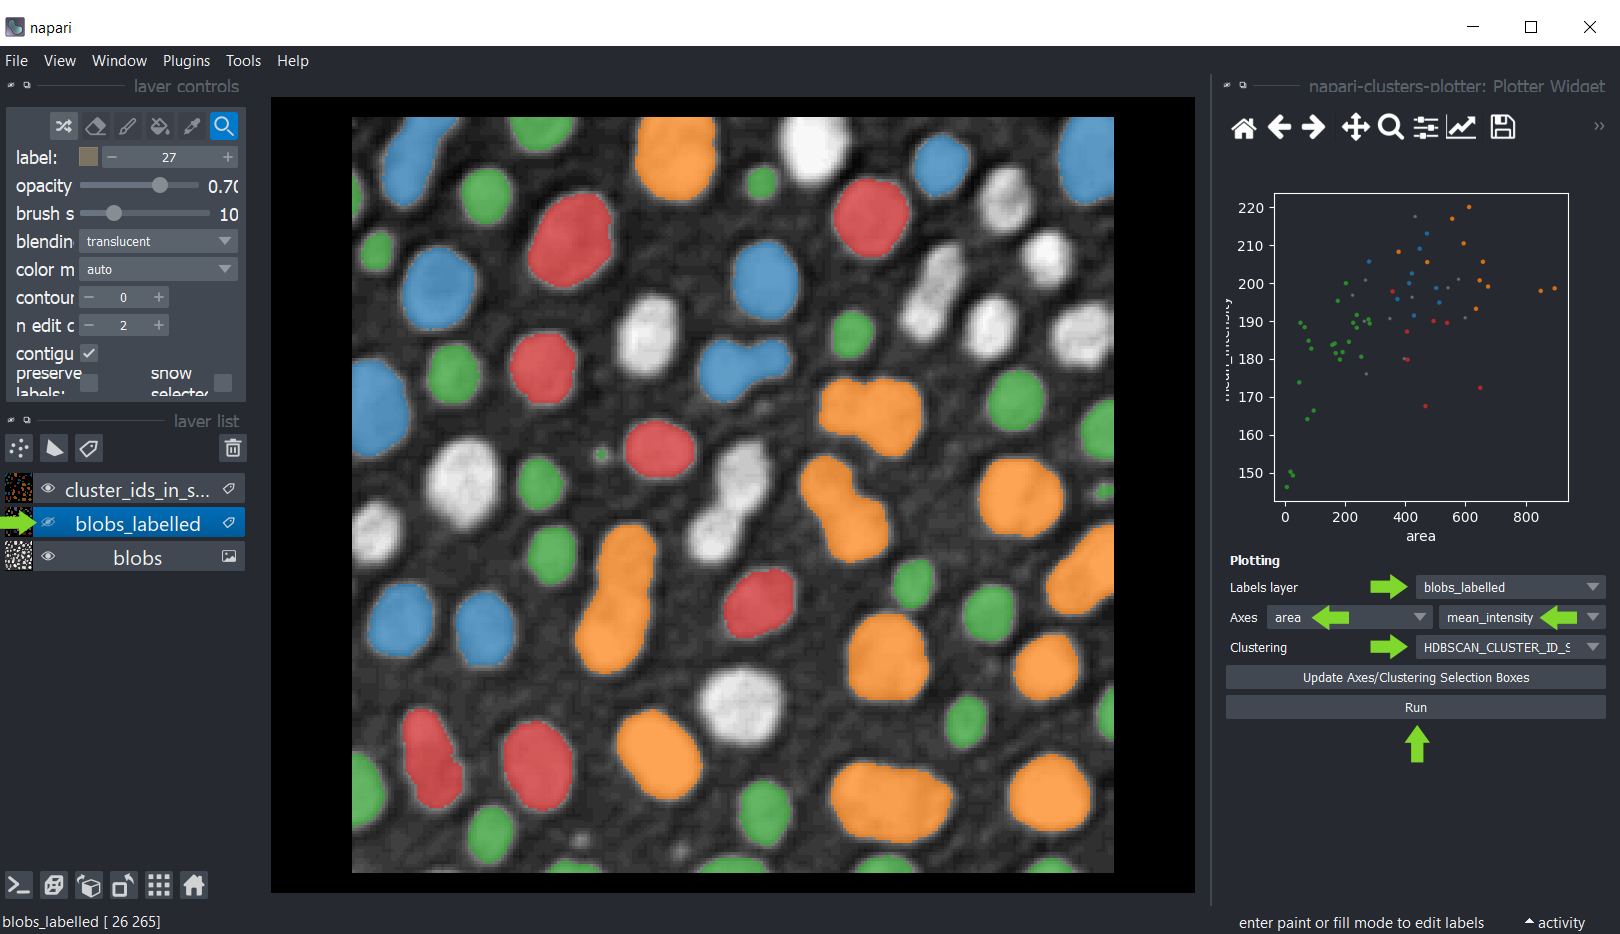
Plotting
Once measurements were made or uploaded, these measurements were saved in the properties/features of the labels layer which was
analysed. You can then plot these measurements using the menu Tools > Measurement tables > Plot measurement (ncp).
In this widget, you can select the labels layer which was analysed and the measurements which should be plotted
on the X- and Y-axis. If you cannot see any options in axes selection boxes, but you have performed measurements, click
on Update Axes/Clustering Selection Boxes to refresh them. Click on Run to draw the data points in the plot area.
You can also manually select a region in the plot. To use lasso (freehand) tool use left mouse click, and to use a rectangle - right click. The resulting manual clustering will also be visualized in the original image. To optimize visualization in the image, turn off the visibility of the analysed labels layer.
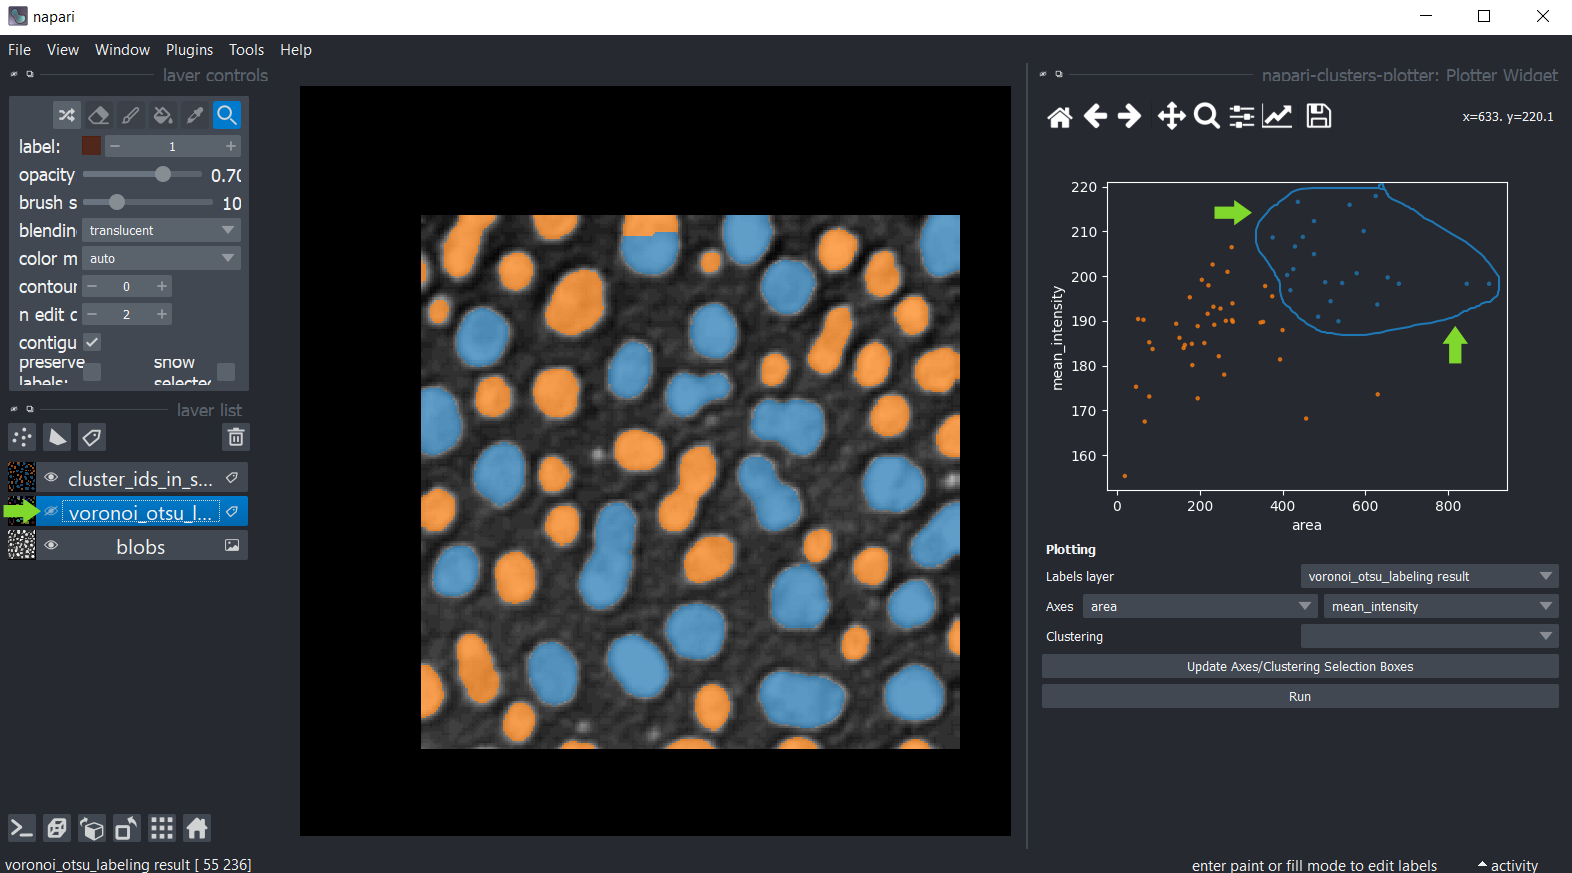
Hold down the SHIFT key while annotating regions in the plot to manually select multiple clusters.

Time-Lapse Plotting
When you plot your time-lapse datasets you will notice that the plots look slightly different. Datapoints of the current time frame are highlighted in white and you can see the datapoints move through the plot if you press play:

You can also manually select groups using the lasso tool and plot a measurement per frame and see how the group behaves in time. Furthermore, you could also select a group in time and see where the datapoints lie in a different feature space:

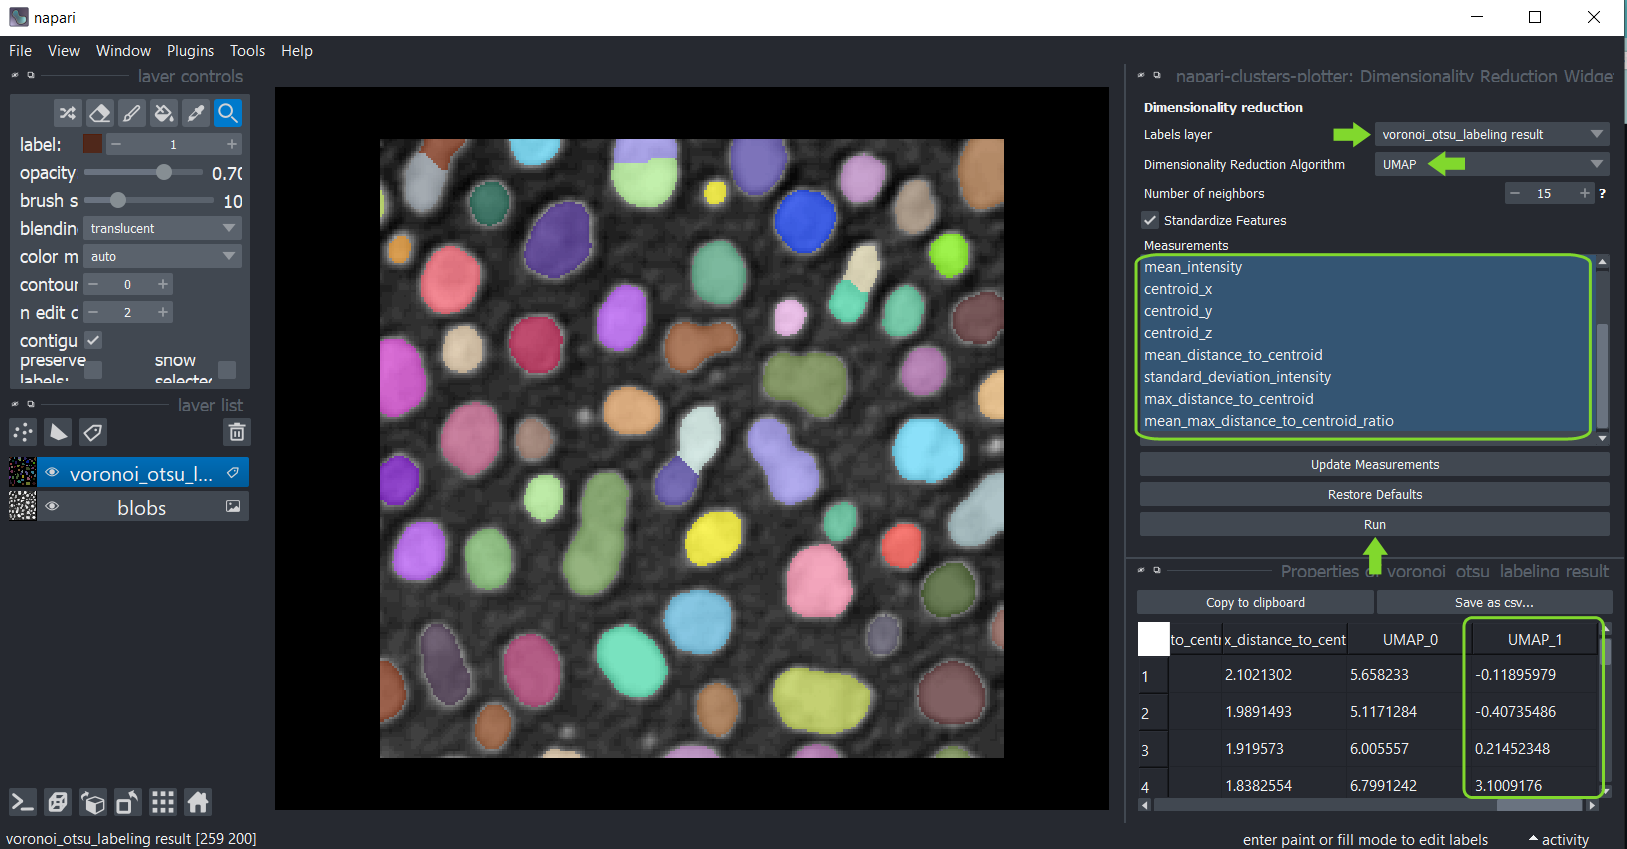
Dimensionality reduction: UMAP, t-SNE or PCA
For getting more insights into your data, you can reduce the dimensionality of the measurements, e.g.
using the UMAP algorithm, t-SNE
or PCA.
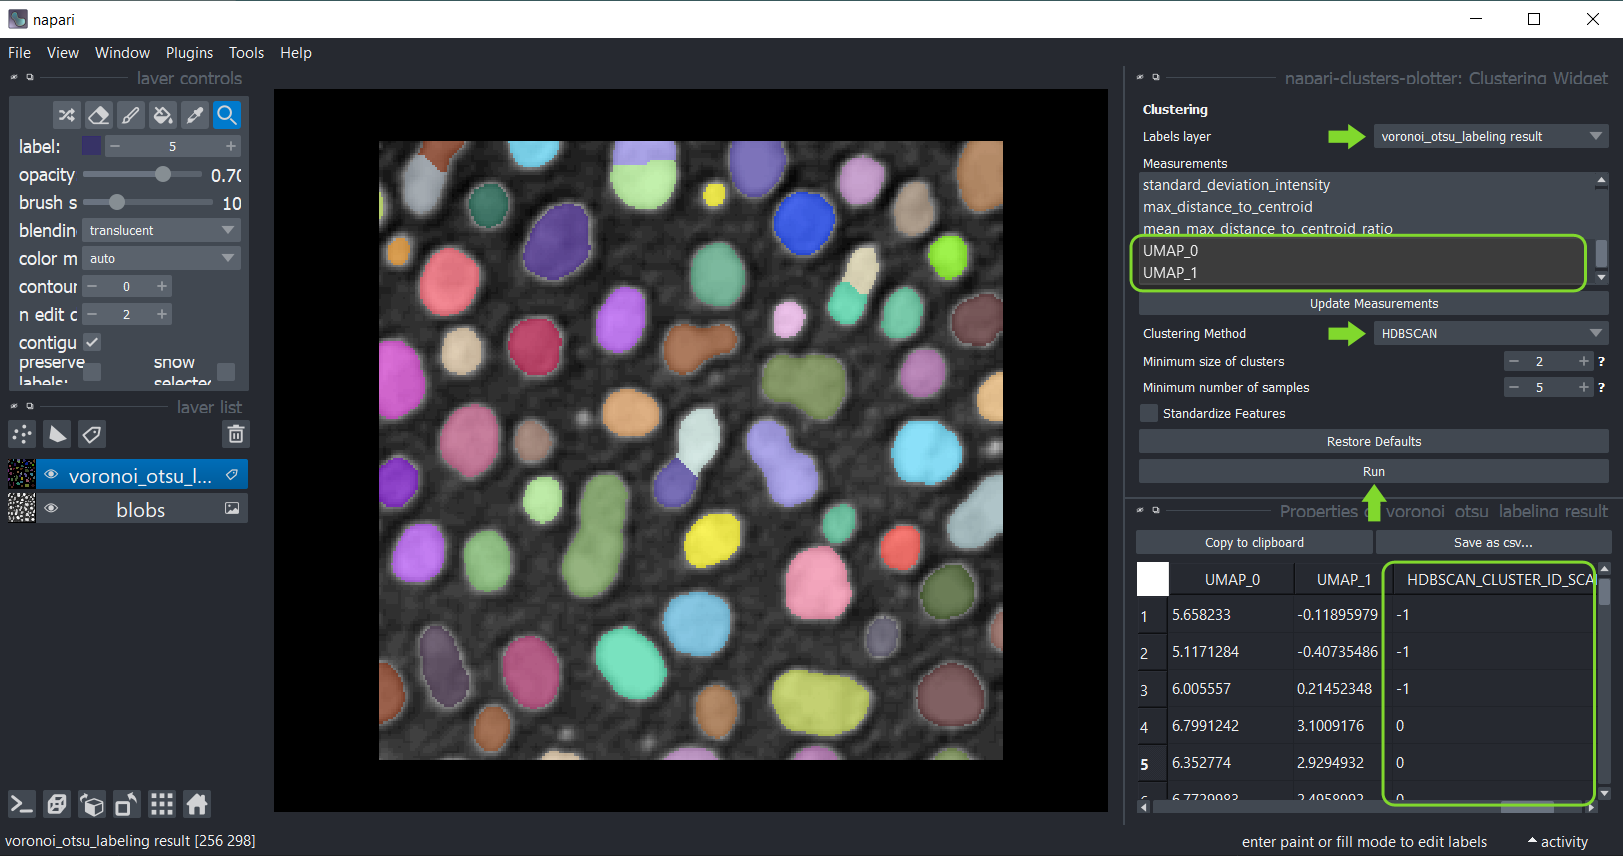
To apply it to your data use the menu Tools > Measurement post-processing > Dimensionality reduction (ncp).
Select the label image that was analysed and in the list below, select all measurements that should be
dimensionality reduced. By default, all measurements are selected in the box. If you cannot see any measurements, but
you have performed them, click on Update Measurements to refresh the box. You can read more about parameters of both
algorithms by hovering over question marks or by clicking on them. When you are done with the selection, click on Run
and after a moment, the table of measurements will re-appear with two additional columns representing the reduced
dimensions of the dataset. These columns are automatically saved in the properties of the labels layer so there is no
need to save them for usage in other widgets unless you wish to do so.
Afterwards, you can again save and/or close the table. Also, close the Dimensionality Reduction widget.
Clustering
If manual clustering, as shown above, is not an option, you can automatically cluster your data, using these implemented algorithms:
- k-means clustering (KMEANS)
- Hierarchical Density-Based Spatial Clustering of Applications with Noise (HDBSCAN)
- Gaussian Mixture Model (GMM)
- Mean Shift (MS)
- Agglomerative clustering (AC)
Therefore, click the menu Tools > Measurement post-processing > Clustering (ncp),
again, select the analysed labels layer.
This time select the measurements for clustering, e.g. select only the UMAP measurements.
Select the clustering method KMeans and click on Run.
The table of measurements will reappear with an additional column ALGORITHM_NAME_CLUSTERING_ID containing the cluster
ID of each datapoint.
Afterwards, you can again save and/or close the table. Also, close the clustering widget.
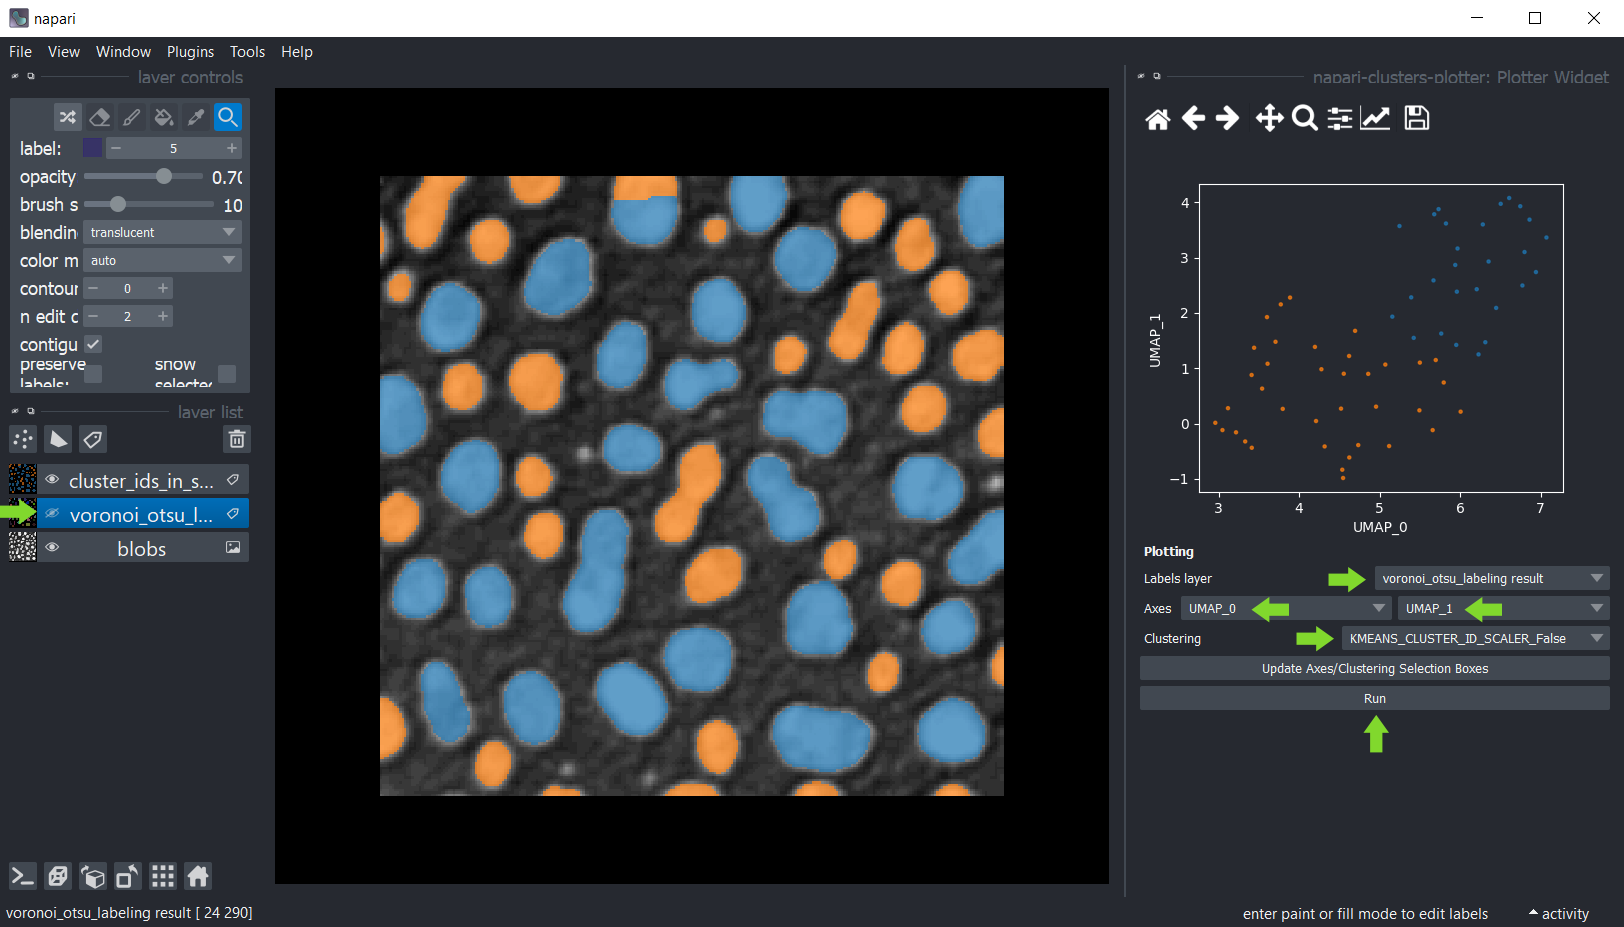
Plotting clustering results
Return to the Plotter widget using the menu Tools > Measurement tables > Plot measurement (ncp).
Select UMAP_0 and UMAP_1 as X- and Y-axis and the ALGORITHM_NAME_CLUSTERING_ID as Clustering, and click on Run.
Example of k-means clustering results:
Installation
Devbio-napari installation
The easiest way to install this plugin is to install the devbio-napari library. This library installs napari alongside many other useful plugins, including the napari-clusters-plotter. We recommend this library as it is not only the easiest way to install the napari-cluster-plotter, but it includes plugins for segmentation and measurement, which we don't provide. There are detailed installation instructions on the napari-hub-page if you have any problems installing it. In case you want to have a minimal installation of our plugin you can find other installation options below.
Minimal installation
- Get a python environment, e.g. via mini-conda. If you never used python/conda environments before, please follow the instructions here first. It is recommended to install python 3.9 to your new conda environment from the start. The plugin is not yet supported with Python 3.10. Create a new environment, for example, like this:
conda create --name ncp-env python=3.9
- Activate the new environment via conda:
conda activate ncp-env
conda install -c conda-forge napari
Afterwards, you can install napari-clusters-plotter, e.g. via conda:
conda install -c conda-forge napari-clusters-plotter
Optional installation
Follow these steps instead of the regular installation to include the napari-pyclesperanto-assistant. Creating the environment like this will allow you to use your GPU to render your cluster results. Furthermore, you can access the deprecated measurement functions of the napari-cluster-plotter in releases < 0.6.0. If you have trouble with this library you can use the regular installation above.
conda create --name ncp-env python==3.9
- Activate the new environment via conda:
conda activate ncp-env
- Install napari-pyclesperanto-assistant, e.g. with pip:
pip install napari-pyclesperanto-assistant
- Mac-users please also install this:
conda install -c conda-forge ocl_icd_wrapper_apple
- Linux users please also install this:
conda install -c conda-forge ocl-icd-system
python -m pip install "napari[all]"
conda install -c conda-forge napari
Afterwards, you can install napari-clusters-plotter, e.g. via conda:
conda install -c conda-forge napari-clusters-plotter
Troubleshooting installation
- If the plugin does not appear in napari 'Plugins' menu, and in 'Plugin errors...' you can see such an error:
ImportError: DLL load failed while importing _cl
Try downloading and installing a pyopencl with a lower cl version, e.g. cl12 : pyopencl=2020.1. However, in this case, you will need an environment with a lower python version (python=3.8).
Error: Could not build wheels for hdbscan which use PEP 517 and cannot be installed directly
This can happen if you used pip for the installation. To solve this error, install hdbscan via conda before installing the plugin:
conda install -c conda-forge hdbscan
ValueError: numpy.ndarray size changed, may indicate binary incompatibility. Expected 96 from C header, got 88 from PyObject
Similar to the above-described error, this error can occur when importing hdbscan through pip or in the wrong order. This can be fixed by installing packages separately through conda and in the following order:
conda install -c conda-forge napari pyopencl hdbscan
pip install napari-clusters-plotter
WARNING: No ICDs were foundorLogicError: clGetPlatformIDs failed: PLATFORM_NOT_FOUND_KHR
Make your system-wide implementation visible by installing either of the following conda packages:
conda install -c conda-forge ocl-icd-system
conda install -c conda-forge ocl_icd_wrapper_apple
Contributing
Contributions are very welcome. Tests can be run with pytest, please ensure the coverage at least stays the same before you submit a pull request.
License
Distributed under the terms of the BSD-3 license, "napari-clusters-plotter" is free and open source software
Acknowledgements
This project was supported by the Deutsche Forschungsgemeinschaft under Germany’s Excellence Strategy – EXC2068 - Cluster of Excellence "Physics of Life" of TU Dresden. This project has been made possible in part by grant number 2021-240341 (Napari plugin accelerator grant) from the Chan Zuckerberg Initiative DAF, an advised fund of the Silicon Valley Community Foundation.
Issues
If you encounter any problems, please file an issue along with a detailed description.
Release history Release notifications | RSS feed


Download files
Download the file for your platform. If you're not sure which to choose, learn more about installing packages.
Source Distribution
Built Distribution
Filter files by name, interpreter, ABI, and platform.
If you're not sure about the file name format, learn more about wheel file names.
Copy a direct link to the current filters
File details
Details for the file napari-clusters-plotter-0.6.1.tar.gz.
File metadata
- Download URL: napari-clusters-plotter-0.6.1.tar.gz
- Upload date:
- Size: 86.1 kB
- Tags: Source
- Uploaded using Trusted Publishing? No
- Uploaded via: twine/4.0.2 CPython/3.10.8
File hashes
| Algorithm | Hash digest | |
|---|---|---|
| SHA256 |
a883931bac88b78c5369268290b4c94f2b0a869ac518b074f2635c558f76dec6
|
|
| MD5 |
cf61cd508a6563ab0b3ff2f849856694
|
|
| BLAKE2b-256 |
a2829e49354a395d567c3cc1eea33392e364de2533b4dc597606bbdd895a4ed9
|
File details
Details for the file napari_clusters_plotter-0.6.1-py3-none-any.whl.
File metadata
- Download URL: napari_clusters_plotter-0.6.1-py3-none-any.whl
- Upload date:
- Size: 96.8 kB
- Tags: Python 3
- Uploaded using Trusted Publishing? No
- Uploaded via: twine/4.0.2 CPython/3.10.8
File hashes
| Algorithm | Hash digest | |
|---|---|---|
| SHA256 |
52af3e6c1560e0b27735c6ff0cd24b2a60fabd109141db5fa9ab71b3f56d779f
|
|
| MD5 |
d79ed9d9d755773b4be227944388b9f2
|
|
| BLAKE2b-256 |
849da4db4b48f4bc0cf5198ff24331b2c656cd8319041ffc640e5d6887fc66a9
|


