
Generate multi-table relational datasets with behavioral trajectories, correlations, and causal lags. Config-driven, deterministic, no real data required
Verified details
These details have been verified by PyPIProject links
GitHub Statistics
Maintainers

Project description





Python library to generate synthetic multi-table relational datasets — star schema, correlated metrics, dbt-seed-ready CSV & Parquet. Config-driven, deterministic, no real data required
pip install plotsim
plotsim generates multi-table relational datasets from a behavioral description. You define metrics, segments, and how entities behave over time — the engine produces a star schema where every value traces back to one trajectory. shape: every entity follows a behavioral trajectory, and every metric across every table reads from the same trajectory position. When engagement rises, revenue follows. When it declines, churn fires.
Quick start
from plotsim import create, generate_tables

cfg = create(
    about="Subscription customers",
    unit="customer",
    window=("2024-01", "2024-12", "monthly"),
    metrics=[
        {"name": "engagement", "type": "score", "polarity": "positive"},
        {"name": "payments",   "type": "count", "polarity": "positive"},
    ],
    segments=[
        {"name": "active",   "count": 50, "archetype": "growth"},
        {"name": "inactive", "count": 30, "archetype": "decline"},
    ],
)
tables = generate_tables(cfg)
for name, df in tables.items():
    print(f"{name}: {len(df)} rows")
# dim_date: 12 rows
# dim_customer: 80 rows
# fct_customer: 960 rows
Generate multi-table test data
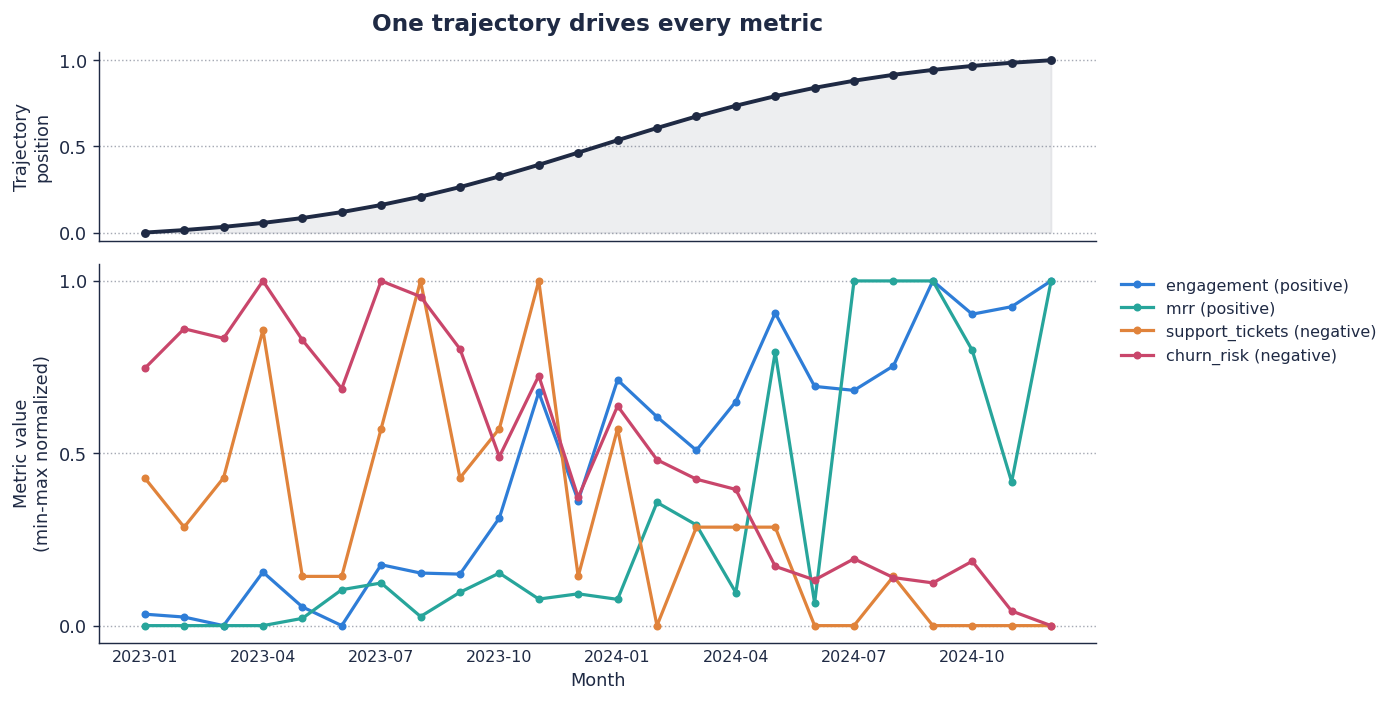
Top panel: one trajectory for one customer, 24 months. Bottom panel: four metrics on the same x-axis. Engagement and MRR rise with the trajectory; support tickets and churn risk fall as it rises. Every value reads from that one curve.
The same idea in tables — one company, twelve months, the same SaaS schema generated two ways:
Random columns (Faker-style) — every column is independent. The numbers don't agree.
| month | engagement | mrr | tickets | churn_risk |
|---|---|---|---|---|
| 2024-01 | 0.842 | $483 | 7 | 0.611 |
| 2024-02 | 0.117 | $4,201 | 0 | 0.043 |
| 2024-03 | 0.674 | $1,089 | 11 | 0.892 |
| 2024-04 | 0.298 | $112 | 2 | 0.355 |
| 2024-05 | 0.951 | $7,733 | 4 | 0.018 |
| 2024-06 | 0.024 | $964 | 9 | 0.477 |
| 2024-07 | 0.560 | $2,154 | 1 | 0.802 |
| 2024-08 | 0.405 | $328 | 6 | 0.220 |
| 2024-09 | 0.789 | $617 | 0 | 0.998 |
| 2024-10 | 0.131 | $5,440 | 8 | 0.156 |
| 2024-11 | 0.847 | $192 | 3 | 0.501 |
| 2024-12 | 0.334 | $3,876 | 12 | 0.063 |
Engagement at 0.95 with churn risk near zero, then 0.79 at the highest churn risk in the table. No story — only fields filled.
plotsim (trajectory-correlated) — plotsim run saas. Same dim_company row, twelve monthly rows from fct_engagement, fct_revenue, fct_support_tickets.
| month | engagement | mrr | tickets | churn_risk |
|---|---|---|---|---|
| 2024-01 | 0.587 | $1,191 | 0 | 0.261 |
| 2024-02 | 0.807 | $1,265 | 1 | 0.189 |
| 2024-03 | 1.000 | $3,532 | 2 | 0.129 |
| 2024-04 | 0.593 | $818 | 0 | 0.171 |
| 2024-05 | 0.904 | $3,567 | 2 | 0.237 |
| 2024-06 | 0.956 | $4,264 | 1 | 0.257 |
| 2024-07 | 1.000 | $302 | 2 | 0.000 |
| 2024-08 | 0.917 | $1,507 | 0 | 0.000 |
| 2024-09 | 1.000 | $890 | 1 | 0.000 |
| 2024-10 | 0.783 | $512 | 1 | 0.264 |
| 2024-11 | 0.956 | $837 | 0 | 0.000 |
| 2024-12 | 0.827 | $351 | 1 | 0.248 |
Engagement is climbing toward its plateau. MRR moves with it. Support tickets stay low. Churn risk stays near zero. All four columns read from the same underlying trajectory position — not from four independent random generators.
The contrast is the entire product.
Star schema output
A plotsim run produces a complete star schema in the chosen output directory:
output/
├── dim_date.csv                # complete date spine
├── dim_company.csv             # entity attributes (with SCD2 plan_tier)
├── dim_user.csv                # sub-entity attributes
├── dim_plan.csv                # reference lookup
├── fct_engagement.csv          # entity × period metrics
├── fct_revenue.csv             # entity × period metrics
├── fct_support_tickets.csv     # entity × period metrics
├── evt_login.csv               # proportional events
├── evt_churn.csv               # threshold-triggered events
├── config.yaml                 # frozen copy of the input config
└── validation_report.txt       # FK + PK + spine integrity checks
If a company's engagement trajectory declines, its login rows decrease in evt_login.csv and churn events appear in evt_churn.csv — both event tables read from the same trajectory the fact tables do.
Same config + same seed produces byte-identical output every time. CSV is the default; Parquet is one config flag away. See the output guide for format details and the manifest schema.
Who is this for
Educators and students who need realistic datasets for SQL courses, data modeling workshops, analytics training, or portfolio projects — five domain templates ready to go, same seed produces the same data every time.
Data engineers who need test fixtures that behave like production data — with FK integrity, realistic distributions, and configurable corruption — without copying production or hand-rolling three-row CSVs.
Data scientists who need labeled training data with known ground truth — archetype labels, trajectory positions, and temporal holdout splits — to validate models before touching real data.
Analytics engineers who need a star schema to build dbt models, test transformations, or demonstrate a pipeline end-to-end without waiting for upstream data.
BI and analytics teams who need a populated star schema to build dashboards, test reports, or demo a new tool to stakeholders — dims, facts, events, and SCD versioning out of the box.
Demo builders who need a convincing dataset for a conference talk, a product walkthrough, or a proof of concept — correlated metrics that tell a realistic story, not random noise.
How it works
flowchart LR
    %% Three input paths
    YAML["YAML config"]
    PY["Python · create()"]
    CLI["CLI · plotsim run"]

    %% Audit surface (read-only, post-generation)
    INS(["inspect · trace_metric_cell"])

    %% All three converge on the builder
    YAML --> BUILD
    PY --> BUILD
    CLI --> BUILD

    BUILD["Builder · interpret<br/>UserInput → PlotsimConfig"]

    %% Schema gate
    BUILD --> SCHEMA
    SCHEMA{{"Schema gate<br/>Pydantic + cell-budget"}}

    %% Engine — trajectory hub
    SCHEMA --> TRAJ
    TRAJ(((Trajectory<br/>engine)))

    %% Generation-mode decision (only on the fact-table path)
    TRAJ -->|"position p"| MODE{"Mode<br/>serial / vectorized<br/>(auto: group ≥ 50)"}

    %% Direct & transitive consumers
    MODE --> METR["Metrics → Facts"]
    TRAJ -->|"banding"| SCDB["Bands → SCD-2 dims"]
    METR -->|"threshold on value"| EVTR["Triggers → Events"]

    %% Architectural firewall — static / pool dims bypass trajectory
    SCHEMA -.firewall.-> SDIMS["Static + pool dims"]

    %% Quality injection (deliberate defects)
    METR --> QLT
    EVTR --> QLT
    SCDB --> QLT
    SDIMS --> QLT
    QLT["Quality injection<br/>nulls · dupes · type-mismatch · late-arrival"]

    %% Validation (integrity checks)
    QLT --> VAL["38 validators<br/>FK · PK · temporal · PSD"]

    %% Outputs diverge
    VAL --> CSV[("CSV / Parquet")]
    VAL --> MAN[("manifest.json")]
    VAL --> RPT[("validation report")]

    %% Audit back-edge
    MAN -.audit.-> INS

    classDef gate fill:#eef2ff,stroke:#1f2a44,stroke-width:2px,color:#1f2a44
    classDef hub fill:#1f2a44,color:#fff,stroke:#1f2a44,stroke-width:3px
    classDef store fill:#e6f4f1,stroke:#1f2a44,color:#1f2a44
    classDef audit fill:#f4f0fa,stroke:#5a3da3,color:#1f2a44
    classDef decision fill:#fff8d6,stroke:#1f2a44,color:#1f2a44

    class SCHEMA gate
    class TRAJ hub
    class CSV,MAN,RPT store
    class INS audit
    class MODE decision
Every entity in the dataset follows a behavioral trajectory — a curve shape like growth, decline, seasonal, or spike-then-crash. At each time period, the entity's position on that curve determines every metric value across every table. Revenue, engagement, churn risk, and support tickets all read from the same position, so they move together the way real business metrics do.
Metric relationships are enforced through a Gaussian copula —
declare engagement opposes churn_risk and the engine delivers the
configured correlation coefficient regardless of whether one metric
is beta-distributed and the other is Poisson. Causal lags compose:
if A → B (lag 2) → C (lag 3), then C reflects A from 5 periods ago.
Output is deterministic. Every random draw flows through a single
seeded numpy.Generator. Same config + same seed = byte-identical
tables within the same Python and dependency versions. The manifest records
every generation decision — archetype assignments, trajectory
positions, correlation adjustments, quality injections — so any
cell value can be traced back to its origin.
Config-time validation catches problems before generation starts: circular causal chains, non-positive-definite correlation matrices, broken foreign key references, duplicate metric names, and SQL-unsafe identifiers all surface as parse errors with fix suggestions.
See the docs site for the full pipeline.
Docs
mohossam01.github.io/plotsim — quickstart, user guide, tutorials, API reference, cookbooks.
Contributing
See CONTRIBUTING.md for dev setup, test commands, and how to add templates.
License
Project details
Verified details
These details have been verified by PyPIProject links
GitHub Statistics
Maintainers
Release history Release notifications | RSS feed


Download files
Download the file for your platform. If you're not sure which to choose, learn more about installing packages.
Source Distribution
Built Distribution
Filter files by name, interpreter, ABI, and platform.
If you're not sure about the file name format, learn more about wheel file names.
Copy a direct link to the current filters
File details
Details for the file plotsim-0.6.1.tar.gz.
File metadata
- Download URL: plotsim-0.6.1.tar.gz
- Upload date:
- Size: 506.0 kB
- Tags: Source
- Uploaded using Trusted Publishing? Yes
- Uploaded via: twine/6.1.0 CPython/3.13.13
File hashes
| Algorithm | Hash digest | |
|---|---|---|
| SHA256 |
19724fbdb9a4e6900cc51adbb8f9c3e7e73783c93f66a5f2d13ae024cacc7699
|
|
| MD5 |
da48c3494309bcac3011583894c0bc34
|
|
| BLAKE2b-256 |
a848fe36c8cf3ed71692975a921fe78224636445eb4189775941ce87d681abfb
|
Provenance
The following attestation bundles were made for plotsim-0.6.1.tar.gz:
Publisher:
release.yml on mohossam01/plotsim
-
Statement:
-
Statement type:
https://in-toto.io/Statement/v1 -
Predicate type:
https://docs.pypi.org/attestations/publish/v1 -
Subject name:
plotsim-0.6.1.tar.gz -
Subject digest:
19724fbdb9a4e6900cc51adbb8f9c3e7e73783c93f66a5f2d13ae024cacc7699 - Sigstore transparency entry: 1484492497
- Sigstore integration time:
-
Permalink:
mohossam01/plotsim@e4955ab21f90a01abea3a44621dea5fe8b459496 -
Branch / Tag:
refs/heads/main - Owner: https://github.com/mohossam01
-
Access:
public
-
Token Issuer:
https://token.actions.githubusercontent.com -
Runner Environment:
github-hosted -
Publication workflow:
release.yml@e4955ab21f90a01abea3a44621dea5fe8b459496 -
Trigger Event:
workflow_dispatch
-
Statement type:
File details
Details for the file plotsim-0.6.1-py3-none-any.whl.
File metadata
- Download URL: plotsim-0.6.1-py3-none-any.whl
- Upload date:
- Size: 276.2 kB
- Tags: Python 3
- Uploaded using Trusted Publishing? Yes
- Uploaded via: twine/6.1.0 CPython/3.13.13
File hashes
| Algorithm | Hash digest | |
|---|---|---|
| SHA256 |
6e1259ecc6952437a240adc6f507ba796598433b40b3d51a3413b9b7c55a160b
|
|
| MD5 |
6598fe18e730f711380e7102788b162e
|
|
| BLAKE2b-256 |
35b74f07456afb7a4dc398773834c7ddc3a0a277093cbdc35327c909649479aa
|
Provenance
The following attestation bundles were made for plotsim-0.6.1-py3-none-any.whl:
Publisher:
release.yml on mohossam01/plotsim
-
Statement:
-
Statement type:
https://in-toto.io/Statement/v1 -
Predicate type:
https://docs.pypi.org/attestations/publish/v1 -
Subject name:
plotsim-0.6.1-py3-none-any.whl -
Subject digest:
6e1259ecc6952437a240adc6f507ba796598433b40b3d51a3413b9b7c55a160b - Sigstore transparency entry: 1484492512
- Sigstore integration time:
-
Permalink:
mohossam01/plotsim@e4955ab21f90a01abea3a44621dea5fe8b459496 -
Branch / Tag:
refs/heads/main - Owner: https://github.com/mohossam01
-
Access:
public
-
Token Issuer:
https://token.actions.githubusercontent.com -
Runner Environment:
github-hosted -
Publication workflow:
release.yml@e4955ab21f90a01abea3a44621dea5fe8b459496 -
Trigger Event:
workflow_dispatch
-
Statement type:






