High performance, non blocking profiler for Python web apps.

Project description

Profilis
A high performance, non-blocking profiler for Python web applications.


Overview
Profilis provides drop-in observability across APIs, functions, and database queries with minimal performance impact. It's designed to be:
- Non blocking: Async collection with configurable batching and backpressure handling
- Framework agnostic: Works with Flask and custom applications (FastAPI/Sanic planned)
- Database aware: Built-in support for SQLAlchemy (pyodbc/MongoDB/Neo4j planned)
- Production ready: Configurable sampling, error tracking, and multiple export formats
Features
- Request Profiling: Automatic HTTP request/response timing and status tracking
- Function Profiling: Decorator-based function timing with exception tracking
- Database Instrumentation: SQLAlchemy query performance monitoring with row counts
- Built-in UI: Real-time dashboard for monitoring and debugging
- Multiple Exporters: JSONL (with rotation), Console
- Runtime Context: Distributed tracing with trace/span ID management
- Configurable Sampling: Control data collection volume in production
Installation
Install the core package with optional dependencies for your specific needs:
Option 1: Using pip with extras (Recommended)
# Core package only
pip install profilis

# With Flask support
pip install profilis[flask]

# With database support
pip install profilis[flask,sqlalchemy]

# With all integrations
pip install profilis[all]
Option 2: Using requirements files
# Minimal setup (core only)
pip install -r requirements-minimal.txt

# Flask integration
pip install -r requirements-flask.txt

# SQLAlchemy integration
pip install -r requirements-sqlalchemy.txt

# All integrations
pip install -r requirements-all.txt
Option 3: Manual installation
# Core dependencies
pip install typing_extensions>=4.0

# Flask support
pip install flask[async]>=3.0

# SQLAlchemy support
pip install sqlalchemy>=2.0 aiosqlite greenlet

# Performance optimization
pip install orjson>=3.8
Quick Start
Flask Integration
from flask import Flask
from profilis.flask.adapter import ProfilisFlask
from profilis.exporters.jsonl import JSONLExporter
from profilis.core.async_collector import AsyncCollector

# Setup exporter and collector
exporter = JSONLExporter(dir="./logs", rotate_bytes=1024*1024, rotate_secs=3600)
collector = AsyncCollector(exporter, queue_size=2048, batch_max=128, flush_interval=0.1)

# Create Flask app and integrate Profilis
app = Flask(__name__)
profilis = ProfilisFlask(
    app,
    collector=collector,
    exclude_routes=["/health", "/metrics"],
    sample=1.0  # 100% sampling
)

@app.route('/api/users')
def get_users():
    return {"users": ["alice", "bob"]}

# Start the app
if __name__ == "__main__":
    app.run(debug=True)
Function Profiling
from profilis.decorators.profile import profile_function
from profilis.core.emitter import Emitter
from profilis.exporters.console import ConsoleExporter
from profilis.core.async_collector import AsyncCollector

# Setup profiling
exporter = ConsoleExporter(pretty=True)
collector = AsyncCollector(exporter, queue_size=128, flush_interval=0.2)
emitter = Emitter(collector)

@profile_function(emitter)
def expensive_calculation(n: int) -> int:
    """This function will be automatically profiled."""
    result = sum(i * i for i in range(n))
    return result

@profile_function(emitter)
async def async_operation(data: list) -> list:
    """Async functions are also supported."""
    processed = [item * 2 for item in data]
    return processed

# Use the profiled functions
result = expensive_calculation(1000)
Manual Event Emission
from profilis.core.emitter import Emitter
from profilis.exporters.jsonl import JSONLExporter
from profilis.core.async_collector import AsyncCollector
from profilis.runtime import use_span, span_id

# Setup
exporter = JSONLExporter(dir="./logs")
collector = AsyncCollector(exporter)
emitter = Emitter(collector)

# Create a trace context
with use_span(trace_id=span_id()):
    # Emit custom events
    emitter.emit_req("/api/custom", 200, dur_ns=15000000)  # 15ms
    emitter.emit_fn("custom_function", dur_ns=5000000)      # 5ms
    emitter.emit_db("SELECT * FROM users", dur_ns=8000000, rows=100)

# Close collector to flush remaining events
collector.close()
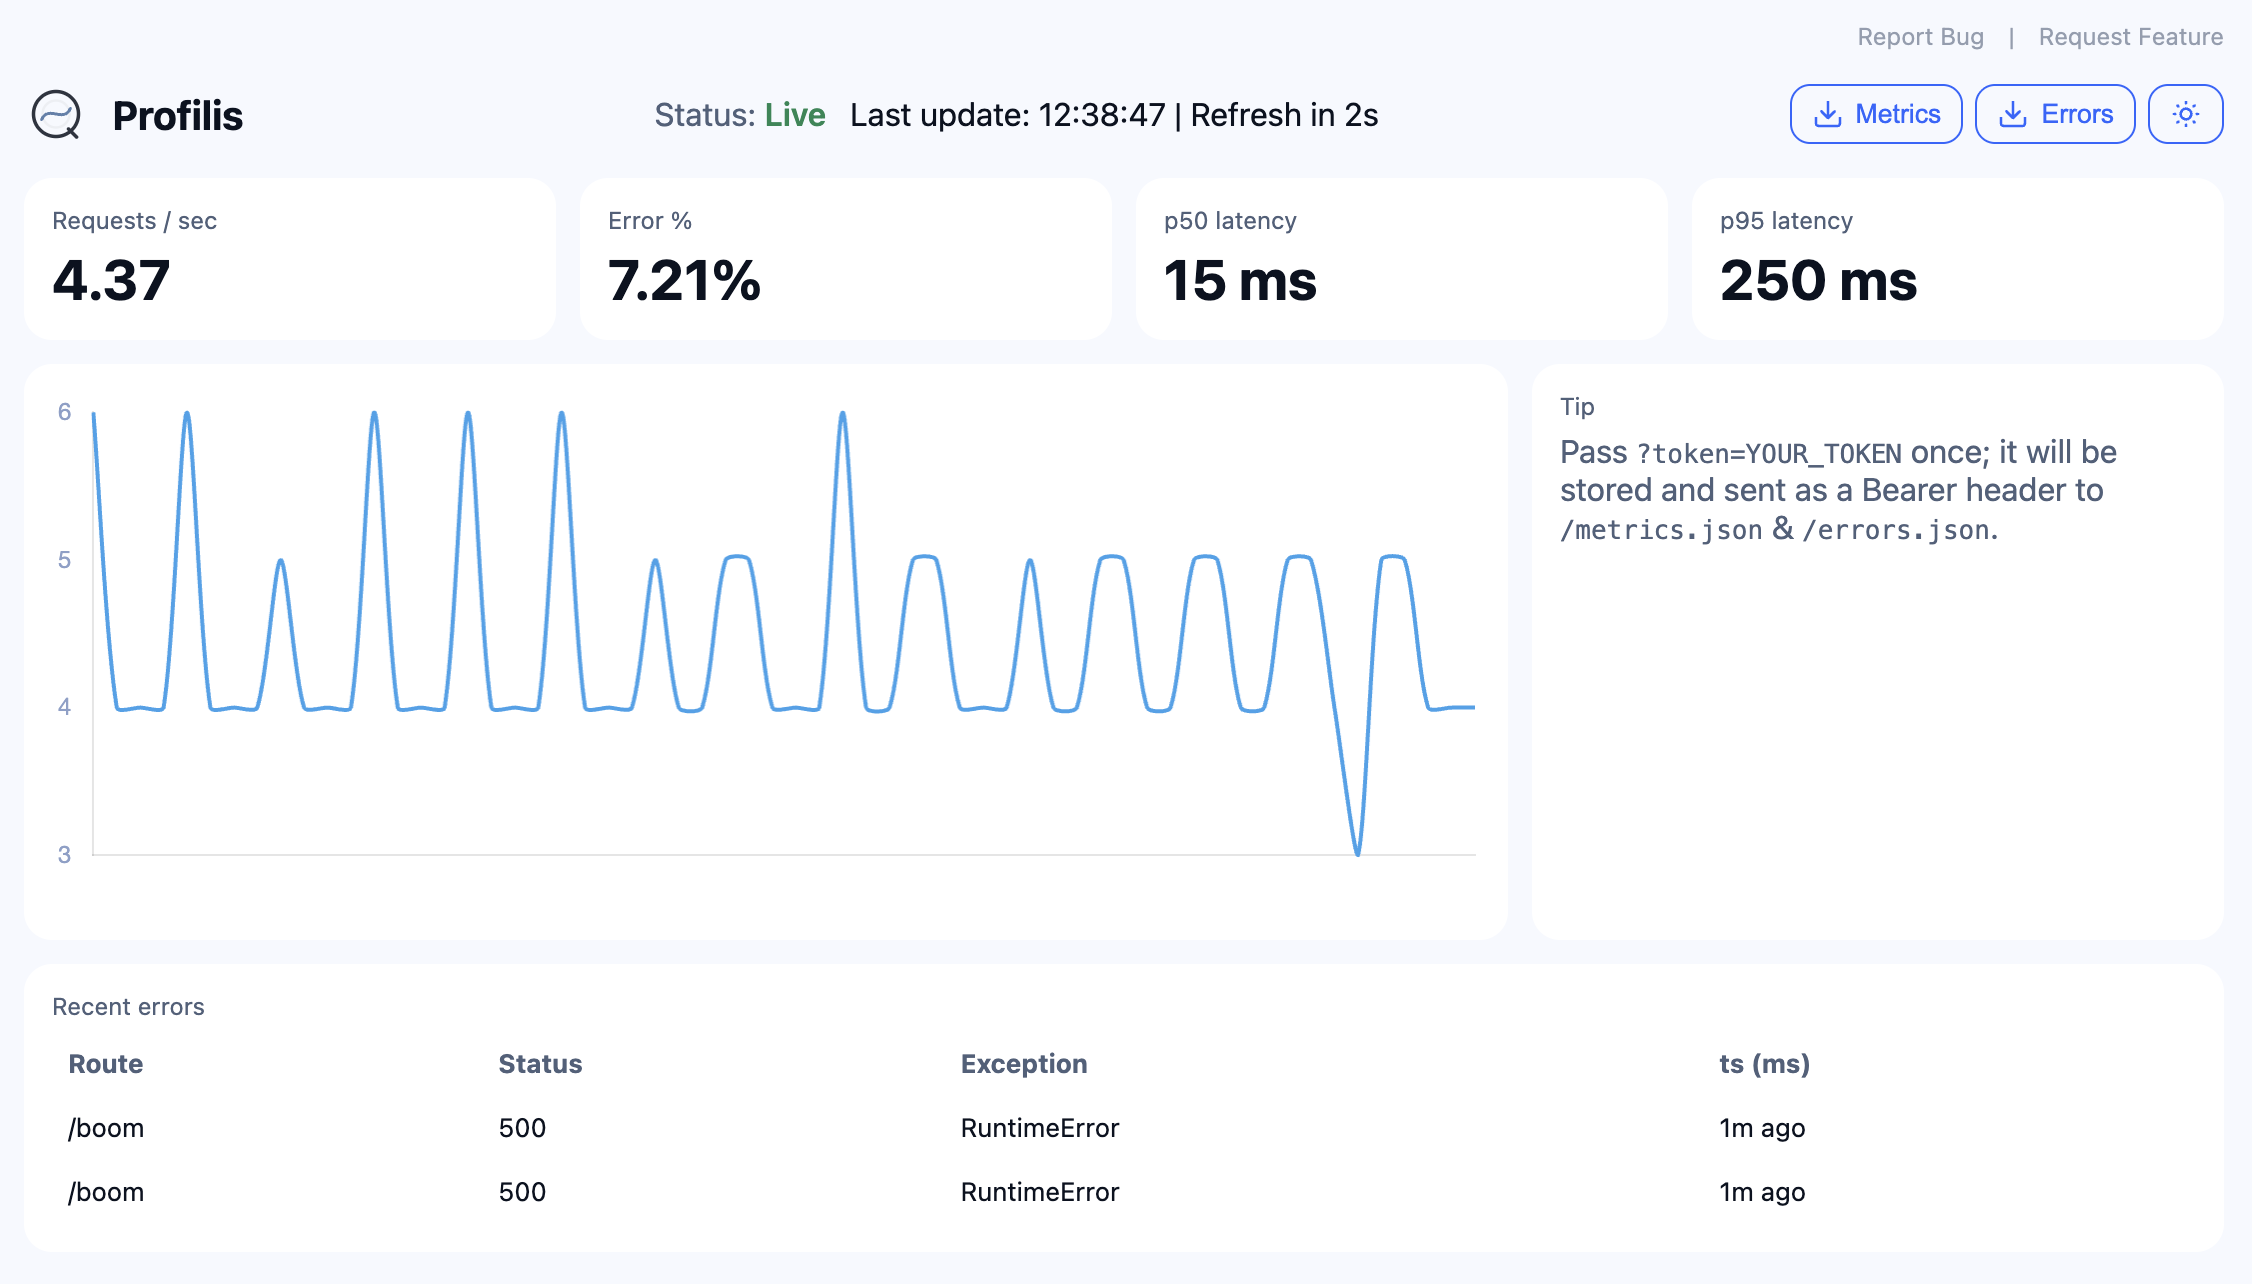
Built-in Dashboard
from flask import Flask
from profilis.flask.ui import make_ui_blueprint
from profilis.core.stats import StatsStore

app = Flask(__name__)
stats = StatsStore()  # 15-minute rolling window

# Mount the dashboard at /_profilis
ui_bp = make_ui_blueprint(stats, ui_prefix="/_profilis")
app.register_blueprint(ui_bp)

# Visit http://localhost:5000/_profilis to see the dashboard
Advanced Usage
Custom Exporters
from profilis.core.async_collector import AsyncCollector
from profilis.exporters.base import BaseExporter

class CustomExporter(BaseExporter):
    def export(self, events: list[dict]) -> None:
        for event in events:
            # Custom export logic
            print(f"Custom export: {event}")

# Use custom exporter
exporter = CustomExporter()
collector = AsyncCollector(exporter)
Runtime Context Management
from profilis.runtime import use_span, span_id, get_trace_id, get_span_id

# Create distributed trace context
with use_span(trace_id="trace-123", span_id="span-456"):
    current_trace = get_trace_id()  # "trace-123"
    current_span = get_span_id()    # "span-456"

    # Nested spans inherit trace context
    with use_span(span_id="span-789"):
        nested_span = get_span_id()  # "span-789"
        parent_trace = get_trace_id() # "trace-123"
Performance Tuning
from profilis.core.async_collector import AsyncCollector

# High-throughput configuration
collector = AsyncCollector(
    exporter,
    queue_size=8192,        # Large queue for high concurrency
    batch_max=256,          # Larger batches for efficiency
    flush_interval=0.05,    # More frequent flushing
    drop_oldest=True        # Drop events under backpressure
)

# Low-latency configuration
collector = AsyncCollector(
    exporter,
    queue_size=512,         # Smaller queue for lower latency
    batch_max=32,           # Smaller batches for faster processing
    flush_interval=0.01,    # Very frequent flushing
    drop_oldest=False       # Don't drop events
)
Configuration
Environment Variables
# Note: Environment variable support is planned for future releases
# Currently, all configuration is done programmatically
Sampling Strategies
# Random sampling
profilis = ProfilisFlask(app, collector=collector, sample=0.1)  # 10% of requests

# Route-based sampling
profilis = ProfilisFlask(
    app,
    collector=collector,
    exclude_routes=["/health", "/metrics", "/static"],
    sample=1.0
)
Exporters
JSONL Exporter
from profilis.exporters.jsonl import JSONLExporter

# With rotation
exporter = JSONLExporter(
    dir="./logs",
    rotate_bytes=1024*1024,  # 1MB per file
    rotate_secs=3600         # Rotate every hour
)
Console Exporter
from profilis.exporters.console import ConsoleExporter

# Pretty-printed output for development
exporter = ConsoleExporter(pretty=True)

# Compact output for production
exporter = ConsoleExporter(pretty=False)
Performance Characteristics
- Event Creation: ≤15µs per event
- Memory Overhead: ~100 bytes per event
- Throughput: 100K+ events/second on modern hardware
- Latency: Sub-millisecond collection overhead
Documentation
Full documentation is available at: Profilis Docs
Docs are written in Markdown under docs/ and built with MkDocs Material.
Available Documentation
- Getting Started - Quick setup and basic usage
- Configuration - Tuning and customization
- Flask Integration - Flask adapter documentation
- SQLAlchemy Support - Database instrumentation
- JSONL Exporter - Log file output
- Built-in UI - Dashboard documentation
- Architecture - System design
To preview locally:
pip install mkdocs mkdocs-material mkdocs-mermaid2-plugin
mkdocs serve
Development
- See Contributing and Development Guidelines.
- Branch strategy: trunk‑based (
feat/*,fix/*,perf/*,chore/*). - Commits follow Conventional Commits.
Roadmap
See Profilis – v0 Roadmap Project and docs/overview/roadmap.md.
License


Download files
Download the file for your platform. If you're not sure which to choose, learn more about installing packages.
Source Distribution
Built Distribution
Filter files by name, interpreter, ABI, and platform.
If you're not sure about the file name format, learn more about wheel file names.
Copy a direct link to the current filters
File details
Details for the file profilis-0.2.0.tar.gz.
File metadata
- Download URL: profilis-0.2.0.tar.gz
- Upload date:
- Size: 41.1 kB
- Tags: Source
- Uploaded using Trusted Publishing? No
- Uploaded via: twine/6.1.0 CPython/3.13.5
File hashes
| Algorithm | Hash digest | |
|---|---|---|
| SHA256 |
cb0acb99cc3f5421f380c1d31a740ebff1eff55f76a29fe07360317995d8823c
|
|
| MD5 |
ca971ee438f2e22c489fcf49d1493ffe
|
|
| BLAKE2b-256 |
ed08497274dc2e07fb4372ffb10f37e0244a92e939a3ca85f35007ed62eef5bd
|
File details
Details for the file profilis-0.2.0-py3-none-any.whl.
File metadata
- Download URL: profilis-0.2.0-py3-none-any.whl
- Upload date:
- Size: 34.4 kB
- Tags: Python 3
- Uploaded using Trusted Publishing? No
- Uploaded via: twine/6.1.0 CPython/3.13.5
File hashes
| Algorithm | Hash digest | |
|---|---|---|
| SHA256 |
443e75ce7aff7261d52c8787f57d7814be454568c3d70d232a05f3826a59d423
|
|
| MD5 |
4340a9a4e7342508f9fa603e8e869757
|
|
| BLAKE2b-256 |
2db97e78e53b7eb31b62e43d35b0bbbba4e97c00b72a44229d17edffa4650aeb
|


