Lightweight Cohort Flow Diagrams built on Matplotlib — with an interactive browser-based generator.

Project description

pycohortflow


Lightweight cohort flow diagrams built on Matplotlib.
Turn a plain Python list of cohort steps into a publication-ready vertical flow chart with a single function call. Colours, fonts, spacing, and box geometry are fully customisable via TOML configuration files.
About
pycohortflow is a Python library for programmatically generating cohort flow diagrams — vertical flowcharts that document participant progression through clinical studies, randomised controlled trials and systematic reviews, with explicit exclusion counts and reasons at each step.
The library targets the reproducibility and reporting-standard requirements of medical research. Cohort flow diagrams in this form are required by CONSORT (Consolidated Standards of Reporting Trials) for randomised trials and PRISMA 2020 (Preferred Reporting Items for Systematic Reviews and Meta-Analyses) for systematic reviews and meta-analyses. pycohortflow produces the structural elements those standards expect — a vertical main column with side panels for exclusions, automatic participant-count tracking and customisable per-step labels — without prescribing a single fixed template.
Diagrams are defined as data: a Python list of cohort steps drives the layout, exclusion counts are computed automatically with non-decreasing-N validation, and visual style is controlled by version-controllable TOML files held separately from the data. The same input renders the same diagram across machines and over time, eliminating the manual vector-editor adjustments that typically break reproducibility between manuscript revisions. Output formats include PNG, SVG, PDF and EPS, ready for journal submission.
No Python installed?
Use the Interactive Generator to build diagrams directly in your browser and export them as SVG, PNG or PDF.
Installation
pip install pycohortflow
Quick Start
from pycohortflow import plot_cfd
import matplotlib.pyplot as plt

data = [
    {"heading": "Registered Patients", "N": 350,
     "description": "Total patients registered in database"},
    {"heading": "Screening", "N": 150,
     "exclusion_description": "Did not meet inclusion criteria"},
    {"heading": "Eligible", "N": 120,
     "exclusion_description": "Declined / Lost to follow-up"},
    {"heading": "Final Analysis", "N": 115,
     "exclusion_description": "Data incomplete"},
]

fig, ax = plot_cfd(
    data,
    figure_title="Clinical Cohort Flow Diagram",
)
plt.show()
Built-in Styles
Three styles ship with the package:
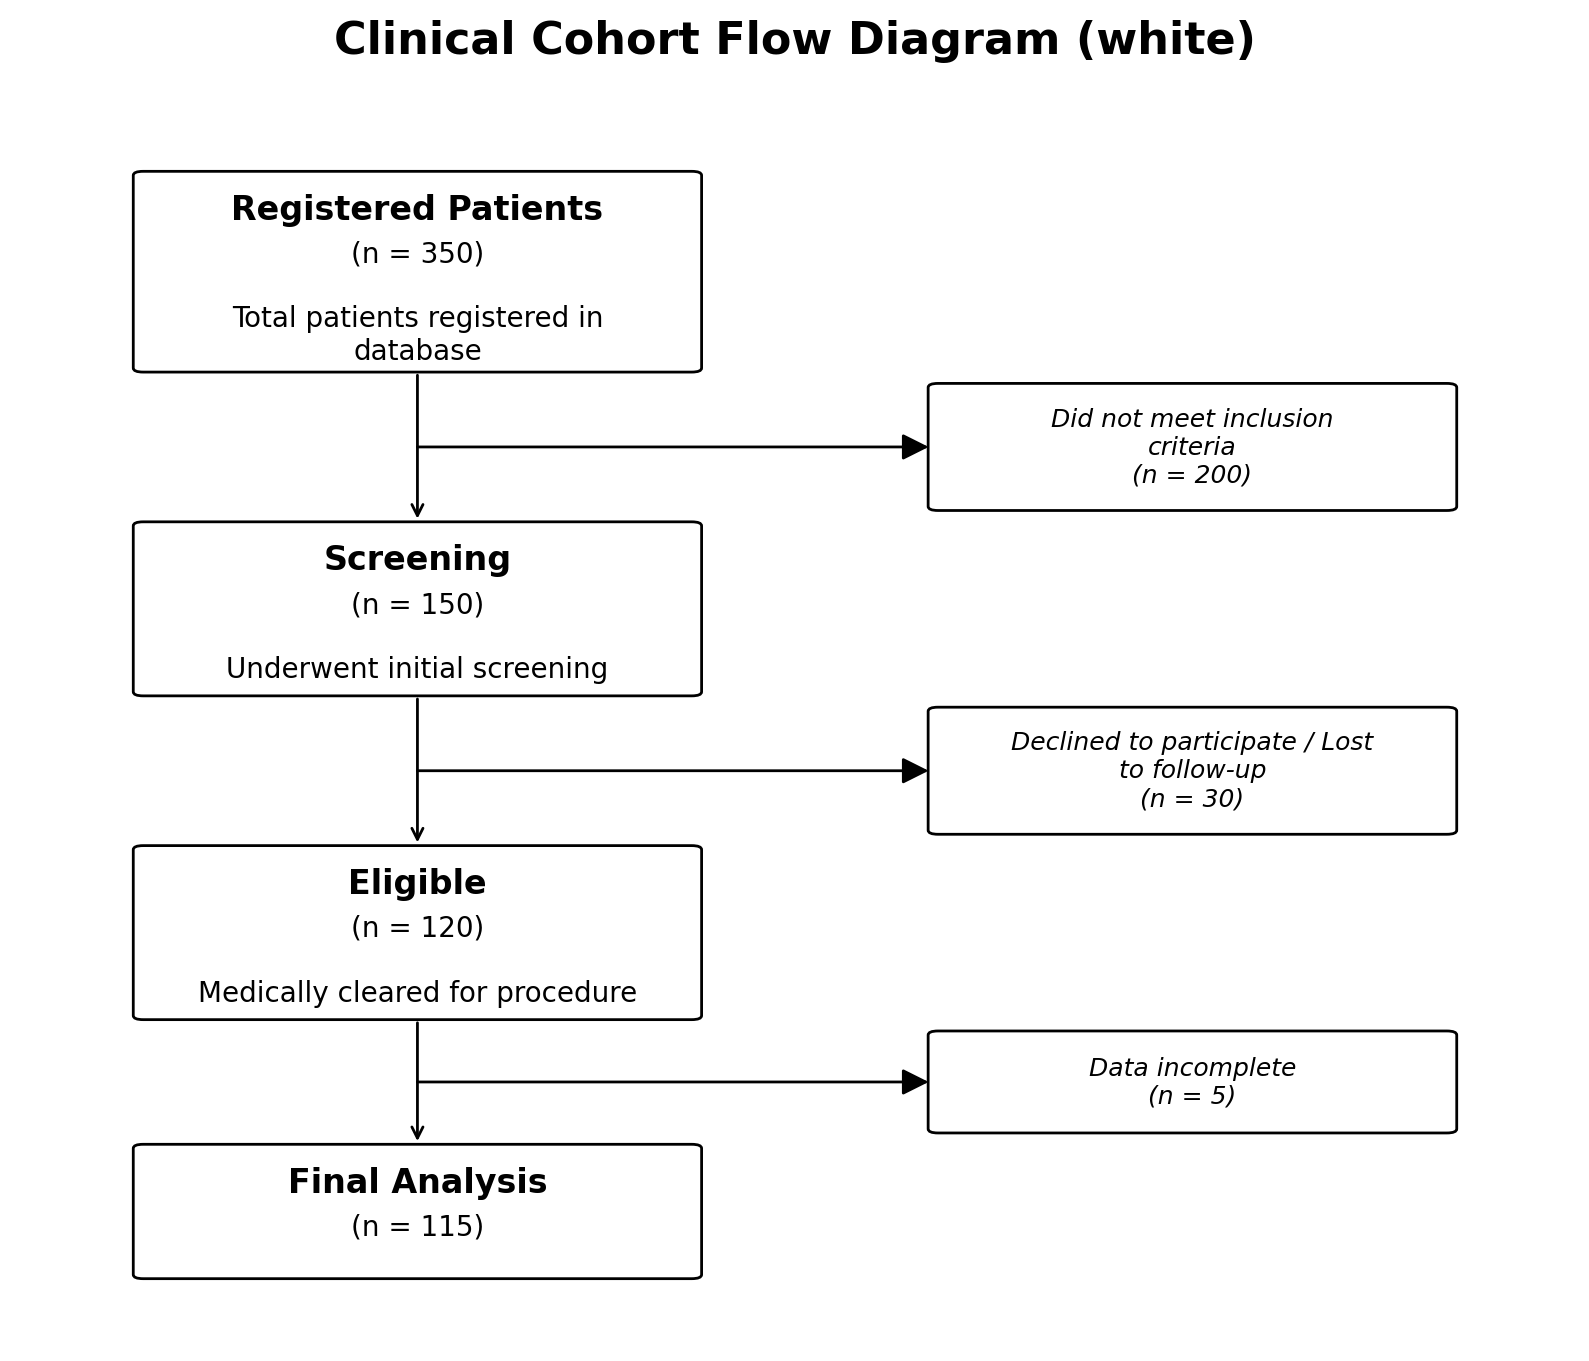
# Clean white boxes (default)
fig, ax = plot_cfd(data, style="white")
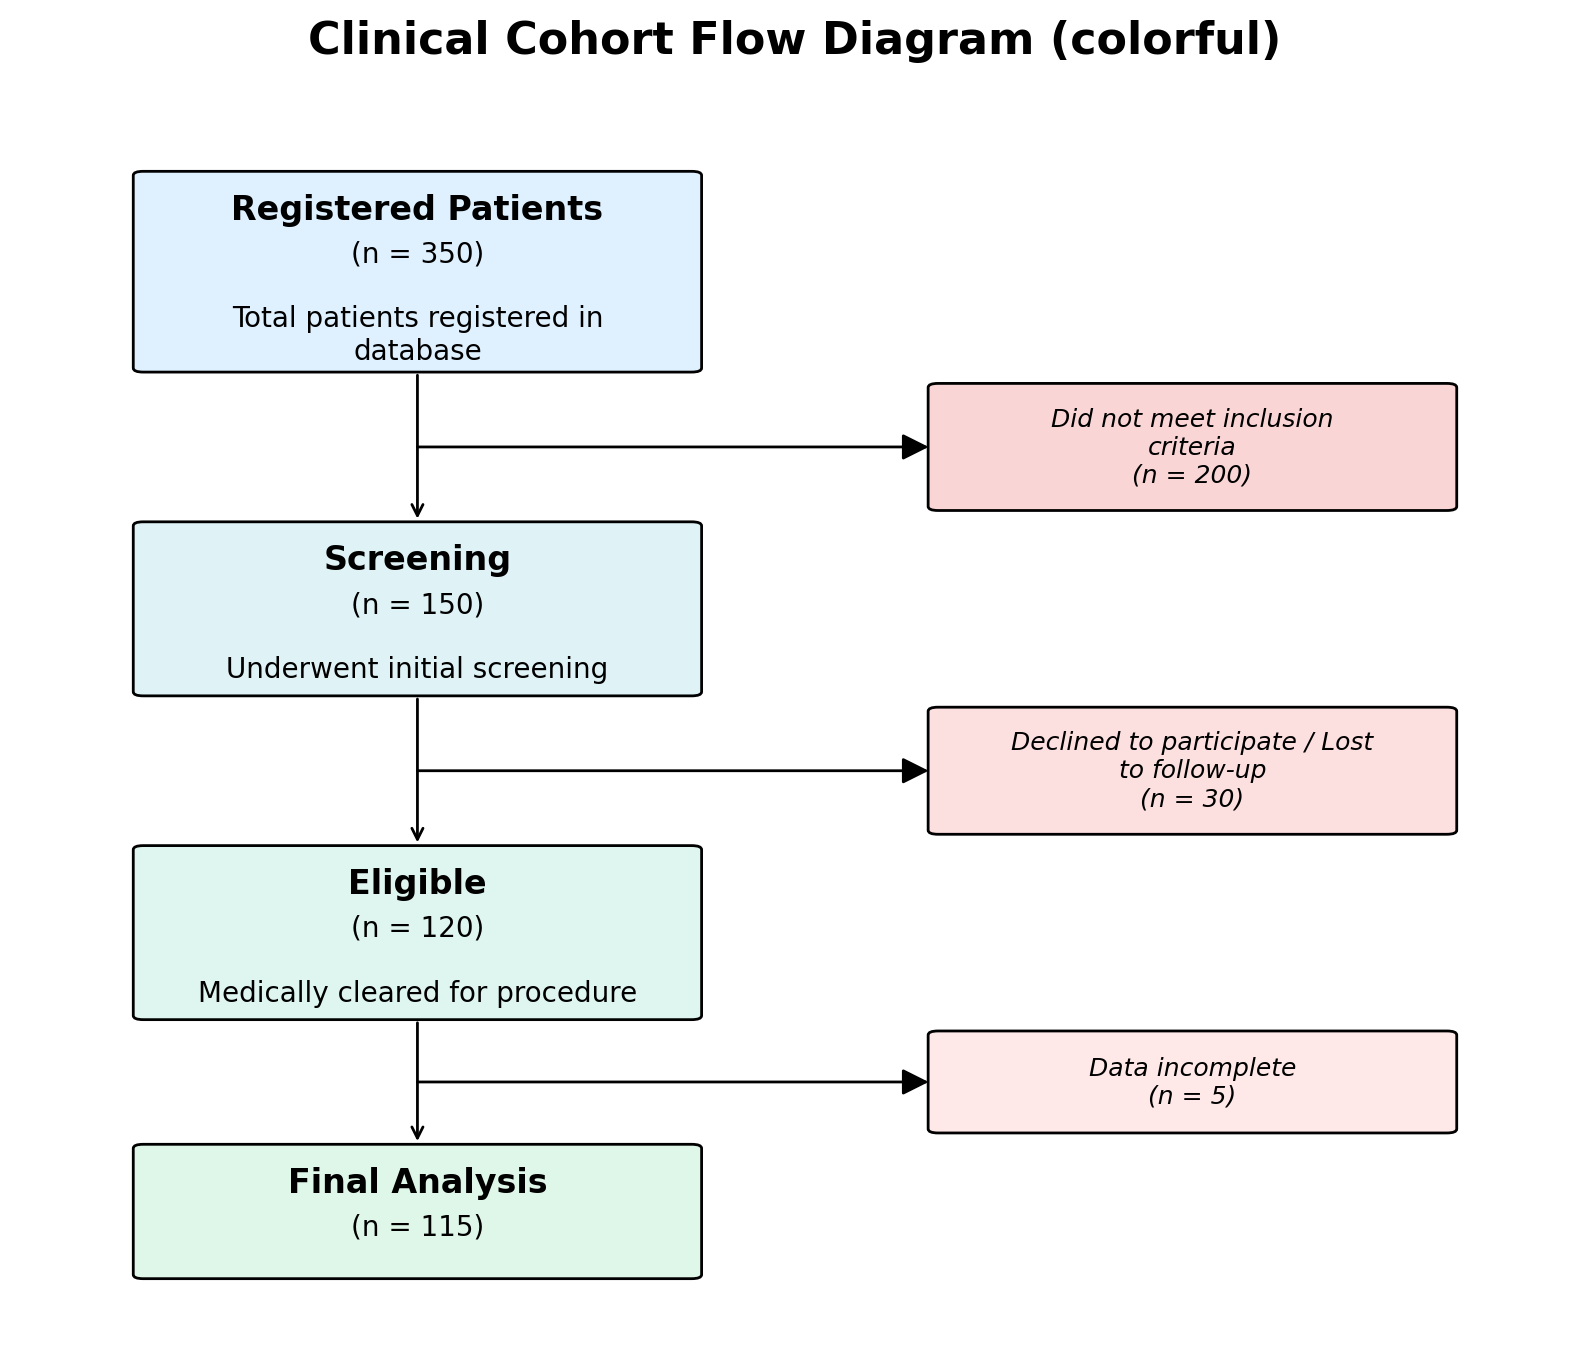
# Pastel gradient backgrounds
fig, ax = plot_cfd(data, style="colorful")
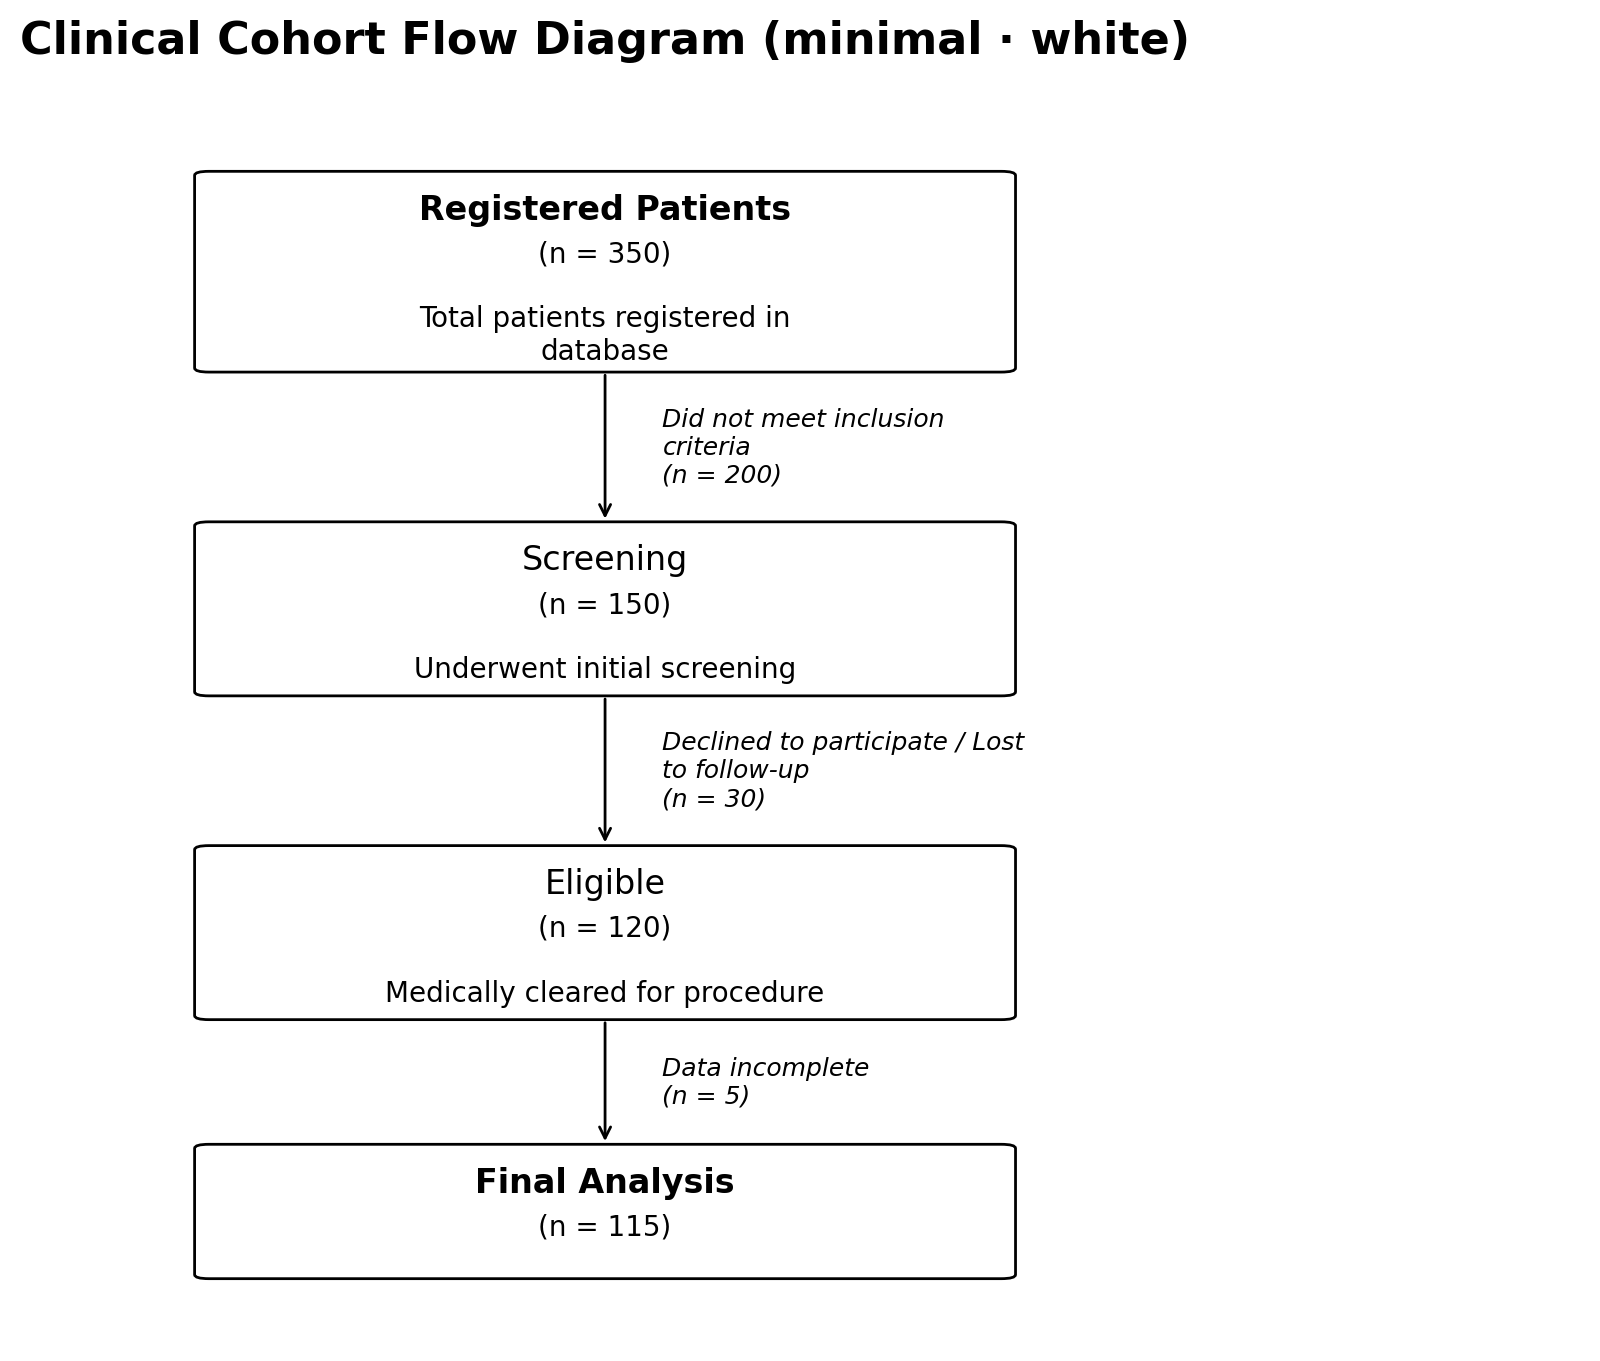
# Notebook-style: white boxes, normal-weight headings, italic side
# text instead of an exclusion box
fig, ax = plot_cfd(data, style="minimal")
# Transparent figure background (for slides / posters)
fig, ax = plot_cfd(data, transparent=True)
Customisation
Create a TOML file with only the values you want to override:
[figure]
dpi = 300

[colors]
main_start = "#cce5ff"
main_end   = "#d4edda"
Then pass it when plotting:
fig, ax = plot_cfd(data, style_config_path="my_style.toml")
See the full documentation for all available options.
Saving Figures
fig, ax = plot_cfd(
    data,
    save_dir="output",
    img_name="flow_chart",
    save_format=["png", "svg", "pdf"],
)
Requirements
- Python >= 3.9
- Matplotlib >= 3.5
License
EUPL-1.2 (European Union Public Licence v1.2) — see LICENSE for the full text.
Roadmap
The list below is auto-generated from docs/roadmap.rst;
edit that file (and run python scripts/sync_roadmap.py) to update it.
- Add: Small Diagram version (delivered as the
minimalstyle in v0.1.3) - Add: Verbose option for communication of saving options (delivered as
verbose=Falsein v0.1.3) - Add: Python-based PRISMA2020 style generation, if necessary
- Add: Diagrams for multiple Arms (e.g. something like CONSORT style)
- Add: Full test coverage — assert per-node
colorandexclusion_coloroverrides actually change renderedfacecolor; assert[exclusion] modecan be overridden via a custom TOML file; cover theverbose=Trueprint path; consider an image-comparison regression test - Consider: switch the
verbose=Trueprint path to standard Pythonloggingso callers can control level, destination and handlers without per-call flags


Download files
Download the file for your platform. If you're not sure which to choose, learn more about installing packages.
Source Distribution
Built Distribution
Filter files by name, interpreter, ABI, and platform.
If you're not sure about the file name format, learn more about wheel file names.
Copy a direct link to the current filters
File details
Details for the file pycohortflow-0.1.3.tar.gz.
File metadata
- Download URL: pycohortflow-0.1.3.tar.gz
- Upload date:
- Size: 41.7 kB
- Tags: Source
- Uploaded using Trusted Publishing? No
- Uploaded via: twine/6.2.0 CPython/3.10.18
File hashes
| Algorithm | Hash digest | |
|---|---|---|
| SHA256 |
03daed343de17b90e160f8e71ba346c0e28afcdea18537dbfd87fefc071c8de9
|
|
| MD5 |
ff455860350f66a882ba3fe78e610ab8
|
|
| BLAKE2b-256 |
db4b831fb17734779d95c0732e3a047d757f97eaeba9ed64782c926038be34f9
|
File details
Details for the file pycohortflow-0.1.3-py3-none-any.whl.
File metadata
- Download URL: pycohortflow-0.1.3-py3-none-any.whl
- Upload date:
- Size: 22.0 kB
- Tags: Python 3
- Uploaded using Trusted Publishing? No
- Uploaded via: twine/6.2.0 CPython/3.10.18
File hashes
| Algorithm | Hash digest | |
|---|---|---|
| SHA256 |
523e05ee3ef3e82c2e183af4407f0d0b7efd5d51a11bf00355743a33b60ca3ae
|
|
| MD5 |
b7c315b5d1b4d8e166be01c488aad584
|
|
| BLAKE2b-256 |
883488b2bca58f573f8c8eb9e45975e4f7b96e49ad12319a6d80e6e4e10e38c1
|


