
pyopenlayersqt
OpenLayers + Qt (QWebEngine) mapping widgets for Python desktop apps.
pyopenlayersqt embeds OpenLayers in a PySide6 QWebEngineView and wraps it with Python classes for desktop geospatial workflows: map layers, feature IDs, selection, styling, tables, filtering, editing, and application actions.
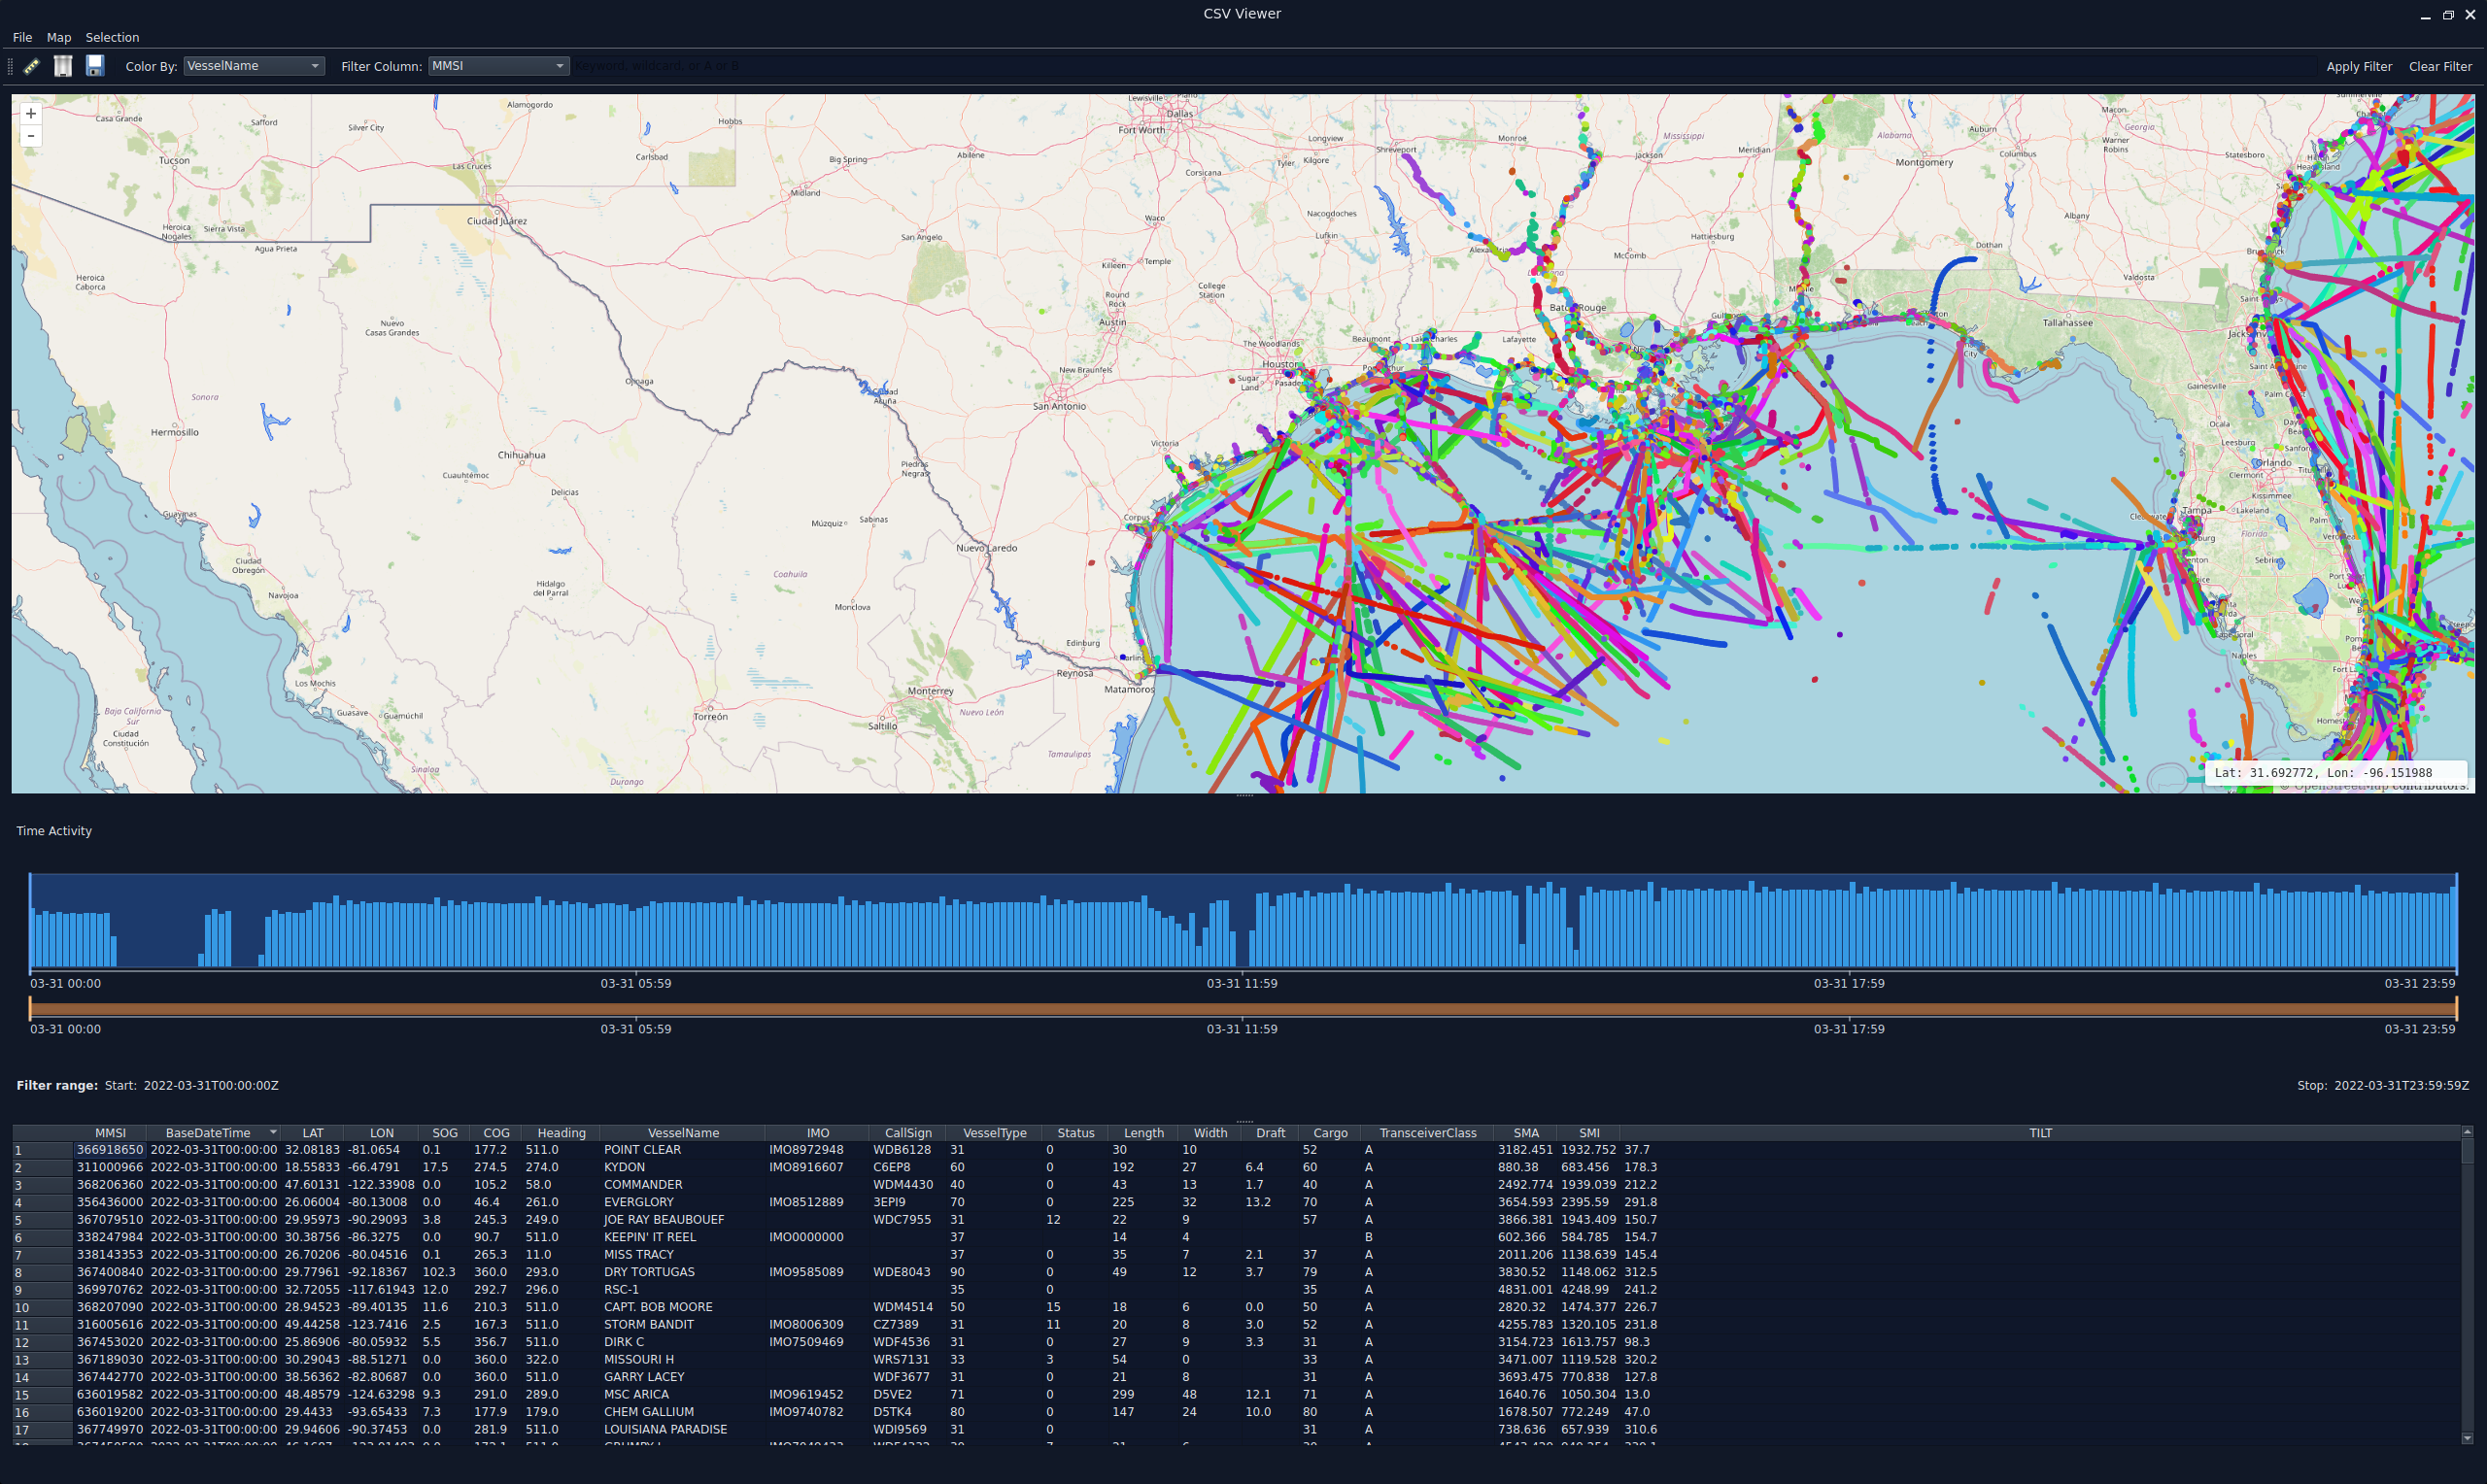
Use it when your Qt app needs more than static plots or a handful of markers: high-volume point rendering, uncertainty ellipses, editable vectors, lazy tables, linked parent/child selections, WMS/tile/raster overlays, time filtering, measurement tools, and a packaged CSV viewer that demonstrates the whole stack.
Contents
- Why pyopenlayersqt
- Install
- Quick Start
- Build a desktop map app
- CSV viewer app
- Examples
- Public API reference
- Performance notes
- Contributing
Why pyopenlayersqt
| Capability | What it gives you |
|---|---|
| 🗺️ OpenLayers in Qt | A browser-grade map engine inside QWebEngineView. |
| ⚡ Large interactive point datasets | Fast canvas layers, spatial indexing, binary/base64 payload transfer, index/range visibility APIs, and per-point recoloring. |
| 📍 Geospatial uncertainty | FastGeoPointsLayer renders points plus semi-major/semi-minor/tilted uncertainty ellipses with independent selected-ellipse visibility. |
| 🎨 Rich vector overlays | Points, image icons, lines, gradient tracks, polygons, circles, ellipses, movement controls, and vertex editing. |
| 📊 Map + table applications | FeatureTableWidget, virtual row providers, context menus, map/table selection sync, and parent/child linking helpers. |
| 🎚️ Filtering and exploration | Range sliders, time histogram filtering, WMS/tile/raster overlays, right-click map menus, measurement mode, and extent watching. |
| 🧭 Ready-to-run CSV viewer | csv_plotter loads large CSV files into fast map layers with lazy tables, filters, color-by workflows, optional WMS, and perf logging. |
Compared with a basic Qt graphics view or static plotting widget, pyopenlayersqt gives you web-map interaction, tiled basemaps, OpenLayers rendering primitives, and Python-side application state in one package. Compared with hand-rolling a web app inside QWebEngine, it gives you the bridge, layer wrappers, table widgets, filtering widgets, examples, and CSV integration patterns up front.
Common applications this is built for:
| Application shape | Useful pieces |
|---|---|
| 🧪 Investigation or operations dashboards | Fast layers, linked tables, WMS overlays, right-click menus, measurement, filtering. |
| 📡 Geolocation/track analysis | Fast geo-points, uncertainty ellipses, gradient tracks, time histogram filtering. |
| 📁 CSV/data-exploration tools | csv_plotter, virtual tables, color-by-column, keyword filters, lazy loading patterns. |
| ✏️ Editing and review tools | Movable vector features, vertex editing, icon markers, selection events, table context menus. |
| 🛰️ Scientific or generated overlays | Raster image overlays, delayed rendering patterns, fit-to-data, extent watching. |
Install
pip install pyopenlayersqt
Requirements: Python 3.8+, PySide6 6.5+, NumPy, Pillow, and Matplotlib.
Quick Start
import sys
from PySide6 import QtWidgets
from PySide6.QtGui import QColor
from pyopenlayersqt import OLMapWidget, PointStyle

app = QtWidgets.QApplication(sys.argv)

map_widget = OLMapWidget(center=(37.0, -120.0), zoom=6)
layer = map_widget.add_vector_layer("cities", selectable=True)

layer.add_points(
    coords=[(37.7749, -122.4194), (34.0522, -118.2437)],
    ids=["sf", "la"],
    style=PointStyle(radius=8, fill_color=QColor("tomato")),
)

map_widget.fit_to_data()
map_widget.show()
sys.exit(app.exec())
Run a working version from the repository:
python examples/01_basic_map_with_markers.py
Build a desktop map app
1. Map widget
OLMapWidget is a QWebEngineView that owns the OpenLayers map, base layers, Python↔JavaScript bridge, selection state, and view controls.
from PySide6.QtGui import QColor
from pyopenlayersqt import OLMapWidget

map_widget = OLMapWidget(
    center=(40.0, -100.0),
    zoom=4,
    show_coordinates=True,
    show_osm_layer=True,
    show_country_boundaries=False,
)

map_widget.set_view(center=(39.7392, -104.9903), zoom=10)
map_widget.set_base_opacity(0.7)
map_widget.set_map_background_color(QColor("aliceblue"))
Map widget capability table:
| Area | API | Typical use |
|---|---|---|
| Initial view | center, zoom constructor args |
Open the app on the region users care about. |
| Runtime view | set_center, set_zoom, set_view |
Drive the map from buttons, searches, or table actions. |
| Fit/zoom | fit_to_data, fit_bounds, auto_zoom_to_points |
Zoom after loading or filtering data. |
| Base map | set_base_visible, set_base_opacity, set_map_background_color |
Control visual context behind overlays. |
| Extent tracking | get_view_extent, watch_view_extent |
Load or summarize data for the visible map area. |
| Measurement | set_measure_mode, on_measurement_updated, clear_measurements |
Let users measure distances interactively. |
| Events | selectionChanged, mapClicked, viewExtentChanged, jsEvent, vectorFeatureChanged |
Keep the rest of the Qt application synchronized with the map. |
2. Pick the right layer
| Use case | Layer | Why |
|---|---|---|
| Normal points, icons, lines, polygons, circles, ellipses | VectorLayer from add_vector_layer() |
Full geometry and style control, editable/movable features. |
| Thousands to millions of points | FastPointsLayer from add_fast_points_layer() |
Canvas rendering, spatial indexing, per-point colors, hide/show filtering. |
| Points with uncertainty ellipses | FastGeoPointsLayer from add_fast_geopoints_layer() |
Fast points plus semi-major/semi-minor/tilt uncertainty rendering. |
| External WMS service | WMSLayer from add_wms() |
Standard tiled WMS overlays. |
| Heatmaps or image overlays | RasterLayer from add_raster_layer() |
PNG bytes, file paths, or URLs placed into lat/lon bounds. |
| Extra XYZ/OSM-like tile source | TileLayer from add_tile_layer() |
Custom tile URL templates. |
All layers support set_opacity(opacity), set_visible(visible), and remove(). Raster layers also support named images with set_image(), remove_image(), set_image_opacity(), and clear().
Capability matrix:
| Capability | VectorLayer | FastPointsLayer | FastGeoPointsLayer | WMSLayer | RasterLayer |
|---|---|---|---|---|---|
| Point selection | Yes | Yes | Yes | No | No |
| Per-feature IDs | Yes | Yes | Yes | No | No |
| Per-feature recoloring | Yes | Yes | Yes | No | No |
| Hide/show individual features | No | Yes | Yes | No | No |
| Lines and polygons | Yes | No | No | No | No |
| Circles and ellipses | Yes | No | Uncertainty ellipses | No | No |
| Movable/editable features | Yes | No | No | No | No |
| Best for very large point sets | No | Yes | Yes | No | No |
| External imagery/services | No | No | No | WMS | Image overlay |
3. Add data and styles
Use (latitude, longitude) coordinates everywhere. Use stable string IDs if features need selection, recoloring, deletion, table rows, or filtering.
Vector features
from pathlib import Path
from PySide6.QtGui import QColor
from pyopenlayersqt import PointStyle, PolygonStyle, CircleStyle, EllipseStyle, VectorVertexEditing

vector = map_widget.add_vector_layer(
    "editable",
    selectable=True,
    movable=True,
    vertex_editing=VectorVertexEditing.MOVE,
)

vector.add_points(
    [(37.77, -122.42), (34.05, -118.24)],
    ids=["sf", "la"],
    style=PointStyle(radius=6, fill_color=QColor("steelblue"), stroke_color=QColor("white")),
)

vector.add_icon_points(
    [(36.17, -115.14)],
    ids=["vegas"],
    icon=Path("examples/assets/orange_pin.svg"),
    selected_icon=Path("examples/assets/selected_pin.svg"),
    anchor=(0.5, 1.0),
)

vector.add_line(
    [(37.77, -122.42), (36.17, -115.14), (34.05, -118.24)],
    feature_id="route",
    style=PolygonStyle(stroke_color=QColor("dodgerblue"), stroke_width=3),
)

vector.add_polygon(
    [(37.8, -122.5), (37.8, -122.3), (37.6, -122.3), (37.6, -122.5)],
    feature_id="area",
    style=PolygonStyle(fill_color=QColor("dodgerblue"), fill_opacity=0.15, stroke_color=QColor("dodgerblue")),
)

vector.add_circle((37.77, -122.42), radius_m=2_000, feature_id="buffer", style=CircleStyle(fill_opacity=0.12))
vector.add_ellipse((37.77, -122.42), sma_m=3_000, smi_m=1_000, tilt_deg=35, feature_id="uncertainty", style=EllipseStyle(stroke_color=QColor("gold")))
Custom icon sources may be local paths, Path objects, bytes-like image data, QByteArray, http(s) URLs, data: URIs, file: URIs, or qrc: URIs. Local files and bytes are served through the widget's embedded HTTP cache.
Fast points
from PySide6.QtGui import QColor
from pyopenlayersqt import FastPointsStyle

fast = map_widget.add_fast_points_layer(
    "measurements",
    selectable=True,
    style=FastPointsStyle(radius=2.5, default_color=QColor("seagreen"), selected_radius=6, selected_color=QColor("yellow")),
    cell_size_m=750,
)

fast.add_points(coords, ids=ids, colors_rgba=optional_colors)
fast.set_colors(["pt-1", "pt-2"], [QColor("red"), QColor("orange")])
fast.hide_features(["pt-3"])
fast.show_all_features()
Fast geo-points with uncertainty
from PySide6.QtGui import QColor
from pyopenlayersqt import FastGeoPointsStyle

geo = map_widget.add_fast_geopoints_layer(
    "geo",
    selectable=True,
    style=FastGeoPointsStyle(
        point_radius=3,
        default_color=QColor("steelblue"),
        selected_color=QColor("white"),
        ellipse_stroke_color=QColor("steelblue"),
        fill_ellipses=False,
        ellipses_visible=True,
    ),
    cell_size_m=750,
)

geo.add_points_with_ellipses(
    coords=coords,
    sma_m=semi_major_m,
    smi_m=semi_minor_m,
    tilt_deg=tilt_degrees,
    ids=ids,
)
geo.set_selected_ellipses_visible(False)
WMS and raster overlays
from pyopenlayersqt import WMSOptions

wms = map_widget.add_wms(
    WMSOptions(
        url="https://ahocevar.com/geoserver/wms",
        params={"LAYERS": "topp:states", "TILED": True, "FORMAT": "image/png", "TRANSPARENT": True},
        opacity=0.85,
    ),
    name="states",
)

raster = map_widget.add_raster_layer(name="heatmap", opacity=0.6)
raster.set_image(
    png_bytes_or_path_or_url,
    bounds=[(lat_min, lon_min), (lat_max, lon_max)],
    name="temperature",
    opacity=0.8,
)
raster.set_image_opacity("temperature", 0.5)
4. Selection
Selection is ID-based and synchronized between OpenLayers and Python. The key contract is: use the same feature ID in the layer, table key, filter model, and application state.
from PySide6.QtGui import QColor
from pyopenlayersqt import PointStyle

current_selection = {}  # layer_id -> list[str]

def on_selection_changed(selection):
    if selection.feature_ids:
        current_selection[selection.layer_id] = list(selection.feature_ids)
    else:
        current_selection.pop(selection.layer_id, None)

map_widget.selectionChanged.connect(on_selection_changed)

# Programmatic selection by layer kind
map_widget.set_vector_selection(vector.id, ["sf"])
map_widget.set_fast_points_selection(fast.id, ["pt-1", "pt-2"])
map_widget.set_fast_geopoints_selection(geo.id, ["geo-1"])
Common selected-feature operations:
vector.update_feature_styles(["sf"], [PointStyle(radius=10, fill_color=QColor("red"))])
fast.set_colors(["pt-1"], [QColor("red")])
geo.set_colors(["geo-1"], [QColor("red")])

vector.remove_features(["sf"])
fast.remove_points(["pt-1"])
geo.remove_ids(["geo-1"])
For right-click app actions, listen to map_widget.jsEvent for "contextmenu"; payloads include map coordinates and the clicked feature/layer when available.
For regular clicks, use mapClicked or on_map_click() instead of injecting JavaScript. The callback can require standard modifiers and arbitrary held keys:
from pyopenlayersqt import MapClickEvent

def add_target(event: MapClickEvent) -> None:
    print(event.lat, event.lon)

# Invoke only while the map has focus and T is held during the click.
map_widget.on_map_click(add_target, keys="t")
# Standard modifiers can be combined with ordinary keys.
map_widget.on_map_click(add_target, modifiers=("ctrl", "shift"), keys="t")
5. Tables
FeatureTableWidget is designed to mirror feature rows and keep table selection in sync with map selection.
from pyopenlayersqt import ColumnSpec, FeatureTableWidget

columns = [
    ColumnSpec("ID", lambda r: r["feature_id"]),
    ColumnSpec("Name", lambda r: r.get("name", "")),
    ColumnSpec("Latitude", lambda r: r.get("lat", ""), fmt=lambda v: f"{float(v):.5f}" if v != "" else ""),
]

table = FeatureTableWidget(
    columns=columns,
    key_fn=lambda r: (r["layer_id"], r["feature_id"]),
    debounce_ms=90,
)

table.append_rows([
    {"layer_id": vector.id, "feature_id": "sf", "name": "San Francisco", "lat": 37.7749},
])

# table -> map
def on_table_selection(keys):
    selected_for_vector = [fid for layer_id, fid in keys if layer_id == vector.id]
    map_widget.set_vector_selection(vector.id, selected_for_vector)

table.selectionKeysChanged.connect(on_table_selection)

# map -> table
def on_map_selection(selection):
    table.select_keys([(selection.layer_id, fid) for fid in selection.feature_ids], clear_first=True)

map_widget.selectionChanged.connect(on_map_selection)
For huge tables, set a TableRowProvider instead of appending row dictionaries. The provider lazily implements row_count(), data(...), key(source_row), row_for_key(key), and row_data(source_row).
For parent/child workflows, use TableLink with MultiSelectLink: one parent table/layer fans out to one or more child tables/layers using dictionaries of child_feature_id -> parent_feature_id. Metadata-only child tables are supported with key_layer_id.
Table/application capability table:
| Need | API | Notes |
|---|---|---|
| Stable table/map identity | key_fn, feature ids |
Use the same (layer_id, feature_id) contract everywhere. |
| Large tables | TableRowProvider, set_row_provider() |
Avoid materializing one Python dict per row. |
| Map-to-table selection | selectionChanged, select_keys() |
Select rows from map events. |
| Table-to-map selection | selectionKeysChanged, set_*_selection() |
Select map features from table rows. |
| Context actions | ContextMenuActionSpec, contextMenuRequested |
Add delete, inspect, export, or app-specific actions. |
| Parent/child data | TableLink, MultiSelectLink |
Fan a parent selection out to one or many child tables/layers. |
| Filtered views | hide_rows_by_keys, show_rows_by_keys, set_visible_row_indices |
Keep table visibility aligned with map feature visibility. |
6. Filtering
Filtering is usually a combination of map hide/show and table visible-row updates.
from pyopenlayersqt import RangeSliderWidget

slider = RangeSliderWidget(min_val=0.0, max_val=100.0, step=1.0, label="Value")

def apply_filter(min_val, max_val):
    visible = [row["feature_id"] for row in rows if min_val <= row["value"] <= max_val]
    hidden = [row["feature_id"] for row in rows if not (min_val <= row["value"] <= max_val)]

    fast.hide_features(hidden)
    fast.show_features(visible)
    table.hide_rows_by_keys([(fast.id, fid) for fid in hidden])
    table.show_rows_by_keys([(fast.id, fid) for fid in visible])

slider.rangeChanged.connect(apply_filter)
Use RangeSliderWidget(is_iso8601=True) for timestamp ranges and TimeHistogramSliderWidget when a histogram overview helps users understand dense time data.
CSV viewer app
The package includes a runnable CSV map viewer app through the csv_plotter console script:
csv_plotter --csv path/to/data.csv
The app is useful for exploring large latitude/longitude CSV files without writing code. It uses OLMapWidget, fast point/geo-point layers, FeatureTableWidget, and TimeHistogramSliderWidget to provide:
- manual column selection for latitude, longitude, optional time, and optional uncertainty fields;
- streaming-oriented loading for large CSV files;
- selectable map points synchronized with a lazy table;
- color-by-column workflows for categorical and numeric data;
- text/wildcard filtering and time filtering;
- optional WMS/base-layer controls;
- performance log lines when
PYOPENLAYERSQT_PERF=1is set.
If you are building your own CSV-style desktop viewer, treat the app as an integration reference for large data loading, compact indexes, map/table selection, and filter-driven hide/show behavior.
Examples
Start with the examples that match the application you are building. The examples are intentionally workflow-oriented rather than toy-only snippets.
| Workflow | Example | What it demonstrates |
|---|---|---|
| Basic embedded map | examples/01_basic_map_with_markers.py |
Minimal OLMapWidget, vector layer, QColor marker styles. |
| Full vector styling | examples/02_layer_types_and_styling.py |
Points, icons, polygons, circles, ellipses, icon source formats. |
| Large point rendering | examples/03_fast_points_performance.py |
Fast point rendering and selection for high-volume datasets. |
| WMS/base layers | examples/04_wms_and_base_layers.py |
WMS overlays, base-map opacity/visibility controls. |
| Raster overlays | examples/05_raster_overlay.py |
In-memory PNG/heatmap overlays pinned to geographic bounds. |
| Geo uncertainty | examples/06_geo_uncertainty_ellipses.py |
Fast geo-points with uncertainty ellipses. |
| Selection | examples/07_feature_selection.py |
Map-driven selection events across layers. |
| Map/table CRUD | examples/08_table_integration.py |
Bidirectional map/table sync, add/delete/update workflows. |
| Recoloring selected data | examples/09_selection_and_recoloring.py |
Updating vector and fast-layer colors from selection state. |
| Numeric filtering | examples/10_range_slider_filtering.py |
Slider-driven map and table filtering. |
| Measurement | examples/11_measurement_tool.py |
Interactive geodesic distance measurement. |
| Coordinate display | examples/12_coordinate_display.py |
Mouse coordinate UI toggles. |
| Parent/child linking | examples/13_dual_table_linking.py |
Linked map/table selections across related datasets. |
| Interruptible rendering | examples/14_delayed_render_interrupt.py |
Debounced, process-based heatmap rendering. |
| Load then fit | examples/15_load_data_and_zoom.py |
Data loading followed by fit_to_data(). |
| Metadata-only children | examples/16_metadata_only_table_linking.py |
100k fast geo parents linked to child metadata rows with no child map layer. |
| Right-click actions | examples/17_map_right_click_context_menu.py |
Custom Qt context menus from map coordinates and clicked features. |
| Gradient tracks | examples/18_gradient_track_speed.py |
Colormap and explicit-color gradient polylines for track metrics. |
| Virtual tables | examples/19_virtual_feature_table.py |
Lazy TableRowProvider over 250k logical rows. |
| Time filtering | examples/20_time_histogram_slider.py |
Histogram-backed time-range filtering. |
| Editable vectors | examples/21_movable_vector_features.py |
Movable and vertex-editable points, icons, lines, polygons, circles, ellipses, and gradient lines. |
| Modified clicks | examples/22_modified_map_clicks.py |
Typed click events plus Ctrl/Shift/Alt/Meta and ordinary held-key callbacks without custom JavaScript. |
Public API reference
Top-level imports
from pyopenlayersqt import (
    OLMapWidget,
    # styles/options/models
    PointStyle, IconStyle, PolygonStyle, CircleStyle, EllipseStyle,
    FastPointsStyle, FastGeoPointsStyle, WMSOptions, TileLayerOptions,
    FeatureSelection, MeasurementUpdate, VectorVertexEditing, LatLon,
    # layers
    FastPointsLayer, FastGeoPointsLayer,
    # reusable widgets and linking helpers
    ColumnSpec, ContextMenuActionSpec, FeatureTableWidget, TableContextMenuEvent,
    TableRowProvider, RangeSliderWidget, TimeHistogramSliderWidget,
    TableLink, DualSelectLink, MultiSelectLink,
)
OLMapWidget
Constructor highlights: center=(lat, lon), zoom=2, show_coordinates=True, show_country_boundaries=False, country_boundaries_stroke_color=None, show_osm_layer=True, osm_url=None, and map_background_color (defaults to white).
Layer factory methods:
Fast layers default to selectable=False; pass selectable=True when map clicks or map/table selection sync should include those layers.
add_vector_layer(name, selectable=True, movable=False, vertex_editing=VectorVertexEditing.MOVE)add_fast_points_layer(name, selectable=False, style=None, cell_size_m=1000.0)add_fast_geopoints_layer(name, selectable=False, style=None, cell_size_m=1000.0, show_ellipses=True)add_wms(options, name="wms")add_tile_layer(options, name="tile")add_raster_layer(name="raster", opacity=0.6)(thenset_image(image, bounds, name="image"))
Important methods: set_base_opacity, set_base_visible, set_map_background_color, set_country_boundaries_visible, set_view, set_center, set_zoom, fit_bounds, auto_zoom_to_points, fit_to_data, zoom_resolution_m_per_px, get_view_extent, watch_view_extent, set_measure_mode, on_measurement_updated, on_map_click, clear_measurements, send.
Signals: ready, selectionChanged, mapClicked, viewExtentChanged, measurementUpdated, vectorFeatureChanged, jsEvent.
Layer APIs
| Layer | Add/update methods | Remove/filter methods |
|---|---|---|
VectorLayer |
add_points, add_icon_points, add_line, add_gradient_line, add_polygon, add_circle, add_ellipse, update_feature_styles, set_movable, set_vertex_editing, set_features_movable, set_features_vertex_editing |
remove_features, clear, set_visible, set_selectable, remove |
FastPointsLayer |
add_points, set_colors |
remove_points, hide_features, show_features, show_all_features, clear, set_visible, set_selectable, remove |
FastGeoPointsLayer |
add_points_with_ellipses, set_colors, set_ellipses_visible, set_selected_ellipses_visible |
remove_ids, hide_features, show_features, show_all_features, clear, set_visible, set_selectable, remove |
WMSLayer |
set_params, set_opacity, set_visible |
remove |
RasterLayer |
set_image, set_image_opacity, set_opacity, set_visible |
remove_image, clear, remove |
Style primitives
| Style | Use with | Key fields |
|---|---|---|
PointStyle |
VectorLayer.add_points |
radius, fill_color, fill_opacity, stroke_color, stroke_width, stroke_opacity |
IconStyle |
VectorLayer.add_icon_points |
icon_src, selected_icon_src, scale, opacity, anchor, anchor_x_units, anchor_y_units, rotation_deg, rotate_with_view, cross_origin |
PolygonStyle |
polygons, lines, gradient lines | stroke_color, stroke_width, stroke_opacity, fill_color, fill_opacity |
CircleStyle |
circles | stroke_color, stroke_width, fill_color, fill_opacity |
EllipseStyle |
ellipses | stroke_color, stroke_width, fill_color, fill_opacity |
FastPointsStyle |
fast point layers | radius, default_color, selected_radius, selected_color |
FastGeoPointsStyle |
fast geo-point layers | point colors/radii plus ellipse stroke/fill, visibility, culling, batching controls |
Color fields accept QColor and CSS color names. Hex strings, CSS color strings, and legacy RGBA tuples remain supported for compatibility, but QColor is preferred in examples and application code.
Table, linking, and filter widgets
FeatureTableWidget(columns, key_fn=None, debounce_ms=...): append/remove/select rows by stable keys.ColumnSpec(name, getter, fmt=None): declares display columns.ContextMenuActionSpec(label, callback): adds table context-menu actions.TableRowProvider: lazy/virtual table protocol for very large data.TableLink,DualSelectLink,MultiSelectLink: map/table selection linking helpers.RangeSliderWidget: dual-handle numeric or ISO8601 range filtering.TimeHistogramSliderWidget: time filtering with histogram context.
Performance notes
- Use
FastPointsLayerorFastGeoPointsLayerfor large point datasets. - Tune
cell_size_mto match density: larger cells are faster, smaller cells select more precisely. - Prefer stable compact IDs; reuse them across map, table, and filters.
- Use virtual table providers for large datasets instead of materializing every row as a dictionary.
- Use
hide_features()/show_features()for interactive filtering instead of removing and re-adding data. - Debounce extent-driven loading with
watch_view_extent(..., debounce_ms=...). - For uncertainty ellipses, use
min_ellipse_pxandmax_ellipses_per_pathto avoid drawing invisible or overly fragmented geometry.
Architecture
- Python sends commands to JavaScript through the widget bridge.
- JavaScript sends events back through Qt Web Channel.
- Static OpenLayers assets are packaged with the wheel.
- Local icons and raster overlays are served from embedded/cache-backed HTTP endpoints so they work inside
QWebEngine.
License
MIT License
Contributing
Contributions are welcome. For release and publishing notes, see CONTRIBUTING.md.
Credits
Built with OpenLayers, PySide6, NumPy, Pillow, and Matplotlib.
1 maintainer

Metadata
1 maintainer
Release files for pyopenlayersqt 0.21.0
For a detailed explanation of source distributions (sdists) and built distributions (wheels), please see the package formats documentation.
Source distribution (sdist)
| File | Size | Uploaded | |
|---|---|---|---|
| pyopenlayersqt-0.21.0.tar.gz | 6.5 MB | Details |
Built distribution (wheel)
| File | Interpreter | ABI | Platform | Reset |
|---|---|---|---|---|
| pyopenlayersqt-0.21.0-py3-none-any.whl | Python 3 | none | any | Details |
Total release size: 13.1 MB
Release files / pyopenlayersqt-0.21.0.tar.gz
| Download URL | pyopenlayersqt-0.21.0.tar.gz |
|---|---|
| Size | 6.5 MB |
| Tags | Source |
|
SHA-256 checksum How to use checksums |
03085fbf209de9914d70c9f8081ca8177fb81bcf0a16a7a9e6451746cc9a80da
|
|
BLAKE2b-256 checksum How to use checksums |
c26c8831cbfbb548ce45e42e9279a1deeb9abc37c975c41161a35e0942065183
|
| Upload date | |
|
Uploaded using Trusted Publishing? What is trusted publishing? |
Yes |
| Uploaded via |
twine/7.0.0 CPython/3.13.14
|
Provenance
Provenance describes where a file came from. On PyPI, provenance is shared via attestations, which provide a verifiable record of the build or publishing details. View details, limitations and caveats.


PyPI Publish Attestation
PyPI verified that this artifact, at this checksum, originated from the publisher listed below.
Signed by GitHub Actions, verified by PyPI on Oct 13, 2026.
Transparency logRelease files / pyopenlayersqt-0.21.0-py3-none-any.whl
| Download URL | pyopenlayersqt-0.21.0-py3-none-any.whl |
|---|---|
| Size | 6.5 MB |
| Tags | Python 3 |
|
SHA-256 checksum How to use checksums |
e93c53cf9f80f3685dec676b42469203b85fa56e99b5c21379a72297f5403780
|
|
BLAKE2b-256 checksum How to use checksums |
727f23d9d27e5484b86e274b812cfd16d1b9034071a64c00e2a76759fcc77ece
|
| Upload date | |
|
Uploaded using Trusted Publishing? What is trusted publishing? |
Yes |
| Uploaded via |
twine/7.0.0 CPython/3.13.14
|
Provenance
Provenance describes where a file came from. On PyPI, provenance is shared via attestations, which provide a verifiable record of the build or publishing details. View details, limitations and caveats.
PyPI Publish Attestation
PyPI verified that this artifact, at this checksum, originated from the publisher listed below.
Signed by GitHub Actions, verified by PyPI on Oct 13, 2026.
Transparency log













