




Generates a light-weight static html report based on pytest framework

Features
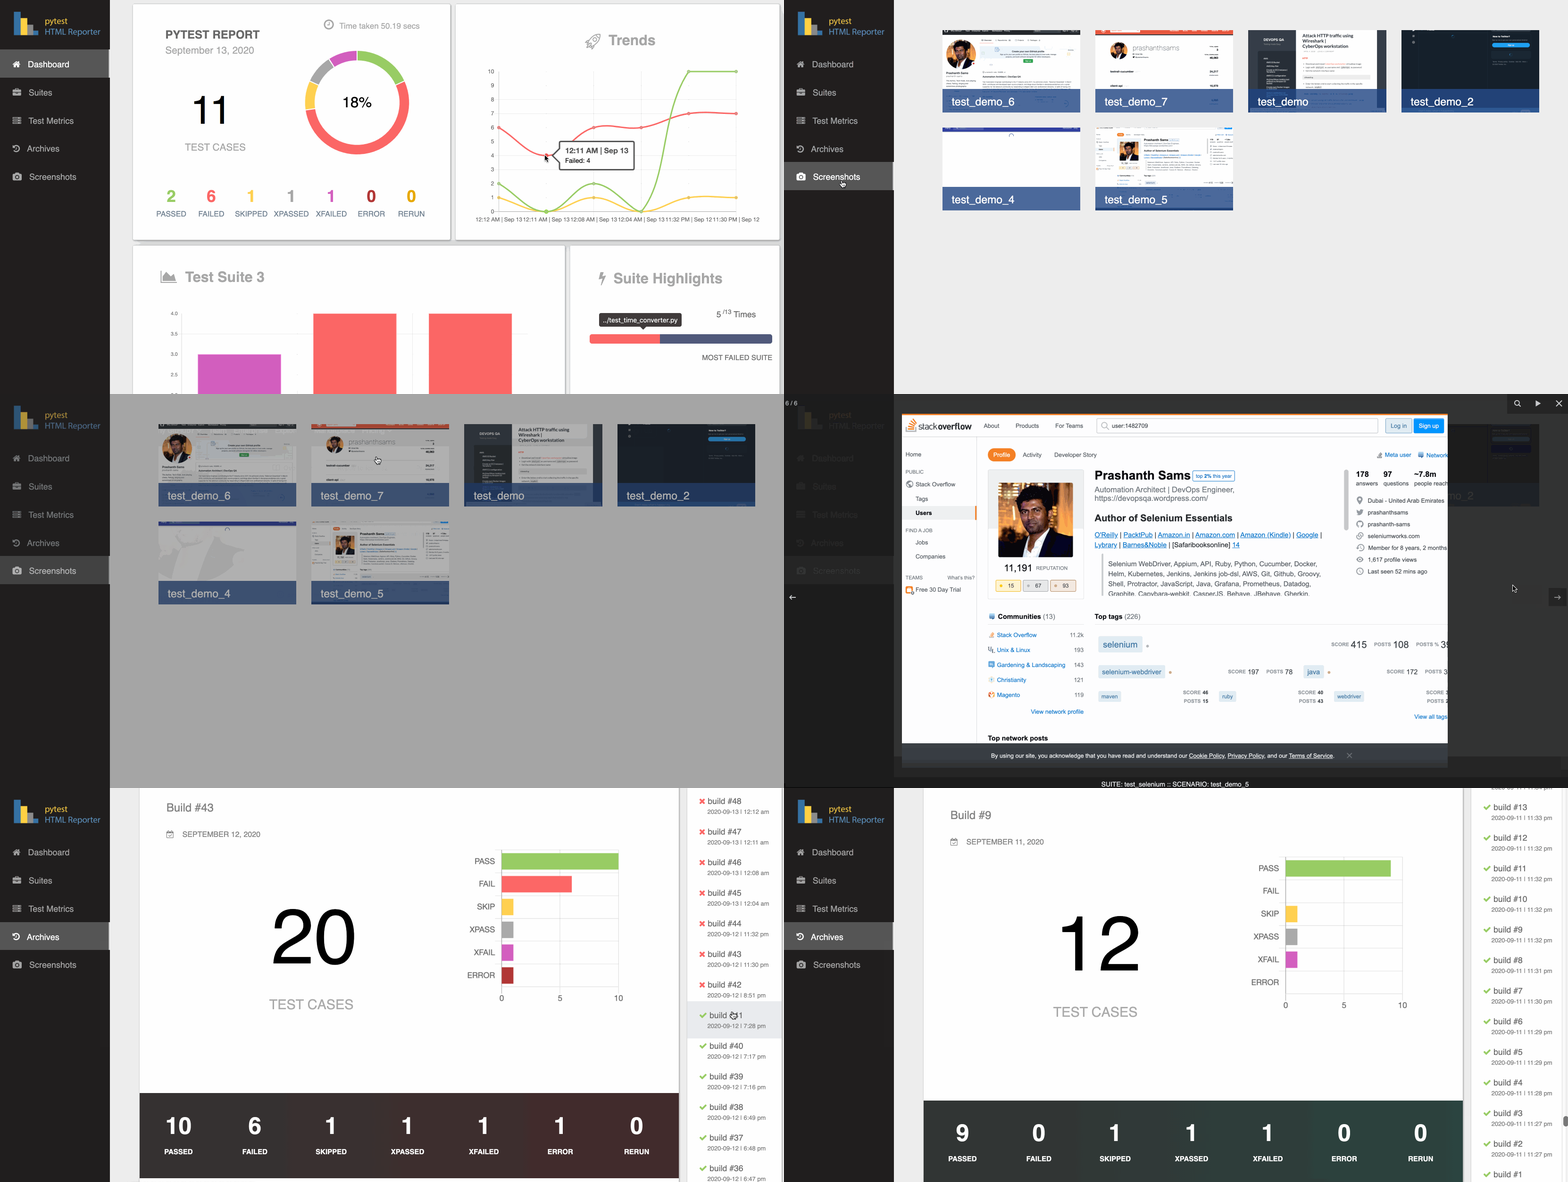
Generic information
Overview
Environment
Trends
Suite Highlights
Test suite details
Archives / History
Screenshots - works with Selenium, Playwright, or anything else that can produce a PNG
Attachments - Logs API events/calls, JSON and free text kept against the test that produced them
Captured logs per test (stdout, stderr and logging)
Test Coverage - the percentage, the split by file and the trend across builds, read from whatever measured it
Custom side-nav links to any page of your own
Test Rerun support
Parallel run support (pytest-xdist)
Installation
$ pip3 install pytest-html-reporterUsage
By default, the filename used is pytest_html_reporter.html and path chosen is report; you can skip both or either one of them if not needed:
$ pytest tests/
Custom path, filename, and title
Add --html-report tag followed by path location and filename to customize the report location and filename:
$ pytest tests/ --html-report=./report
$ pytest tests/ --html-report=./report/report.html
The path is run through strftime, so date and time placeholders (%Y, %m, %d, %H, %M, …) give each run a folder or a filename of its own:
$ pytest tests/ --html-report=./reports/%Y%m%d/report_%H%M.html
They are expanded once, when the run starts, so a parallel run and a run that crosses a minute boundary still write a single report. Write %% for a literal percent sign in front of a letter; a % that is not a placeholder, as in 100% pass, is left as it is.
Add --title tag followed by the report title; it is capped at 20 characters and the cut tail fades out, with the full title kept as the heading’s tooltip:
$ pytest tests/ --html-report=./report --title='PYTEST REPORT'
Add --archive-count tag followed by an integer to limit showing the number of builds in the Archives section:
$ pytest tests/ --archive-count 7
$ pytest tests/ --html-report=./report --archive-count 7
A run on a schedule usually wants a stretch of time rather than a build count. --archive-days keeps only the builds from the last N days and deletes the rest, and needs no retuning when the schedule changes:
$ pytest tests/ --archive-days 30
$ pytest tests/ --archive-days 0.5
--archive-since takes a date instead - or a date and a time - for a one-off cut; everything older than it goes:
$ pytest tests/ --archive-since 2026-06-01
$ pytest tests/ --archive-since '2026-06-01 09:00'
The three limits intersect: a build has to satisfy every one you set to be kept. Set none of them and every build is kept for ever, which is what eventually makes a report slow to open - a retained build costs roughly 5KB of the page, so an hourly run reaches a multi-megabyte report inside a couple of months.
A build is dated by the moment its run started, which is kept in the name of its archive file, so an age limit still measures the right thing after the reports have been copied into a fresh CI workspace.
Environment and build details
Add --environment tag followed by the environment under test; it shows as a badge beside the report title. The badge is capped at 10 characters and the cut tail fades out, with the full name kept in the Environment panel and in the badge’s tooltip:
$ pytest tests/ --environment=staging
Add --build-info tag followed by key=value to add any other detail to the Environment panel; repeat it as often as you like:
$ pytest tests/ --environment=prod --build-info branch=main --build-info sha=$GITHUB_SHA
Captured logs
Everything pytest captures while a test runs - stdout, stderr and logging output, from setup, call and teardown alike - is kept against that test. The Test Metrics table gains a Logs column showing how many lines a test produced; clicking it opens the output, section by section, with a Copy button. Tests that produced nothing show a dash.
This is on by default. No flag is needed - the command you already run is enough:
$ pytest tests/ --html-report=./report
Three things a test writes end up in that column, and two things that look like they should do not:
What the test does |
Where it shows up |
|---|---|
print(...) |
Captured stdout section |
sys.stderr.write(...) |
Captured stderr section |
log.info(...), log.warning(...) |
Captured log section, subject to --log-level below |
an assertion failure or traceback |
not here - the Error Message column already has it |
warnings.warn(...) |
not here - pytest keeps its own warnings summary |
So a test that only asserts has nothing to show and correctly gets a dash, even when it fails. If you are seeing stdout sections and nothing else, it is because nothing in the suite is calling a logger - not because logging is being dropped.
--report-logs narrows what is kept, which is worth doing when a large suite would otherwise make the report file big:
--report-logs |
What is kept |
|---|---|
all (default) |
Every test’s captured output |
failed |
Only tests that failed or errored; everything else shows a dash |
none |
Nothing - no Logs column content and no size cost at all |
$ pytest tests/ --report-logs=failed
$ pytest tests/ --report-logs=none
$ pytest tests/ --report-logs=all # default
--report-log-limit caps how much of one test’s output is kept, so a single chatty test cannot outweigh the rest of the report. What survives is the end of the output - the lines next to the failure - cut back to a whole line, with a note saying how much was dropped:
--report-log-limit |
What it means |
|---|---|
10000 (default) |
Characters per test |
any positive integer |
Characters per test |
0 |
No limit; keep everything the test produced |
$ pytest tests/ --report-log-limit=50000
$ pytest tests/ --report-log-limit=0
what pytest itself has to be capturing
The reporter can only keep what pytest hands it, and two of pytest’s own options decide that. Neither needs setting for the defaults to work - but if the Logs column is emptier than expected, one of these is why.
Capture. -s (short for --capture=no) sends stdout and stderr straight to the terminal, so pytest never takes them in and no reporter can show them. logging output is unaffected and still appears:
--capture |
Effect on the Logs column |
|---|---|
fd (default) |
Everything, including output written by subprocesses and C extensions |
sys |
Everything Python itself writes; a subprocess’s output is not captured |
tee-sys |
As sys, and it still prints live to the terminal |
no (same as -s) |
logging only - stdout and stderr are gone |
Log level. logging output is captured from WARNING up unless told otherwise, so log.info(...) and log.debug(...) calls will not be in the report until the level is lowered:
--log-level |
Logging captured |
|---|---|
unset (default) |
Whatever the root logger emits - WARNING and above |
DEBUG |
Everything |
INFO |
INFO and above |
WARNING |
WARNING and above |
ERROR / CRITICAL |
Only the levels named and above |
$ pytest tests/ --log-level=INFO
Already running with -s? Just remove it. Capture is on by default, so nothing needs to be added in its place:
[pytest]
addopts = -v
The one thing -s gave you that plain capture does not is seeing output in the terminal while the tests run - with capture on, pytest only replays it afterwards, for the tests that failed. If you want both, --capture=tee-sys streams it live and keeps it for the report:
[pytest]
addopts = -v --capture=tee-sys
(Stay on -s if you drop into pdb. And note tee-sys only tees Python’s own sys.stdout / sys.stderr, so if the output you want comes from a subprocess or a C extension, plain fd capture is the one that keeps it.)
the Logs column is empty
Work down this list; the first one that applies is the answer:
Is the run using -s or --capture=no? Check addopts in pytest.ini / pyproject.toml / tox.ini, not just the command you typed - a flag set there applies to every run. This is the most common cause, and the report says so above the Test Metrics table when it is happening. Removing the flag is the whole fix; there is no replacement flag to add.
Are you on --report-logs=failed while the tests that produce output are passing? That mode keeps output for failed and errored tests only; a passing test shows a dash however much it printed.
Is the output logging below WARNING? log.info(...) and log.debug(...) are not recorded until you pass --log-level=INFO or --log-level=DEBUG.
Do the tests actually produce any output? A suite of plain assertions prints nothing, and a dash is then the correct answer - a failed test included, since its message is in the Error Message column, not here. Add a print(...) to one test and re-run to confirm the column is working.
The Environment panel states what the run kept and from which log level - e.g. all tests: stdout, stderr and logging, logging from WARNING - so you can always tell which of these you are in.
pytest.ini
Alternate option is to add this snippet in the pytest.ini file:
[pytest]
addopts = -v -rf --capture=tee-sys --title='PYTEST REPORT'
html_report = ./reports/%Y%m%d/report_%H%M.html
archive_count = 7
archive_days = 30
environment = staging
build_info =
    branch=main
    team=payments
    commit=$GITHUB_SHA
    ci=$GITHUB_RUN_ID
report_logs = all
report_log_limit = 10000
report_attachments = all
report_attachment_limit = 20000
report_coverage = auto
report_coverage_limit = 500
report_link =
    Coverage=htmlcov/index.html
    CI job=https://ci.example.com/job/42
report_logs takes the same values as --report-logs (all / failed / none) and report_log_limit the same as --report-log-limit (a character count, or 0 for no limit). report_attachments and report_attachment_limit mirror --report-attachments and --report-attachment-limit the same way, as do report_coverage, report_coverage_file and report_coverage_limit.
report_link takes one Label=URL per line and, like build_info, adds to whatever --report-link passes rather than being replaced by it.
html_report takes the same value as --html-report, placeholders included, and is the way to set the report location without going through addopts.
archive_count, archive_days and archive_since mirror --archive-count, --archive-days and --archive-since. Retention is a property of the job rather than of one run, so the ini file is usually the better place for it: set it once and every invocation, however it is started, keeps the same window.
Note: --html-report overrides the html_report ini value; --environment overrides the environment ini value; --build-info entries are added to the ones set in the ini file rather than replacing them; --report-link entries are added to the ones set in the ini file the same way; --archive-count, --archive-days, --archive-since, --report-logs, --report-log-limit, --report-attachments, --report-attachment-limit, --report-coverage, --report-coverage-file and --report-coverage-limit override their ini values
Note: If you fail to provide --html-report tag, it consider your project’s home directory as the base
screenshots
Import attach from the library and hand it the PNG bytes of a screenshot. It takes the image itself rather than a browser, so it works with Selenium, Playwright, or anything else that can produce a PNG:
from pytest_html_reporter import attach

attach(data=self.driver.get_screenshot_as_png())   # Selenium
attach(data=page.screenshot())                     # Playwright
attach(data=await page.screenshot())               # Playwright, async API
Note: every image you attach is kept, whatever the test did - a screenshot of a pass is a baseline worth having. Only the tests that actually called attach appear in the gallery, so capturing on failure alone is a matter of deciding when to call it.
attach can be called from anywhere in the test’s lifecycle: the test body, a unittest tearDown, a pytest fixture’s teardown, or a pytest_runtest_makereport hook. Capturing on failure only - the usual want - is the rep_call.failed test in the fixture below; drop it to photograph every test:
# conftest.py
import pytest
from pytest_html_reporter import attach

@pytest.fixture(autouse=True)
def screenshot_on_failure(page, request):
    yield
    if request.node.rep_call.failed:
        attach(data=page.screenshot())

@pytest.hookimpl(tryfirst=True, hookwrapper=True)
def pytest_runtest_makereport(item, call):
    outcome = yield
    rep = outcome.get_result()
    setattr(item, "rep_" + rep.when, rep)
Running Selenium and Playwright side by side? The browser is already in item.funcargs, so one hook covers both at once - no fixture of its own, and nothing to remember in each test. Add a fixture name to the table and that framework is covered too:
# conftest.py
import pytest
from pytest_html_reporter import attach

CAPTURE = {
    "driver": lambda driver: driver.get_screenshot_as_png(),  # Selenium
    "page":   lambda page: page.screenshot(),                 # Playwright
}

@pytest.hookimpl(hookwrapper=True)
def pytest_runtest_makereport(item, call):
    outcome = yield
    report = outcome.get_result()

    if report.when != "call" or not report.failed:
        return

    for name, capture in CAPTURE.items():
        handle = item.funcargs.get(name)
        if handle is not None:
            attach(data=capture(handle))
            return
This is what tests/functional/conftest.py in this repository does. Drop the report.failed check to photograph every test. The same guidance is printed on the Screenshots tab itself whenever a run captures nothing.
Or attach straight from a hook of your own, which already has the browser in item.funcargs:
# conftest.py
import pytest
from pytest_html_reporter import attach

@pytest.hookimpl(hookwrapper=True)
def pytest_runtest_makereport(item, call):
    outcome = yield
    rep = outcome.get_result()

    if rep.when == "call" and rep.failed:
        driver = item.funcargs.get("driver")
        if driver is not None:
            attach(data=driver.get_screenshot_as_png())
Note: put the hook in conftest.py. pytest does pick one up from a test module as well, but only for that module’s own tests - a conftest covers every test under it, which is almost always what you want.
The same hook covers Playwright by reaching for pytest-playwright’s page fixture instead:
page = item.funcargs.get("page")
if page is not None:
    attach(data=page.screenshot())
Note: the hook is synchronous, so Playwright’s async API cannot be photographed from it - there is nowhere to await. With async tests, call attach from the test body instead.

api logs / attachments
See it before you wire anything up - the bundled demo needs no browser and no network:
$ pytest tests/functional/test_attachments.py --html-report=./report
A picture is no use when the thing under test is an API. attach_text, attach_json, attach_api and attach_file take the payloads instead, and everything a test hands over is kept against that test and opened from the new API Logs tab. The Test Metrics table gains a Data column counting what each test attached; clicking it crosses to the tab with the list already narrowed to that one test.
from pytest_html_reporter import attach_api, attach_file, attach_json, attach_text

attach_api(requests.get(url))                         # the whole call
attach_json({"expected": order, "got": response})     # pretty-printed, secrets blanked
attach_text(query, name="Query", format="sql")        # any text at all
attach_file("payloads/order.json")                    # a small file from disk
For example, attaching the JSON response body
attach_json(requests.get("https://reqres.in/api/users/2").json())
api calls
attach_api is the one to reach for when a test talks HTTP. Hand it a response object and it takes the call apart:
def test_creates_an_order():
    response = requests.post(url, json=payload, headers=headers)
    attach_api(response)

    assert response.status_code == 201
Attach on failure, not on every call. Keeping every response buries the one that matters and grows the report for no reason; the payload worth having is the one behind a failure. Attach from a fixture’s teardown and let the outcome decide - the reporter builds a test’s record after the finalizers have run, which is what makes this work:
# conftest.py
import pytest
from pytest_html_reporter import attach_api

@pytest.fixture
def api(request):
    client = ApiClient()
    yield client

    if request.node.rep_call.failed:
        attach_api(client.last_response)

# lets the fixture above see how the test ended
@pytest.hookimpl(tryfirst=True, hookwrapper=True)
def pytest_runtest_makereport(item, call):
    outcome = yield
    setattr(item, "rep_" + outcome.get_result().when, outcome.get_result())
The same guidance is printed on the API Logs tab itself whenever a run attaches nothing, so it is there when you go looking for it.
The attachment holds the response body, the request body, both sets of headers, and the curl command that repeats the call - which is the first thing anyone does with a failed request, and the tedious thing to rebuild by hand from a report. The rail entry carries the method, the path, the status code (coloured by class) and how long it took.
Nothing is imported to read the response, so requests and httpx both work out of the box - and so does the async one, since it is the returned response that is passed, not the client:
attach_api(httpx.get(url))                     # httpx
attach_api(await client.get(url))              # httpx, async API
Every field can also be given directly, and an explicit one always wins over the response object. That is what makes the helper usable from a client neither library resembles, from a call reconstructed out of a log, or through a proxy that rewrites the URL:
attach_api(method="POST", url="/orders", status=500,
           request_body=payload, response_body=body, duration=1.4)

attach_api(response, url=upstream_url)         # override just the one field
Argument |
What it is |
|---|---|
response |
a response object to read the rest off; optional |
name |
the title in the rail (default: METHOD /path ) |
method url |
the request line |
status reason |
the response line, e.g. 422 and Unprocessable Entity |
duration |
how long the call took, in seconds |
request_headers |
a dict, a list of pairs, or any headers object with items() |
request_body |
str, bytes, or a dict / list to be serialised |
response_headers |
as above |
response_body |
as above |
content_type |
forces the syntax when there is no Content-Type header to read |
redact |
False keeps credentials in the report - see below |
Note: a body that parses as JSON is pretty-printed, whichever way it arrived. One that does not is kept exactly as it came, so half a response - the interesting case when a call is cut off - is still readable.
credentials are blanked out
A report is a build artifact. It gets published by CI, attached to tickets and pasted into chat, so attach_api and attach_json replace anything that looks like a credential with <redacted> - in the headers, in the curl command, and in the fields of a JSON body at any depth. Authorization, Cookie, Set-Cookie, any name containing token, secret, password, api-key or x-auth, and their underscore spellings, are all covered - in a query string as well, since ?api_key= is as ordinary in an API suite as the header is.
Authorization: <redacted>
Content-Type: application/json
Pass redact=False when the report is not leaving your machine and you need the real value:
attach_api(response, redact=False)
text, json and files
attach_text takes anything at all. format only picks how the viewer lays the text out - it is never used to reinterpret what you passed - and understands text (default), json, xml, html, yaml, sql and curl:
attach_text(response.text, name="Response body", format="json")
attach_text(cursor.query, name="Query", format="sql")
attach_text("the third retry is the one that worked")
attach_json takes a dict, a list or a JSON string and pretty-prints it, with the same redaction applied:
attach_json({"expected": {"id": 4711}, "got": {"error": "sku unknown"}}, name="Diff")
attach_file reads a small text file - a payload, a config, a HAR - and names it after the file. The syntax is guessed from the extension unless format says otherwise:
attach_file("payloads/order.json")
attach_file(har_path, name="Network trace")
A file holding JSON is redacted and pretty-printed like any other body - of everything you can attach this is the likeliest to be carrying a credential, since a HAR is a recording of the auth headers. A file that is not structured is kept verbatim: there is nothing to key a redaction off, and mangling a config file would be worse than not trying.
when to call them
Like attach, these can be called from anywhere in the test’s lifecycle: the test body, a unittest tearDown, a pytest fixture’s teardown or a pytest_runtest_makereport hook. Attaching the last call only when a test fails is a fixture away:
# conftest.py
import pytest
from pytest_html_reporter import attach_api

@pytest.fixture
def api(request):
    client = Client()
    yield client
    if request.node.rep_call.failed and client.last_response is not None:
        attach_api(client.last_response)

@pytest.hookimpl(tryfirst=True, hookwrapper=True)
def pytest_runtest_makereport(item, call):
    outcome = yield
    rep = outcome.get_result()
    setattr(item, "rep_" + rep.when, rep)
Note: put the hook in conftest.py. pytest does pick one up from a test module as well, but only for that module’s own tests - a conftest covers every test under it, which is almost always what you want.
A test that is retried by pytest-rerunfailures and attaches nothing on the attempt that finally passed keeps what the failing attempt attached, rather than losing the evidence by succeeding.
keeping the file down
Attachments are held outside the metrics table, so they are never swept into its search box or into the CSV, Excel and print exports. Two options decide how much of them is kept at all.
--report-attachments narrows whose attachments survive:
Value |
Kept |
|---|---|
all (default) |
Every test’s |
failed |
Only FAIL and ERROR tests’ |
none |
Nothing - the tab and the Data column go quiet |
--report-attachment-limit caps the characters kept per payload. What survives is the start of it - which is the opposite of the log limit, because a response puts its status, its error field and its first records at the top - with a note saying how much was dropped:
Value |
Kept |
|---|---|
20000 (default) |
20,000 characters per payload |
any positive integer |
Characters per payload |
0 |
Everything |
$ pytest --html-report=./report --report-attachments=failed --report-attachment-limit=5000
test coverage
Run with pytest-cov and the report grows a Test Coverage tab: the overall percentage as a ring, the counts beside it, a row per file with its missing lines, and the percentage plotted across the builds you have kept. A chip on the Dashboard shows the figure and crosses to the tab. Nothing needs configuring - if coverage was measured, it is there:
$ pytest tests/ --cov=my_package --html-report=./report
$ pytest tests/ --cov=my_package --cov-branch --html-report=./report
--cov takes the import name or the path of the code under test - your package, not the tests. Getting that wrong is the one thing that leaves the tab empty after doing everything else right, so the tab says so when it happens rather than showing you a guide to what you just did.
The number is coverage.py’s own, taken through its public API, so the tab and your terminal always agree. With --cov-branch on, branch coverage is folded into it exactly as pytest-cov folds it in, and the table gains a Branches column; without it, that column is dropped rather than filled with zeroes.
Files are listed least covered first, which is the order worth reading and the only defensible way to shorten the list on a large project.
Coverage that was measured somewhere else
The tab does not need pytest-cov to have run in this session. Point --report-coverage-file at a report that already exists - useful in CI, where coverage is often produced by an earlier step:
$ pytest tests/ --report-coverage-file=coverage.xml     # Cobertura, from `coverage xml`
$ pytest tests/ --report-coverage-file=coverage.json    # from `coverage json`
$ pytest tests/ --report-coverage-file=.coverage        # coverage.py's own data file
The kind is worked out from the file’s contents, not its name. A coverage.json or coverage.xml sitting beside the report or at the project root is found without being named at all. A .coverage data file is not picked up that way - one is usually left over from an earlier run, and quietly publishing a number from last Tuesday is worse than publishing none - so name it if you want it. Whichever source is used, the tab says which, and for a file it says when that file was written.
Reading a Cobertura coverage.xml needs no coverage package installed at all, which makes it the useful one when the reporting job is not the job that ran the tests.
Option |
What it does |
|---|---|
--report-coverage |
auto (default) builds the tab from whatever coverage is there; none switches it off, including the entry in output.json |
--report-coverage-file |
Read coverage from this file instead of looking for one |
--report-coverage-limit |
Files listed in the table, least covered first: 500 (default), any positive integer, or 0 for all of them |
Colour, targets and drift
The ring is green at 90% and above, amber at 75%, red below that - unless the project has stated its own bar with --cov-fail-under, in which case that is the line the colour is drawn at and the tab says so. A report should not disagree with the build that just passed or failed beside it:
$ pytest tests/ --cov=my_package --cov-fail-under=80 --html-report=./report
The percentage is written into output.json alongside the test counts, so it travels with the archived builds. That is what gives the tab its +0.8 since the last build and its trend line. A build that ran without coverage leaves a gap in that line rather than a drop to zero.
The annotated source
The one thing a summary cannot replace is the source, line by line, with the missed lines marked. Generate it and the tab links to it:
$ pytest tests/ --cov=my_package --cov-report=html --html-report=./report
It is linked, never embedded. Framing htmlcov into this page would break the property the whole reporter is built on - one file you can mail, publish as a CI artifact or open off a stick - and it would break silently, showing an empty frame wherever the folder did not travel with it. The link is offered only when the folder was written by this run, so an htmlcov left over from last week is not passed off as current.


the Test Coverage tab is empty
Work down this list; the first one that applies is the answer:
Did anything measure coverage? pytest-cov has to be installed and --cov passed. With neither, the tab shows the setup guide - which is the correct answer, not a fault.
Is --cov pointing at code that actually gets imported? This is the usual one. --cov=src against a project that has no src directory measures nothing at all, and pytest-cov prints Module src was never imported and No data was collected in among the rest of the run. The tab repeats it, naming the flag you typed. Pass your package instead - --cov=my_package, or a path like --cov=./app.
Is --report-coverage=none set? Check addopts and report_coverage in pytest.ini / pyproject.toml / tox.ini, not just the command you typed.
Is --report-coverage-file pointing at something that is not a coverage report? The tab names the file it could not read.
Whichever source the numbers do come from, the tab states it - Measured by pytest-cov during this run, or Read from coverage.xml, written 2026-08-31 20:23 - so you can always tell which of these you are in.
custom side-nav links
--report-link adds an entry to the report’s side nav pointing at any page you like - the annotated coverage source, a CI job, a Grafana board, an internal wiki page. Repeat it as often as you need:
$ pytest tests/ --report-link "Coverage=htmlcov/index.html" \
                --report-link "CI job=https://ci.example.com/job/42"
Relative paths are resolved from wherever the report is written, so linking a folder that ships beside it works. Links open in a new tab. Anything carrying a scheme other than http, https or mailto - javascript: and data:, in practice - is dropped rather than rendered: a report is a build artifact that gets published and passed round, and a nav entry has no business being able to run something in whoever opens it.

parallel runs
Runs distributed with pytest-xdist are gathered into a single report. Every worker sends its results back to the controller, which merges them and writes one report - one build in Archives, one set of totals, one row per test - whichever way the tests were distributed:
$ pytest tests/ -n 2 --html-report=./report
$ pytest tests/ -n auto --dist loadfile --html-report=./report
Tests are listed in collection order rather than the order the workers happened to finish them in, so a parallel report reads the same as a serial one. Nothing needs to be configured, and running without -n is unaffected.
Note: results are handed over when a worker finishes, so tests from a worker that crashes outright (rather than failing) are not in the report - pytest reports the crash itself
Is there a demo available for this gem?
Yes, you can use this demo as an example, https://github.com/prashanth-sams/pytest-html-reporter:
$ pytest tests/functional/
1 maintainer

Download files
Download the file for your platform. If you're not sure which to choose, learn more about installing packages.
Source Distribution
Built Distribution
Filter files by name, interpreter, ABI, and platform.
If you're not sure about the file name format, learn more about wheel file names.
Copy a direct link to the current filters
File details
Details for the file pytest_html_reporter-0.3.6.tar.gz.
File metadata
- Download URL: pytest_html_reporter-0.3.6.tar.gz
- Upload date:
- Size: 125.0 kB
- Tags: Source
- Uploaded using Trusted Publishing? No
- Uploaded via:
twine/7.0.0 CPython/3.14.6
File hashes
| Algorithm | Hash digest | |
|---|---|---|
| SHA256 |
fbfdd1dab16cc403292d74008f304852ade1be9de01d15b08a36c5ed8f76c4b5
|
|
| MD5 |
0c3517e0964a3947d4dbf614ca3e8fae
|
|
| BLAKE2b-256 |
3b87f3b3214978137e7cc268d53ce6d738840e2f45333ff8e12c8a5b1841ad41
|
File details
Details for the file pytest_html_reporter-0.3.6-py3-none-any.whl.
File metadata
- Download URL: pytest_html_reporter-0.3.6-py3-none-any.whl
- Upload date:
- Size: 113.2 kB
- Tags: Python 3
- Uploaded using Trusted Publishing? No
- Uploaded via:
twine/7.0.0 CPython/3.14.6
File hashes
| Algorithm | Hash digest | |
|---|---|---|
| SHA256 |
38f013a90de8f79cb4c097de16d9d2a17f7958bad893097661e25b01a5f625bb
|
|
| MD5 |
bfdf443d2bfebf33cf3f5cf396ea0924
|
|
| BLAKE2b-256 |
7f6439b606033a5d5c8bf1f1c39434627e4f6446b9893d417947083a43d3ed1d
|














