
regridding






Numba-accelerated multilinear and first-order conservative interpolation of Numpy arrays.
Resampling a rectilinear grid onto another rectilinear grid is covered well by
numpy.interp and scipy.interpolate.
This package addresses two cases those tools do not:
- the grids can be curvilinear, meaning that every vertex carries its own coordinates and the cells are arbitrary quadrilaterals, not the outer product of two 1D axes;
- the resampling can be conservative, meaning that the sum of the resampled array matches the sum of the original array (up to the portion of the input grid not covered by the output grid). This is essential when the array stores an extensive quantity, such as a number of photons, rather than an intensity.
Since these operations are expensive, the inner loops are compiled with
Numba,
and the sparse matrix relating the two grids can be saved using
regridding.weights() and reused for every array defined on that grid.
Installation
regridding is published on the Python Package Index and can be installed using pip
pip install regridding
Features
regrid(), which resamples an array onto a new grid using either of two methods:"multilinear", linear interpolation along one axis;"conservative", first-order conservative resampling of 1D grids and of 2D logically-rectangular curvilinear grids, using the algorithm described in Ramshaw (1985).
weights()andregrid_from_weights(), which split the operation into an expensive build and a cheap application, so that many arrays defined on the same grid share one build. A build is reproducible, so it can be saved to disk and reused across sessions.transpose_weights()andtranspose_weights_conservative(), which reverse a saved resampling, as needed by iterative inversions.fill(), which fills the missing values of an array by interpolating from the valid points.find_indices(), which locates the input cell containing each output vertex.
Key concepts
A grid is a tuple of coordinate arrays.
coordinates_input and coordinates_output each contain one array per resampled
dimension, and these arrays are broadcast against each other, as returned by
numpy.meshgrid with indexing="ij".
A 1D grid is therefore (x,) and a 2D grid is (x, y).
The coordinates describe vertices, and the values describe cells.
The conservative method interprets coordinates_input as the edges of each
cell, so values_input has one fewer element along each resampled axis.
The multilinear method interprets the coordinates as the sample points
themselves, so the shapes match.
method |
meaning of coordinates_input |
length of values_input |
|---|---|---|
"multilinear" |
the sample points | n |
"conservative" |
the edges of each cell | n - 1 |
Only the selected axes are resampled.
The axis_input and axis_output arguments select which axes participate in
the operation, and default to all of them.
The remaining axes are orthogonal to the operation, and the resampling is
repeated independently for every position along them.
This is how a stack of images, or a spectrum for each pixel, is resampled in one
call.
Degenerate grids are perturbed.
Where a vertex of the output grid lands exactly on an edge of the input grid,
the overlap between the two cells is ambiguous.
The conservative method therefore jitters the output grid by 1e-9 of its
width before clipping, which can be controlled using the perturb argument.
The jitter is drawn from a generator with a fixed seed, so repeated calls on the
same grids return identical weights, which makes a saved build safe to compare
or cache.
Pass seed=None for an independent perturbation on every call, or a
numpy.random.Generator to control the draw.
Documentation
The full documentation, including the API reference and executable versions of the examples below, is hosted at regridding.readthedocs.io.
Gallery
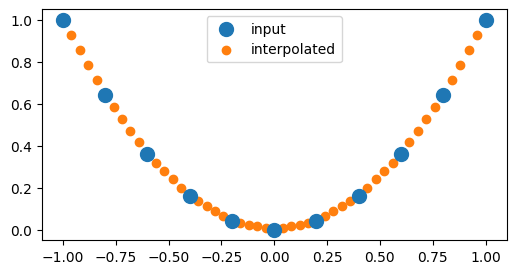
Regrid a 1D array using multilinear interpolation.
import numpy as np
import matplotlib.pyplot as plt
import regridding

# Define the input grid
x_input = np.linspace(-1, 1, num=11)

# Define the input array
values_input = np.square(x_input)

# Define the output grid
x_output = np.linspace(-1, 1, num=51)

# Regrid the input array onto the output grid
values_output = regridding.regrid(
    coordinates_input=(x_input,),
    coordinates_output=(x_output,),
    values_input=values_input,
    method="multilinear",
)

# Plot the results
plt.figure(figsize=(6, 3));
plt.scatter(x_input, values_input, s=100, label="input", zorder=1);
plt.scatter(x_output, values_output, label="interpolated", zorder=0);
plt.legend();
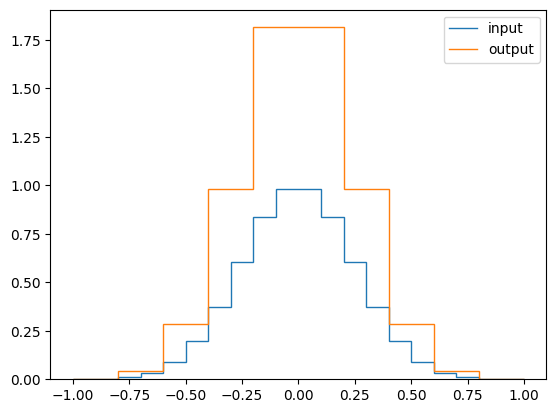
Regrid a 1D array using conservative resampling.
import numpy as np
import matplotlib.pyplot as plt
import regridding

# Define the edges of the input grid
x_input = np.linspace(-1, 1, num=21)

# Define the edges of the output grid
# with a small offset to prevent degenerate cells
x_output = np.linspace(-1, 1, num=11)[::-1] + 1e-6

# Compute the centers of the input grid
x = (x_input[1:] + x_input[:-1]) / 2

# Define an array of values for each cell
# of the input grid
values = np.exp(-(x / 0.25) ** 2 /2)

# Regrid the array of values onto the output grid
values_new = regridding.regrid(
    coordinates_input=x_input,
    coordinates_output=x_output,
    values_input=values,
    method="conservative",
)

# Plot the result
fig, ax = plt.subplots()
ax.stairs(values, x_input, label="input")
ax.stairs(values_new, x_output, label="output")
ax.legend();
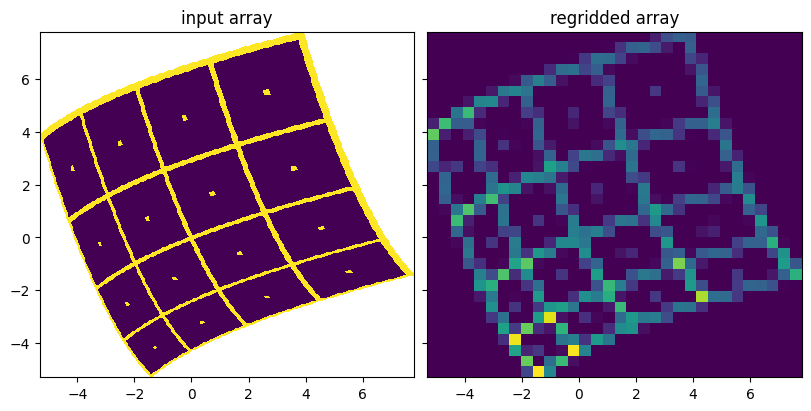
Regrid a 2D array using conservative resampling.
import numpy as np
import matplotlib.pyplot as plt
import regridding

# Define the number of edges in the input grid
num_x = 66
num_y = 66

# Define a dummy linear grid
x = np.linspace(-5, 5, num=num_x)
y = np.linspace(-5, 5, num=num_y)
x, y = np.meshgrid(x, y, indexing="ij")

# Define the curvilinear input grid using the dummy grid
angle = 0.4
x_input = x * np.cos(angle) - y * np.sin(angle) + 0.05 * x * x
y_input = x * np.sin(angle) + y * np.cos(angle) + 0.05 * y * y

# Define the test pattern
pitch = 16
a_input = 0 * x[:~0,:~0]
a_input[::pitch, :] = 1
a_input[:, ::pitch] = 1
a_input[pitch//2::pitch, pitch//2::pitch] = 1

# Define a rectilinear output grid using the limits of the input grid
x_output = np.linspace(x_input.min(), x_input.max(), num_x // 2)
y_output = np.linspace(y_input.min(), y_input.max(), num_y // 2)
x_output, y_output = np.meshgrid(x_output, y_output, indexing="ij")

# Regrid the test pattern onto the new grid
a_output = regridding.regrid(
    coordinates_input=(x_input, y_input),
    coordinates_output=(x_output, y_output),
    values_input=a_input,
    method="conservative",
)

fig, axs = plt.subplots(
    ncols=2,
    sharex=True,
    sharey=True,
    figsize=(8, 4),
    constrained_layout=True,
);
axs[0].pcolormesh(x_input, y_input, a_input);
axs[0].set_title("input array");
axs[1].pcolormesh(x_output, y_output, a_output);
axs[1].set_title("regridded array");
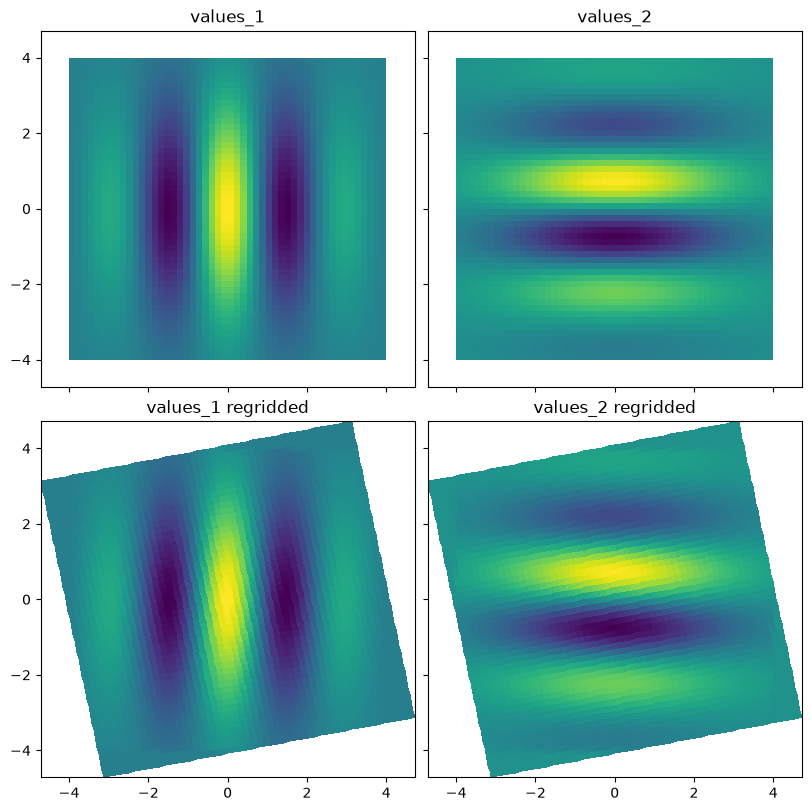
Save the weights relating two grids, and reuse them to regrid several arrays.
import numpy as np
import matplotlib.pyplot as plt
import regridding

# Define the input grid
x_input = np.linspace(-4, 4, num=51)
y_input = np.linspace(-4, 4, num=51)
x_input, y_input = np.meshgrid(x_input, y_input, indexing="ij")

# Define a rotated output grid
angle = 0.2
x_output = x_input * np.cos(angle) - y_input * np.sin(angle)
y_output = x_input * np.sin(angle) + y_input * np.cos(angle)

# Compute the centers of the input grid
x = (x_input[1:, 1:] + x_input[:~0, :~0]) / 2
y = (y_input[1:, 1:] + y_input[:~0, :~0]) / 2

# Define two arrays of values defined on the same grid
envelope = np.exp(-(np.square(x) + np.square(y)) / 8)
values_1 = envelope * np.cos(2 * x)
values_2 = envelope * np.sin(2 * y)

# Save the weights relating the input and output grids
weights = regridding.weights(
    coordinates_input=(x_input, y_input),
    coordinates_output=(x_output, y_output),
    method="conservative",
)

# Regrid both arrays of values using the saved weights
values_1_output = regridding.regrid_from_weights(*weights, values_input=values_1)
values_2_output = regridding.regrid_from_weights(*weights, values_input=values_2)

# Plot the results
fig, axs = plt.subplots(
    nrows=2,
    ncols=2,
    sharex=True,
    sharey=True,
    figsize=(8, 8),
    constrained_layout=True,
);
axs[0, 0].pcolormesh(x_input, y_input, values_1);
axs[0, 0].set_title("values_1");
axs[0, 1].pcolormesh(x_input, y_input, values_2);
axs[0, 1].set_title("values_2");
axs[1, 0].pcolormesh(x_output, y_output, values_1_output);
axs[1, 0].set_title("values_1 regridded");
axs[1, 1].pcolormesh(x_output, y_output, values_2_output);
axs[1, 1].set_title("values_2 regridded");
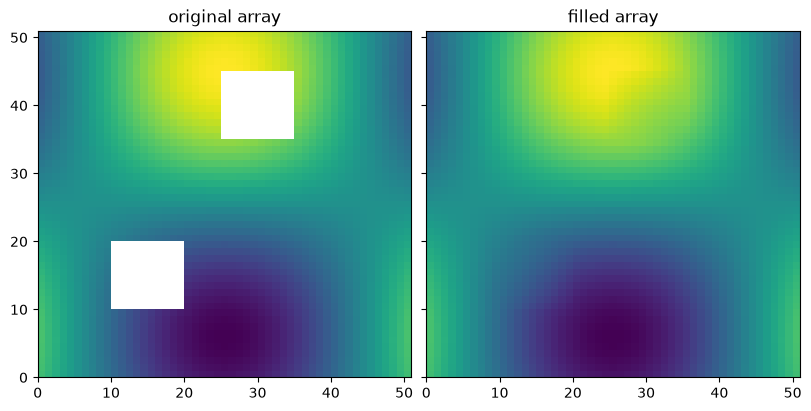
Fill the missing values of an array by interpolating from the valid points.
import numpy as np
import matplotlib.pyplot as plt
import regridding

# Define an array with a few missing values
a = np.sin(np.linspace(-2, 2, num=51)[:, np.newaxis])
a = a * np.cos(np.linspace(-2, 2, num=51)[np.newaxis, :])
a[10:20, 10:20] = np.nan
a[35:45, 25:35] = np.nan

# Fill the missing values
a_filled = regridding.fill(a, method="gauss_seidel", num_iterations=50)

# Plot the result
fig, axs = plt.subplots(
    ncols=2,
    sharex=True,
    sharey=True,
    figsize=(8, 4),
    constrained_layout=True,
);
axs[0].pcolormesh(a, vmin=-1, vmax=1);
axs[0].set_title("original array");
axs[1].pcolormesh(a_filled, vmin=-1, vmax=1);
axs[1].set_title("filled array");
Development
Install the package in editable mode along with its test dependencies, and run the test suite using pytest:
pip install -e .[test]
pytest
This project is formatted using black and linted using ruff, both of which are checked by continuous integration:
black .
ruff check .
To build the documentation locally:
pip install -e .[doc]
sphinx-build docs docs/_build/html
1 maintainer

Download files
Download the file for your platform. If you're not sure which to choose, learn more about installing packages.
Source Distribution
Built Distribution
Filter files by name, interpreter, ABI, and platform.
If you're not sure about the file name format, learn more about wheel file names.
Copy a direct link to the current filters
File details
Details for the file regridding-3.3.0.tar.gz.
File metadata
- Download URL: regridding-3.3.0.tar.gz
- Upload date:
- Size: 163.9 kB
- Tags: Source
- Uploaded using Trusted Publishing? No
- Uploaded via:
twine/7.0.0 CPython/3.13.14
File hashes
| Algorithm | Hash digest | |
|---|---|---|
| SHA256 |
2b530c529eee6c801e9b00b09f5a76cf166576acbf221a1fbf0bfe0c17f9ac53
|
|
| MD5 |
a4997ee5f964692bc4b65ca3a3da6d42
|
|
| BLAKE2b-256 |
439774c98b80d077744069ea439cda14ff25b0e4fb36ac2e8ab64e32809de0cb
|
File details
Details for the file regridding-3.3.0-py3-none-any.whl.
File metadata
- Download URL: regridding-3.3.0-py3-none-any.whl
- Upload date:
- Size: 162.9 kB
- Tags: Python 3
- Uploaded using Trusted Publishing? No
- Uploaded via:
twine/7.0.0 CPython/3.13.14
File hashes
| Algorithm | Hash digest | |
|---|---|---|
| SHA256 |
f34bbca3f07e23c9963647e92c5f53482e0f9b5d375713a5c9926a200954ff49
|
|
| MD5 |
fbe73f356d8273416dd8b11fa289c2d0
|
|
| BLAKE2b-256 |
6243b16989ff1d9a3980ff36c541b48f3cc02e71510515d42577f6d4c4d459e5
|














