Scalene: A high-resolution, low-overhead CPU, GPU, and memory profiler for Python

Project description

Scalene: a Python CPU+GPU+memory profiler with AI-powered optimization proposals
by Emery Berger, Sam Stern, and Juan Altmayer Pizzorno.


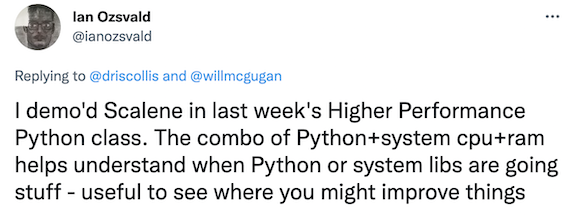
(tweet from Ian Ozsvald, author of High Performance Python)
About Scalene
Scalene is a high-performance CPU, GPU and memory profiler for Python that does a number of things that other Python profilers do not and cannot do. It runs orders of magnitude faster than many other profilers while delivering far more detailed information. It is also the first profiler ever to incorporate AI-powered proposed optimizations. To enable these, you need to enter an OpenAI key:
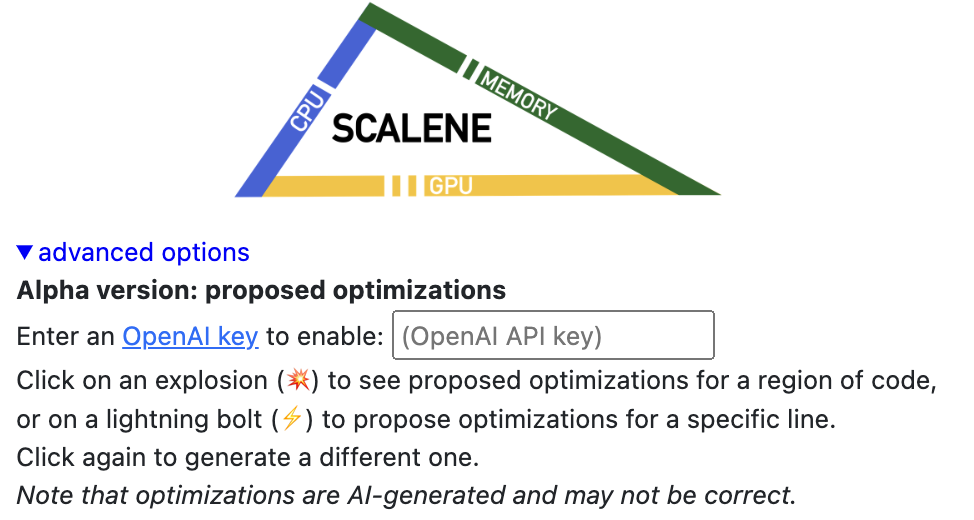
Once a valid key is entered, click on the lightning bolt (⚡) beside any line or the explosion (💥) for an entire region of code to generate a proposed optimization. Click on a proposed optimization to copy it to the clipboard.
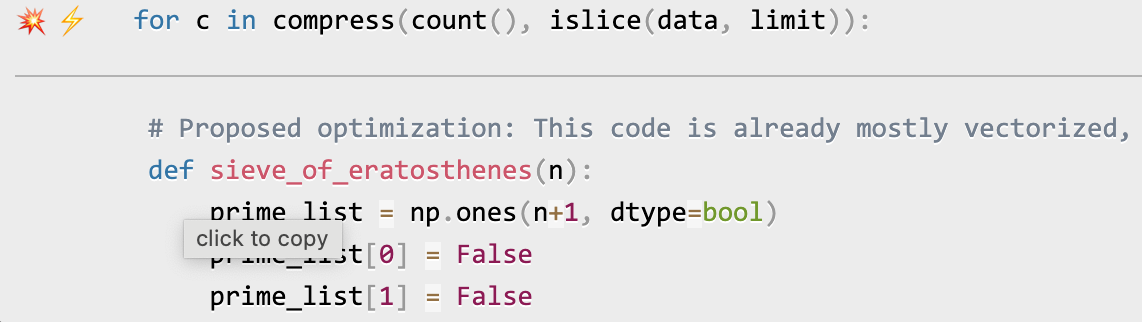
You can click as many times as you like on the lightning bolt or explosion, and it will generate different suggested optimizations. Your mileage may vary, but in some cases, the suggestions are quite impressive (e.g., order-of-magnitude improvements).
Quick Start
Installing Scalene:
python3 -m pip install -U scalene
or
conda install -c conda-forge scalene
Using Scalene:
Commonly used options:
scalene your_prog.py                             # full profile (outputs to web interface)
python3 -m scalene your_prog.py                  # equivalent alternative

scalene --cli your_prog.py                       # use the command-line only (no web interface)

scalene --cpu your_prog.py                       # only profile CPU
scalene --cpu --gpu your_prog.py                 # only profile CPU and GPU
scalene --cpu --gpu --memory your_prog.py        # profile everything (same as no options)

scalene --reduced-profile your_prog.py           # only profile lines with significant usage
scalene --profile-interval 5.0 your_prog.py      # output a new profile every five seconds

scalene (Scalene options) --- your_prog.py (...) # use --- to tell Scalene to ignore options after that point
scalene --help                                   # lists all options
Using Scalene programmatically in your code:
Invoke using scalene as above and then:
from scalene import scalene_profiler

# Turn profiling on
scalene_profiler.start()

# Turn profiling off
scalene_profiler.stop()
Using Scalene to profile only specific functions via @profile:
Just preface any functions you want to profile with the @profile decorator and run it with Scalene:
# do not import profile!

@profile
def slow_function():
    import time
    time.sleep(3)
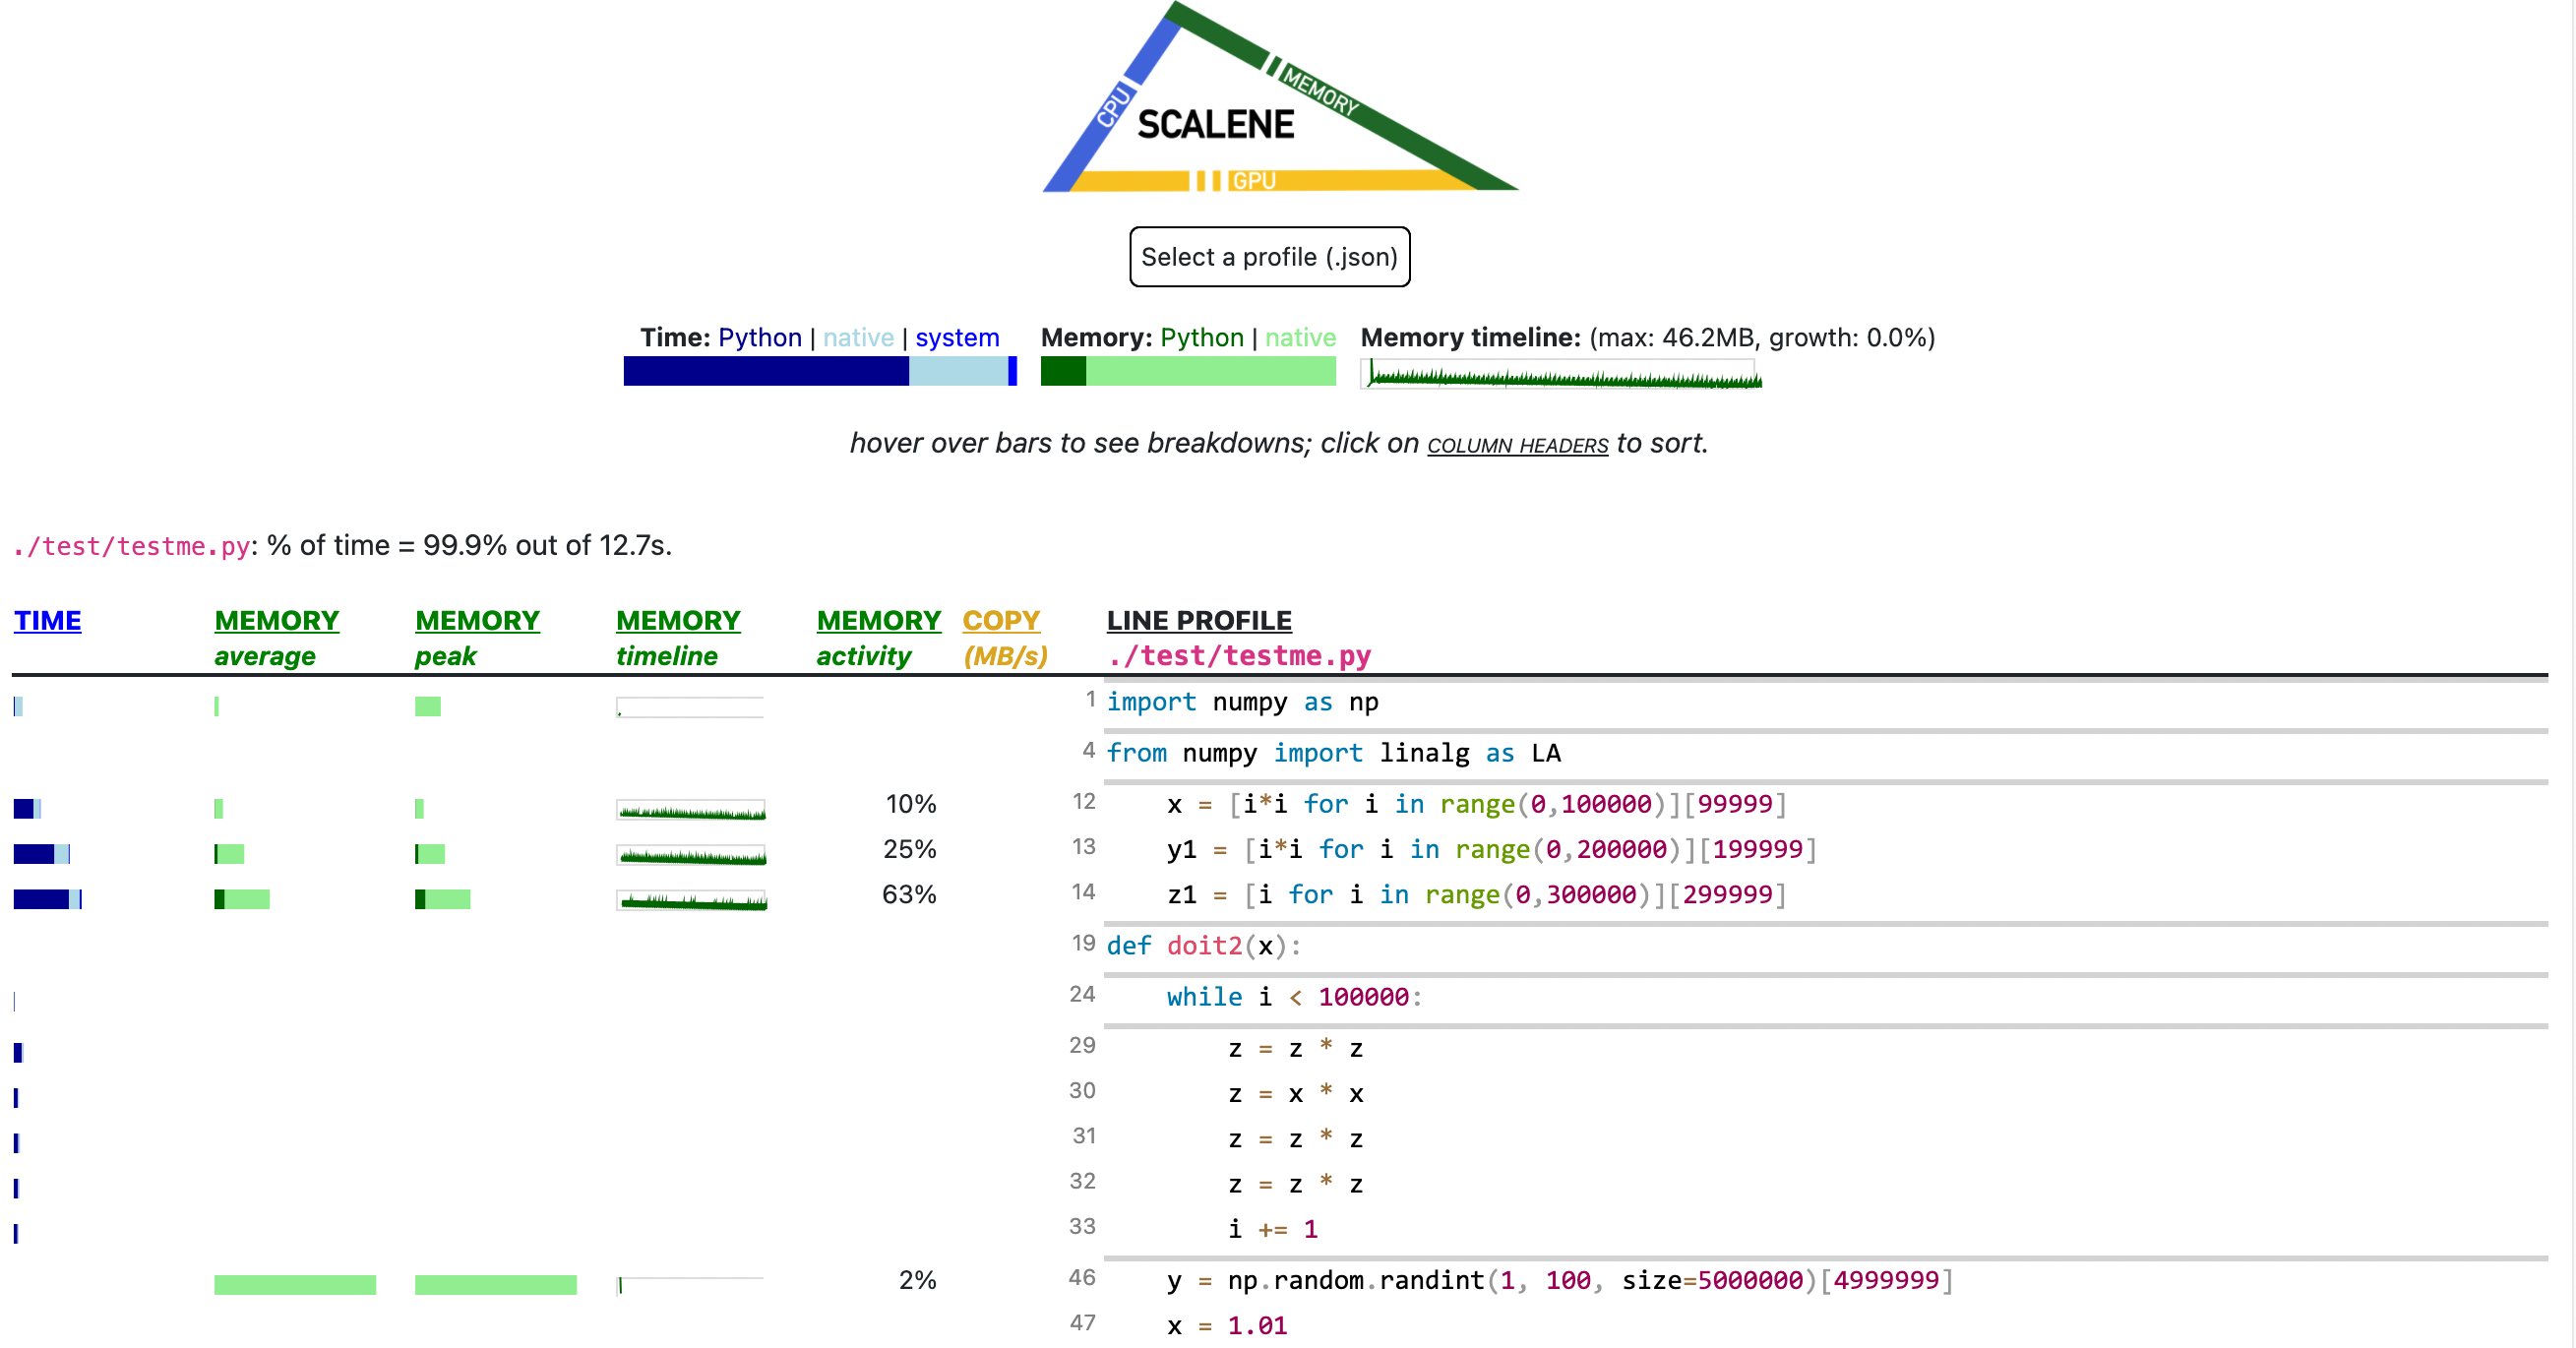
Web-based GUI
Scalene has both a CLI and a web-based GUI (demo here).
By default, once Scalene has profiled your program, it will open a
tab in a web browser with an interactive user interface (all processing is done
locally). Hover over bars to see breakdowns of CPU and memory
consumption, and click on underlined column headers to sort the
columns. The generated file profile.html is self-contained and can be saved for later use.
Scalene Overview
Scalene talk (PyCon US 2021)
This talk presented at PyCon 2021 walks through Scalene's advantages and how to use it to debug the performance of an application (and provides some technical details on its internals). We highly recommend watching this video!

Fast and Accurate
-
Scalene is fast. It uses sampling instead of instrumentation or relying on Python's tracing facilities. Its overhead is typically no more than 10-20% (and often less).
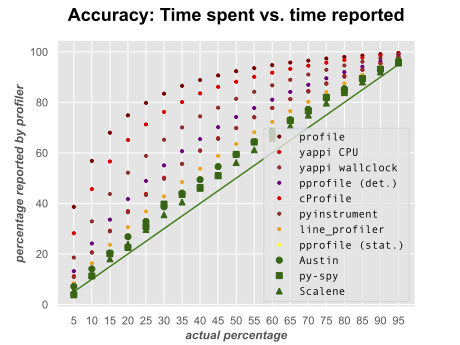
-
Scalene is accurate. We tested CPU profiler accuracy and found that Scalene is among the most accurate profilers, correctly measuring time taken.
- Scalene performs profiling at the line level and per function, pointing to the functions and the specific lines of code responsible for the execution time in your program.
CPU profiling
- Scalene separates out time spent in Python from time in native code (including libraries). Most Python programmers aren't going to optimize the performance of native code (which is usually either in the Python implementation or external libraries), so this helps developers focus their optimization efforts on the code they can actually improve.
- Scalene highlights hotspots (code accounting for significant percentages of CPU time or memory allocation) in red, making them even easier to spot.
- Scalene also separates out system time, making it easy to find I/O bottlenecks.
GPU profiling
- Scalene reports GPU time (currently limited to NVIDIA-based systems).
Memory profiling
- Scalene profiles memory usage. In addition to tracking CPU usage, Scalene also points to the specific lines of code responsible for memory growth. It accomplishes this via an included specialized memory allocator.
- Scalene separates out the percentage of memory consumed by Python code vs. native code.
- Scalene produces per-line memory profiles.
- Scalene identifies lines with likely memory leaks.
- Scalene profiles copying volume, making it easy to spot inadvertent copying, especially due to crossing Python/library boundaries (e.g., accidentally converting
numpyarrays into Python arrays, and vice versa).
Other features
- Scalene can produce reduced profiles (via
--reduced-profile) that only report lines that consume more than 1% of CPU or perform at least 100 allocations. - Scalene supports
@profiledecorators to profile only specific functions. - When Scalene is profiling a program launched in the background (via
&), you can suspend and resume profiling.
Comparison to Other Profilers
Performance and Features
Below is a table comparing the performance and features of various profilers to Scalene.
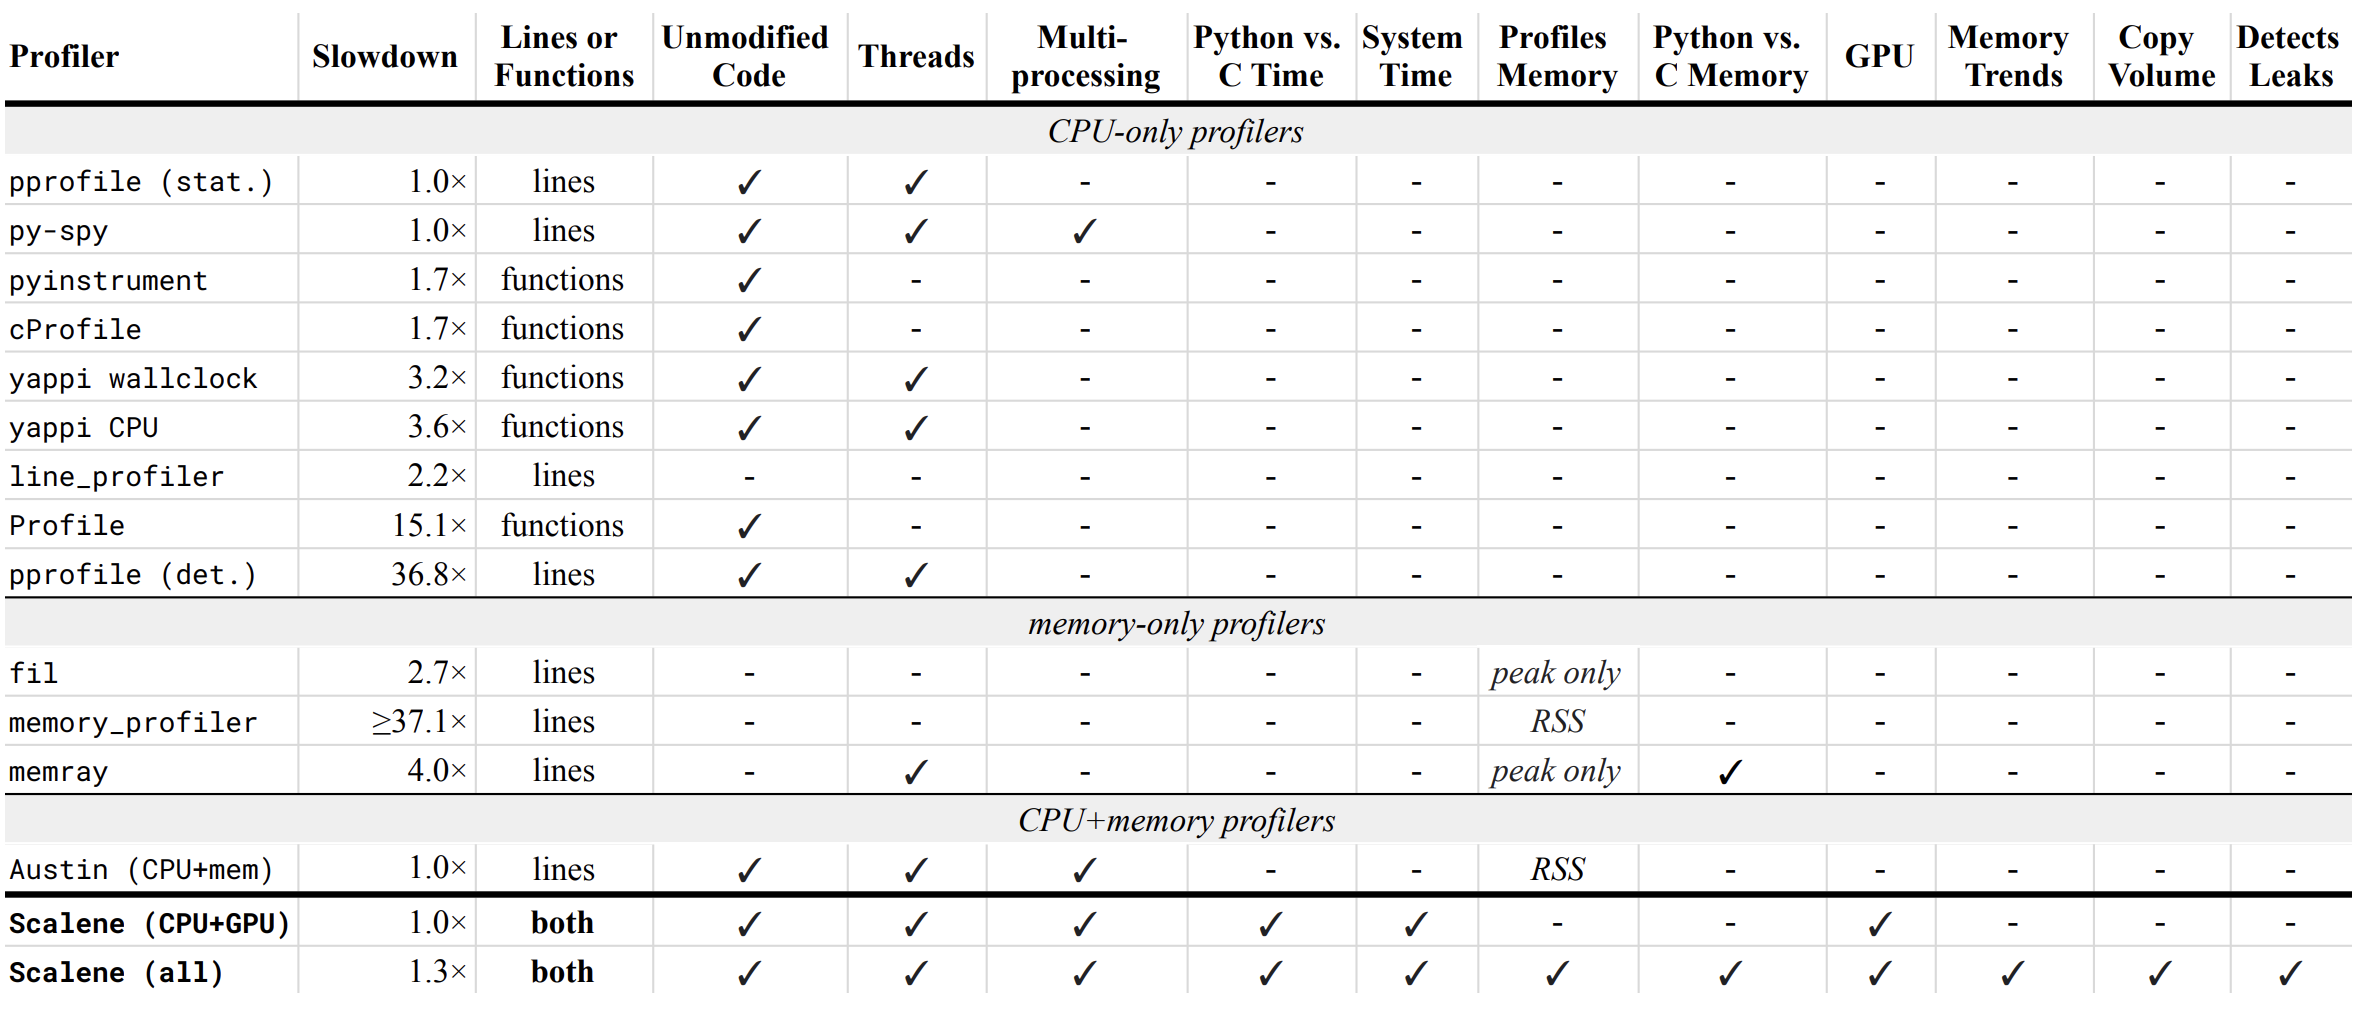
- Slowdown: the slowdown when running a benchmark from the Pyperformance suite. Green means less than 2x overhead. Scalene's overhead is just a 35% slowdown.
Scalene has all of the following features, many of which only Scalene supports:
- Lines or functions: does the profiler report information only for entire functions, or for every line -- Scalene does both.
- Unmodified Code: works on unmodified code.
- Threads: supports Python threads.
- Multiprocessing: supports use of the
multiprocessinglibrary -- Scalene only - Python vs. C time: breaks out time spent in Python vs. native code (e.g., libraries) -- Scalene only
- System time: breaks out system time (e.g., sleeping or performing I/O) -- Scalene only
- Profiles memory: reports memory consumption per line / function
- GPU: reports time spent on an NVIDIA GPU (if present) -- Scalene only
- Memory trends: reports memory use over time per line / function -- Scalene only
- Copy volume: reports megabytes being copied per second -- Scalene only
- Detects leaks: automatically pinpoints lines responsible for likely memory leaks -- Scalene only
Output
If you include the --cli option, Scalene prints annotated source code for the program being profiled
(as text, JSON (--json), or HTML (--html)) and any modules it
uses in the same directory or subdirectories (you can optionally have
it --profile-all and only include files with at least a
--cpu-percent-threshold of time). Here is a snippet from
pystone.py.
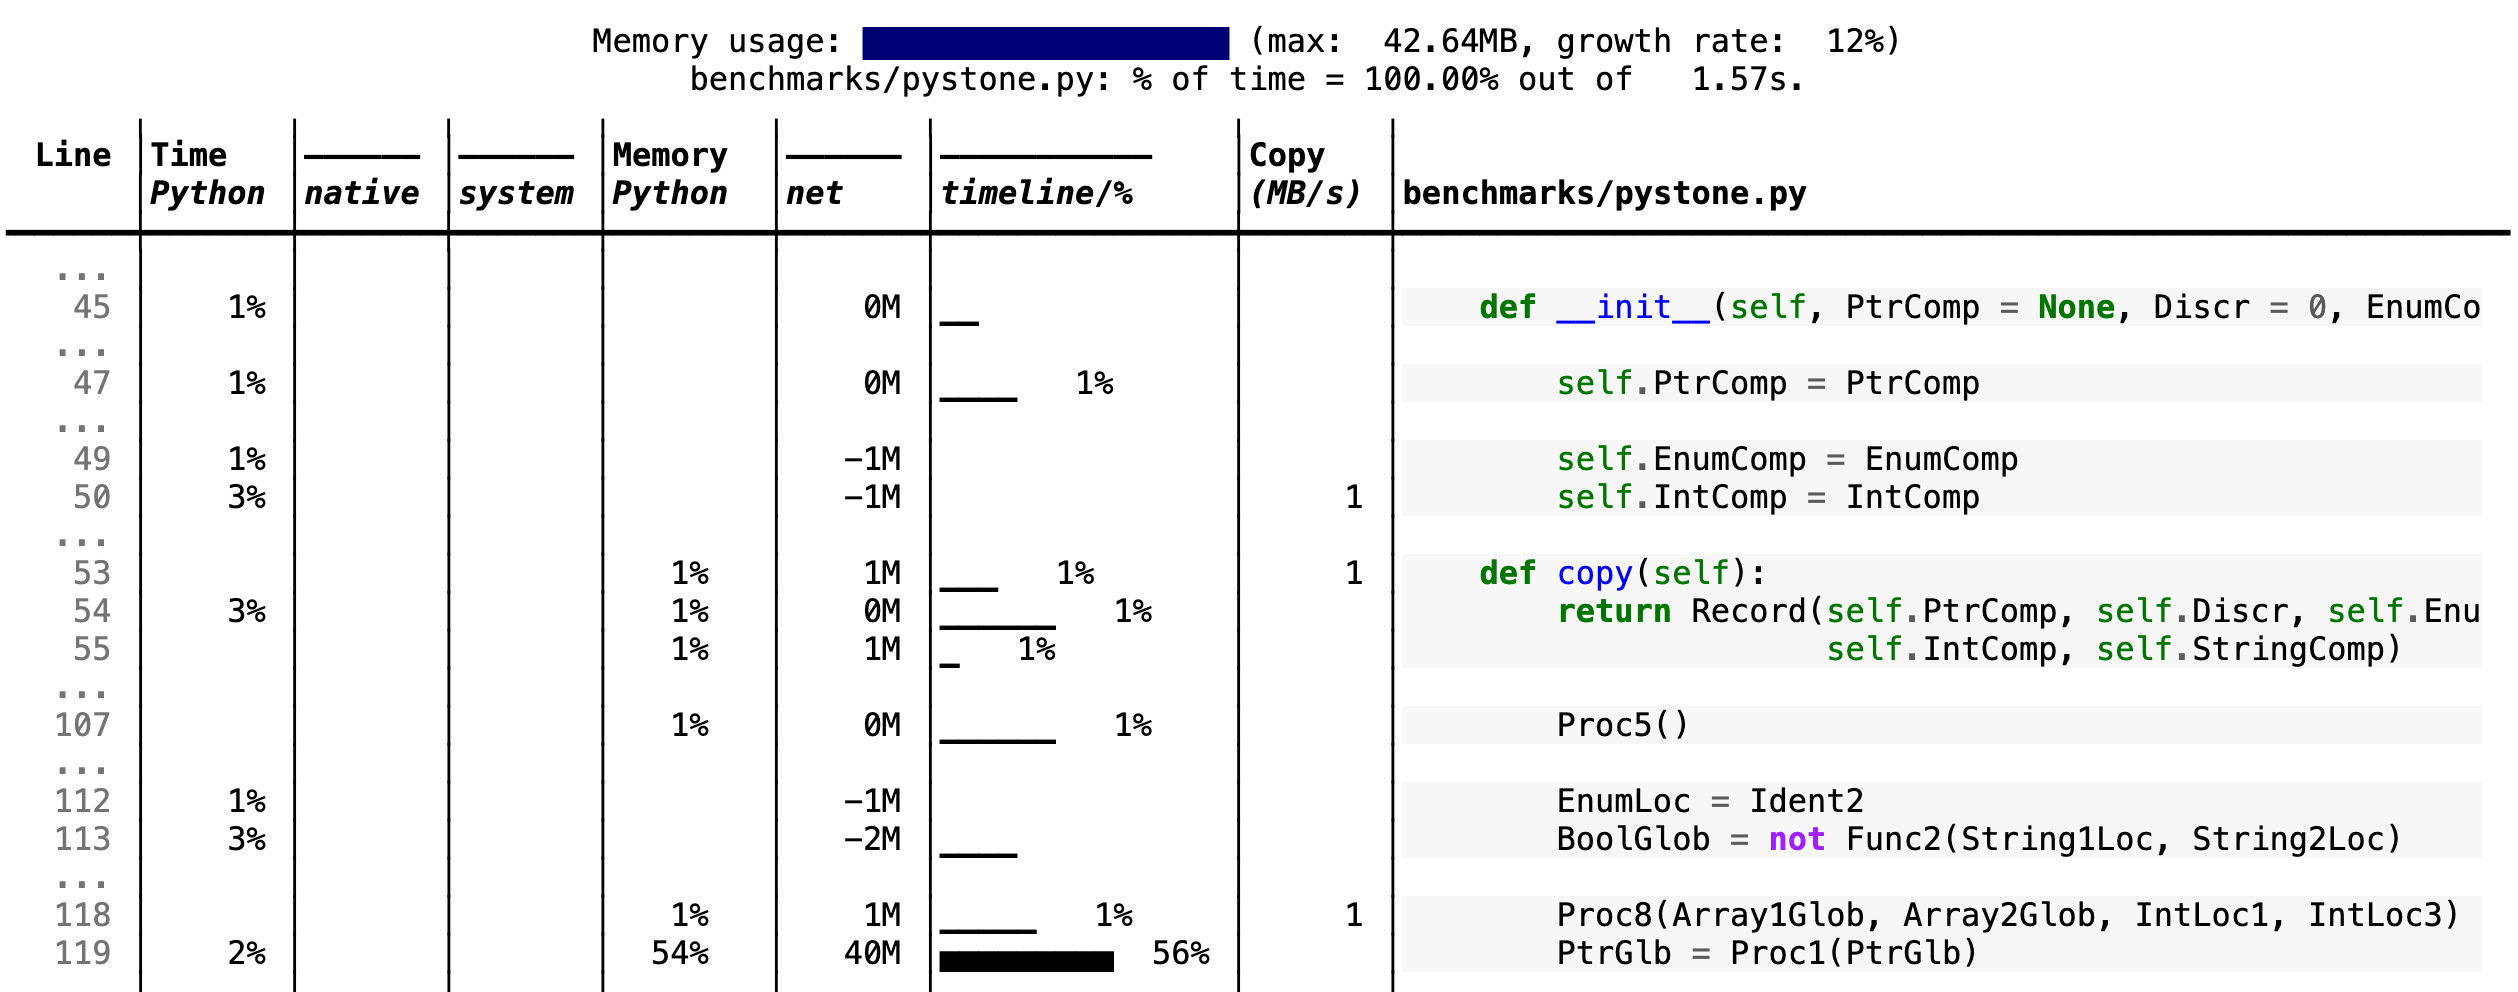
- Memory usage at the top: Visualized by "sparklines", memory consumption over the runtime of the profiled code.
- "Time Python": How much time was spent in Python code.
- "native": How much time was spent in non-Python code (e.g., libraries written in C/C++).
- "system": How much time was spent in the system (e.g., I/O).
- "GPU": (not shown here) How much time spent on the GPU, if your system has an NVIDIA GPU installed.
- "Memory Python": How much of the memory allocation happened on the Python side of the code, as opposed to in non-Python code (e.g., libraries written in C/C++).
- "net": Positive net memory numbers indicate total memory allocation in megabytes; negative net memory numbers indicate memory reclamation.
- "timeline / %": Visualized by "sparklines", memory consumption generated by this line over the program runtime, and the percentages of total memory activity this line represents.
- "Copy (MB/s)": The amount of megabytes being copied per second (see "About Scalene").
Scalene
The following command runs Scalene on a provided example program.
scalene test/testme.py
Click to see all Scalene's options (available by running with --help)
    % scalene --help
     usage: scalene [-h] [--outfile OUTFILE] [--html] [--reduced-profile]
                    [--profile-interval PROFILE_INTERVAL] [--cpu-only]
                    [--profile-all] [--profile-only PROFILE_ONLY]
                    [--use-virtual-time]
                    [--cpu-percent-threshold CPU_PERCENT_THRESHOLD]
                    [--cpu-sampling-rate CPU_SAMPLING_RATE]
                    [--malloc-threshold MALLOC_THRESHOLD]

     Scalene: a high-precision CPU and memory profiler.
     https://github.com/plasma-umass/scalene

     command-line:
        % scalene [options] yourprogram.py
     or
        % python3 -m scalene [options] yourprogram.py

     in Jupyter, line mode:
        %scrun [options] statement

     in Jupyter, cell mode:
        %%scalene [options]
        code...
        code...

     optional arguments:
       -h, --help            show this help message and exit
       --outfile OUTFILE     file to hold profiler output (default: stdout)
       --html                output as HTML (default: text)
       --reduced-profile     generate a reduced profile, with non-zero lines only (default: False)
       --profile-interval PROFILE_INTERVAL
                             output profiles every so many seconds (default: inf)
       --cpu-only            only profile CPU time (default: profile CPU, memory, and copying)
       --profile-all         profile all executed code, not just the target program (default: only the target program)
       --profile-only PROFILE_ONLY
                             profile only code in filenames that contain the given strings, separated by commas (default: no restrictions)
       --use-virtual-time    measure only CPU time, not time spent in I/O or blocking (default: False)
       --cpu-percent-threshold CPU_PERCENT_THRESHOLD
                             only report profiles with at least this percent of CPU time (default: 1%)
       --cpu-sampling-rate CPU_SAMPLING_RATE
                             CPU sampling rate (default: every 0.01s)
       --malloc-threshold MALLOC_THRESHOLD
                             only report profiles with at least this many allocations (default: 100)

     When running Scalene in the background, you can suspend/resume profiling
     for the process ID that Scalene reports. For example:

        % python3 -m scalene [options] yourprogram.py &
      Scalene now profiling process 12345
        to suspend profiling: python3 -m scalene.profile --off --pid 12345
        to resume profiling:  python3 -m scalene.profile --on  --pid 12345
Scalene with Jupyter
Instructions for installing and using Scalene with Jupyter notebooks
This notebook illustrates the use of Scalene in Jupyter.
Installation:
!pip install scalene
%load_ext scalene
Line mode:
%scrun [options] statement
Cell mode:
%%scalene [options]
code...
code...
Installation
Using pip (Mac OS X, Linux, Windows, and WSL2)
Scalene is distributed as a pip package and works on Mac OS X, Linux (including Ubuntu in Windows WSL2) and (with limitations) Windows platforms. (Note: the Windows version isn't yet complete; it currently only supports CPU and GPU profiling, but not memory profiling.)
You can install it as follows:
% pip install -U scalene
or
% python3 -m pip install -U scalene
You may need to install some packages first.
See https://stackoverflow.com/a/19344978/4954434 for full instructions for all Linux flavors.
For Ubuntu/Debian:
% sudo apt install git python3-all-dev
Using Homebrew (Mac OS X)
As an alternative to pip, you can use Homebrew to install the current version of Scalene from this repository:
  % brew tap plasma-umass/scalene
  % brew install --head plasma-umass/scalene/scalene
On ArchLinux
You can install Scalene on Arch Linux via the AUR
package. Use your favorite AUR helper, or
manually download the PKGBUILD and run makepkg -cirs to build. Note that this will place
libscalene.so in /usr/lib; modify the below usage instructions accordingly.
Asked Questions
Can I use Scalene with PyTest?
A: Yes! You can run it as follows (for example):
python3 -m scalene --- -m pytest your_test.py
Is there any way to get shorter profiles or do more targeted profiling?
A: Yes! There are several options:
- Use
--reduced-profileto include only lines and files with memory/CPU/GPU activity. - Use
--profile-onlyto include only filenames containing specific strings (as in,--profile-only foo,bar,baz). - Decorate functions of interest with
@profileto have Scalene report only those functions. - Turn profiling on and off programmatically by importing Scalene (
import scalene) and then turning profiling on and off viascalene_profiler.start()andscalene_profiler.stop(). By default, Scalene runs with profiling on, so to delay profiling until desired, use the--offcommand-line option (python3 -m scalene --off yourprogram.py).
How do I run Scalene in PyCharm?
A: In PyCharm, you can run Scalene at the command line by opening the terminal at the bottom of the IDE and running a Scalene command (e.g., python -m scalene <your program>). Use the options --cli, --html, and --outfile <your output.html> to generate an HTML file that you can then view in the IDE.
How do I use Scalene with Django?
A: Pass in the --noreload option (see https://github.com/plasma-umass/scalene/issues/178).
How do I use Scalene with PyTorch on the Mac?
A: Scalene works with PyTorch version 1.5.1 on Mac OS X. There's a bug in newer versions of PyTorch (https://github.com/pytorch/pytorch/issues/57185) that interferes with Scalene (discussion here: https://github.com/plasma-umass/scalene/issues/110), but only on Macs.
Technical Information
For details about how Scalene works, please see the following paper, which won the Jay Lepreau Best Paper Award at OSDI 2023: Triangulating Python Performance Issues with Scalene. (Note that this paper does not include information about the AI-driven proposed optimizations.)
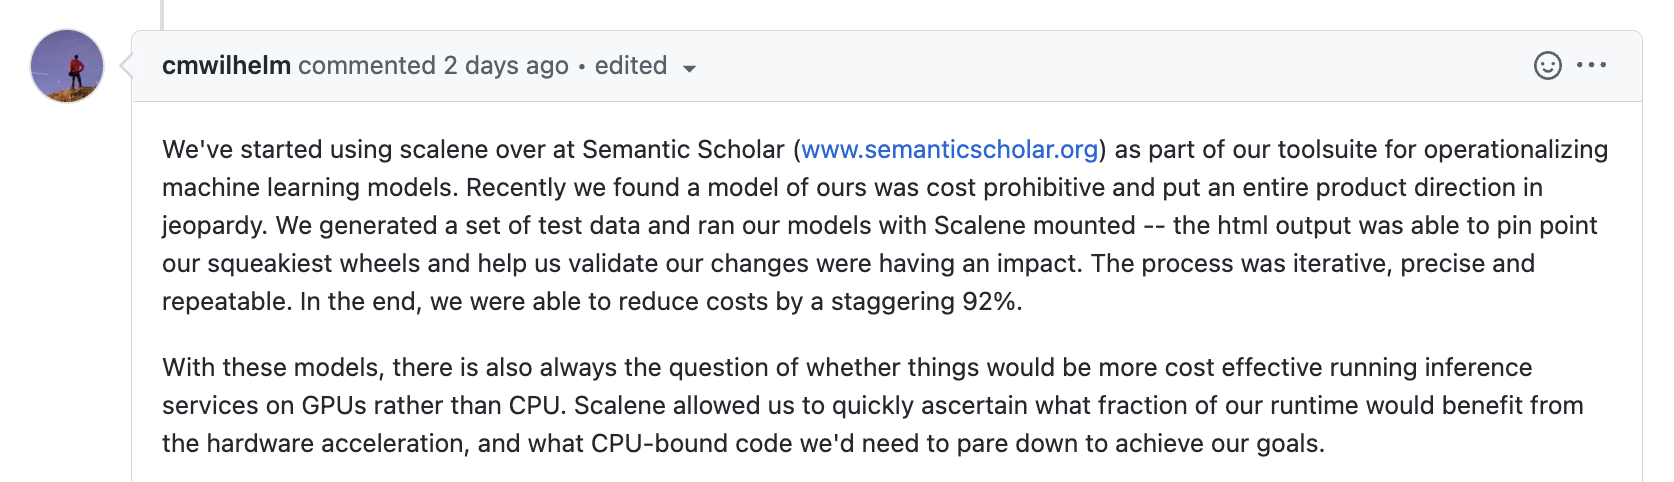
Success Stories
If you use Scalene to successfully debug a performance problem, please add a comment to this issue!
Acknowledgements
Logo created by Sophia Berger.
This material is based upon work supported by the National Science Foundation under Grant No. 1955610. Any opinions, findings, and conclusions or recommendations expressed in this material are those of the author(s) and do not necessarily reflect the views of the National Science Foundation.
Release history Release notifications | RSS feed


Download files
Download the file for your platform. If you're not sure which to choose, learn more about installing packages.
Source Distributions
Built Distributions
Filter files by name, interpreter, ABI, and platform.
If you're not sure about the file name format, learn more about wheel file names.
Copy a direct link to the current filters
File details
Details for the file scalene-1.5.25-cp311-cp311-manylinux_2_24_x86_64.whl.
File metadata
- Download URL: scalene-1.5.25-cp311-cp311-manylinux_2_24_x86_64.whl
- Upload date:
- Size: 781.2 kB
- Tags: CPython 3.11, manylinux: glibc 2.24+ x86-64
- Uploaded using Trusted Publishing? No
- Uploaded via: twine/4.0.2 CPython/3.11.1
File hashes
| Algorithm | Hash digest | |
|---|---|---|
| SHA256 |
23731adfd276cdc61ae8148645f32cd6eabeba73baa22a1214030bdafa576829
|
|
| MD5 |
dd8a52f619e7592ee84c72c8218e4575
|
|
| BLAKE2b-256 |
a41b3016c384677ffc34bfe8b5ad462cff219c0e28d8038f6e7c6de96566d3df
|
File details
Details for the file scalene-1.5.25-cp310-cp310-win_amd64.whl.
File metadata
- Download URL: scalene-1.5.25-cp310-cp310-win_amd64.whl
- Upload date:
- Size: 369.0 kB
- Tags: CPython 3.10, Windows x86-64
- Uploaded using Trusted Publishing? No
- Uploaded via: twine/4.0.2 CPython/3.10.11
File hashes
| Algorithm | Hash digest | |
|---|---|---|
| SHA256 |
ecfee4980f4656f8b85d003974bfa5985613b1aca477c2c2e62747f654dfa9bd
|
|
| MD5 |
7be0c14b5cfc737f343fea2a37d5cbc1
|
|
| BLAKE2b-256 |
e25e535d577a965089111d33adcccc5e87e42ce858dd3ba48a4e4d442c8cdef7
|
File details
Details for the file scalene-1.5.25-cp310-cp310-manylinux_2_24_x86_64.whl.
File metadata
- Download URL: scalene-1.5.25-cp310-cp310-manylinux_2_24_x86_64.whl
- Upload date:
- Size: 774.2 kB
- Tags: CPython 3.10, manylinux: glibc 2.24+ x86-64
- Uploaded using Trusted Publishing? No
- Uploaded via: twine/4.0.2 CPython/3.10.9
File hashes
| Algorithm | Hash digest | |
|---|---|---|
| SHA256 |
891813c25ab425004caf7a54db888792c10e67cd482290586738380068986759
|
|
| MD5 |
1e5e1779fe7c8f034c02a01a678afb00
|
|
| BLAKE2b-256 |
de545bcef70c9231984b04c630d5fe2b66ef4042d1f6d401da4928300c41814b
|
File details
Details for the file scalene-1.5.25-cp310-cp310-macosx_12_0_universal2.whl.
File metadata
- Download URL: scalene-1.5.25-cp310-cp310-macosx_12_0_universal2.whl
- Upload date:
- Size: 537.5 kB
- Tags: CPython 3.10, macOS 12.0+ universal2 (ARM64, x86-64)
- Uploaded using Trusted Publishing? No
- Uploaded via: twine/4.0.2 CPython/3.10.12
File hashes
| Algorithm | Hash digest | |
|---|---|---|
| SHA256 |
2be7e9205a84c97b19c92927e4d0f29fad94b81acda398eacb21f0ea100391a3
|
|
| MD5 |
36bdb84294ec17d73686e41f41f766c3
|
|
| BLAKE2b-256 |
7adbcc27a3524ffe12938d637c80e635ddc47f160aebbe3d7845fdbfa992d1e0
|
File details
Details for the file scalene-1.5.25-cp39-cp39-win_amd64.whl.
File metadata
- Download URL: scalene-1.5.25-cp39-cp39-win_amd64.whl
- Upload date:
- Size: 369.0 kB
- Tags: CPython 3.9, Windows x86-64
- Uploaded using Trusted Publishing? No
- Uploaded via: twine/4.0.2 CPython/3.9.13
File hashes
| Algorithm | Hash digest | |
|---|---|---|
| SHA256 |
25815b2c46217caad3478c6dd60da4eeeeef2091e583e620aeb1ec52bfa46096
|
|
| MD5 |
c23cc9a2f07496e21f0131c75dbaa25c
|
|
| BLAKE2b-256 |
d30ee54179e6169f6338d56aa541b2561a76b511710c6fbea39df8e2d94f0172
|
File details
Details for the file scalene-1.5.25-cp39-cp39-manylinux_2_24_x86_64.whl.
File metadata
- Download URL: scalene-1.5.25-cp39-cp39-manylinux_2_24_x86_64.whl
- Upload date:
- Size: 773.4 kB
- Tags: CPython 3.9, manylinux: glibc 2.24+ x86-64
- Uploaded using Trusted Publishing? No
- Uploaded via: twine/4.0.2 CPython/3.9.16
File hashes
| Algorithm | Hash digest | |
|---|---|---|
| SHA256 |
32350940823e4111764139632260a8649eb62df7fd74f680b5dfff319e720bad
|
|
| MD5 |
089c187c40c372ac7939d6e0db2901f1
|
|
| BLAKE2b-256 |
380e17ced8afdd8b5df83b3737fda61e1173aaffd7590d6ab2b2dd976de2aa4e
|
File details
Details for the file scalene-1.5.25-cp39-cp39-macosx_12_0_universal2.whl.
File metadata
- Download URL: scalene-1.5.25-cp39-cp39-macosx_12_0_universal2.whl
- Upload date:
- Size: 537.5 kB
- Tags: CPython 3.9, macOS 12.0+ universal2 (ARM64, x86-64)
- Uploaded using Trusted Publishing? No
- Uploaded via: twine/4.0.2 CPython/3.9.17
File hashes
| Algorithm | Hash digest | |
|---|---|---|
| SHA256 |
023867c67d98de4eecc36ee9089d6e3815cd0c64234c7f847e80cf5e0d427c69
|
|
| MD5 |
b2be00a6c90fd9bbb7ae9c4faed40263
|
|
| BLAKE2b-256 |
c59301b052e8346cee5724a4101f47cf0d8d134de994ef30560c8f8591108684
|
File details
Details for the file scalene-1.5.25-cp38-cp38-win_amd64.whl.
File metadata
- Download URL: scalene-1.5.25-cp38-cp38-win_amd64.whl
- Upload date:
- Size: 369.0 kB
- Tags: CPython 3.8, Windows x86-64
- Uploaded using Trusted Publishing? No
- Uploaded via: twine/4.0.2 CPython/3.8.10
File hashes
| Algorithm | Hash digest | |
|---|---|---|
| SHA256 |
bf3d530903f81609c5b295f714d6b25f7d6faca0ea1a555f4bbb14e822b195f8
|
|
| MD5 |
116454bcd1a32b4dcfcd6ec84b69435e
|
|
| BLAKE2b-256 |
957f74d5753064227d8d12103544b9c1bdf048f47330a64f823a1158fcf275f6
|
File details
Details for the file scalene-1.5.25-cp38-cp38-manylinux_2_24_x86_64.whl.
File metadata
- Download URL: scalene-1.5.25-cp38-cp38-manylinux_2_24_x86_64.whl
- Upload date:
- Size: 777.4 kB
- Tags: CPython 3.8, manylinux: glibc 2.24+ x86-64
- Uploaded using Trusted Publishing? No
- Uploaded via: twine/4.0.2 CPython/3.8.16
File hashes
| Algorithm | Hash digest | |
|---|---|---|
| SHA256 |
8a4f26ad19736d7e2e8836bc36df2757ffc53cdb5436bad77baa872d5ca4908a
|
|
| MD5 |
f541c89e8517b2311df1a3c662b74435
|
|
| BLAKE2b-256 |
ac8326cc72a6da197d6887ffa83114386b89e7207b0a2100cb42c5d7e6049b82
|
File details
Details for the file scalene-1.5.25-cp38-cp38-macosx_12_0_universal2.whl.
File metadata
- Download URL: scalene-1.5.25-cp38-cp38-macosx_12_0_universal2.whl
- Upload date:
- Size: 537.6 kB
- Tags: CPython 3.8, macOS 12.0+ universal2 (ARM64, x86-64)
- Uploaded using Trusted Publishing? No
- Uploaded via: twine/4.0.2 CPython/3.8.17
File hashes
| Algorithm | Hash digest | |
|---|---|---|
| SHA256 |
9c95fe28e170ee96795753350e6ba2bdafce289c1631f0097cc23f7347702801
|
|
| MD5 |
729f5335680fde560afe8e3bb3c0515e
|
|
| BLAKE2b-256 |
58e979a8dcc496472d212e18ae4d4a3d58bab8f6b5914c8ac7213ab1369ac774
|


