

Command-line system obervation tool.
sot is a Command-line System Obervation Tool in the spirit of top. It displays various interesting system stats and graphs them. Works on all operating systems.






Installation

Quick Install (Recommended)
One-line installer for macOS and Linux - Automatically detects your environment and installs all dependencies:
curl -fsSL https://raw.githubusercontent.com/anistark/sot/main/install.sh | bash
This script will:
- ✅ Detect your operating system
- ✅ Check for Python 3.10+ (installs if missing)
- ✅ Install pipx (if not present)
- ✅ Install sot and configure PATH
- ✅ Verify the installation
Note: This installation script does not work on Windows. Windows users should use one of the alternative installation methods below.
Alternative Installation Methods
Using brew
brew tap anistark/tools
brew install sot
Or single line:
brew install anistark/tools/sot
Update using:
brew update && brew upgrade sot
Using pipx
Install and run with pipx. Setup pipx before proceeding.
python3 -m pipx install sot
python3 -m pipx ensurepath
sudo pipx ensurepath --global
or in single line:
python3 -m pipx install sot && python3 -m pipx ensurepath && sudo pipx ensurepath --global
Using DEB Package (Experimental - Debian/Ubuntu)
### Using DEB Package (Experimental - Debian/Ubuntu)⚠️ Experimental: DEB packages are experimental. Use uv or pipx for recommended installation.
Download the latest DEB package from the releases page and install:
# Download latest .deb file from releases
wget https://github.com/anistark/sot/releases/latest/download/sot-*.deb

# Install the package
sudo dpkg -i sot-*.deb

# Install any missing dependencies (if needed)
sudo apt-get install -f
Using RPM Package (Experimental - RHEL/CentOS/Fedora)
⚠️ Experimental: RPM packages are experimental. Use uv or pipx for recommended installation.
Download the latest RPM package from the releases page and install:
# Download latest .rpm file from releases
wget https://github.com/anistark/sot/releases/latest/download/sot-*.rpm

# Install the package
sudo rpm -ivh sot-*.rpm
Verifying Releases
PyPI releases are published from GitHub Actions with Trusted Publishing and carry PEP 740 attestations linking each file to this repository. To verify a release file:
uvx pypi-attestations verify pypi --repository https://github.com/anistark/sot pypi:sot-<version>-py3-none-any.whl
Install from source
For testing or installing the latest version from source directly on your system.
Using uv (Recommended):
# Clone the repository
git clone https://github.com/anistark/sot.git
cd sot

# Install from source (system-wide)
uv pip install --system .

# Run from anywhere
sot
Using pipx:
# Clone the repository
git clone https://github.com/anistark/sot.git
cd sot

# Install from source using pipx
pipx install .

# Run from anywhere
sot
Run with:
sot
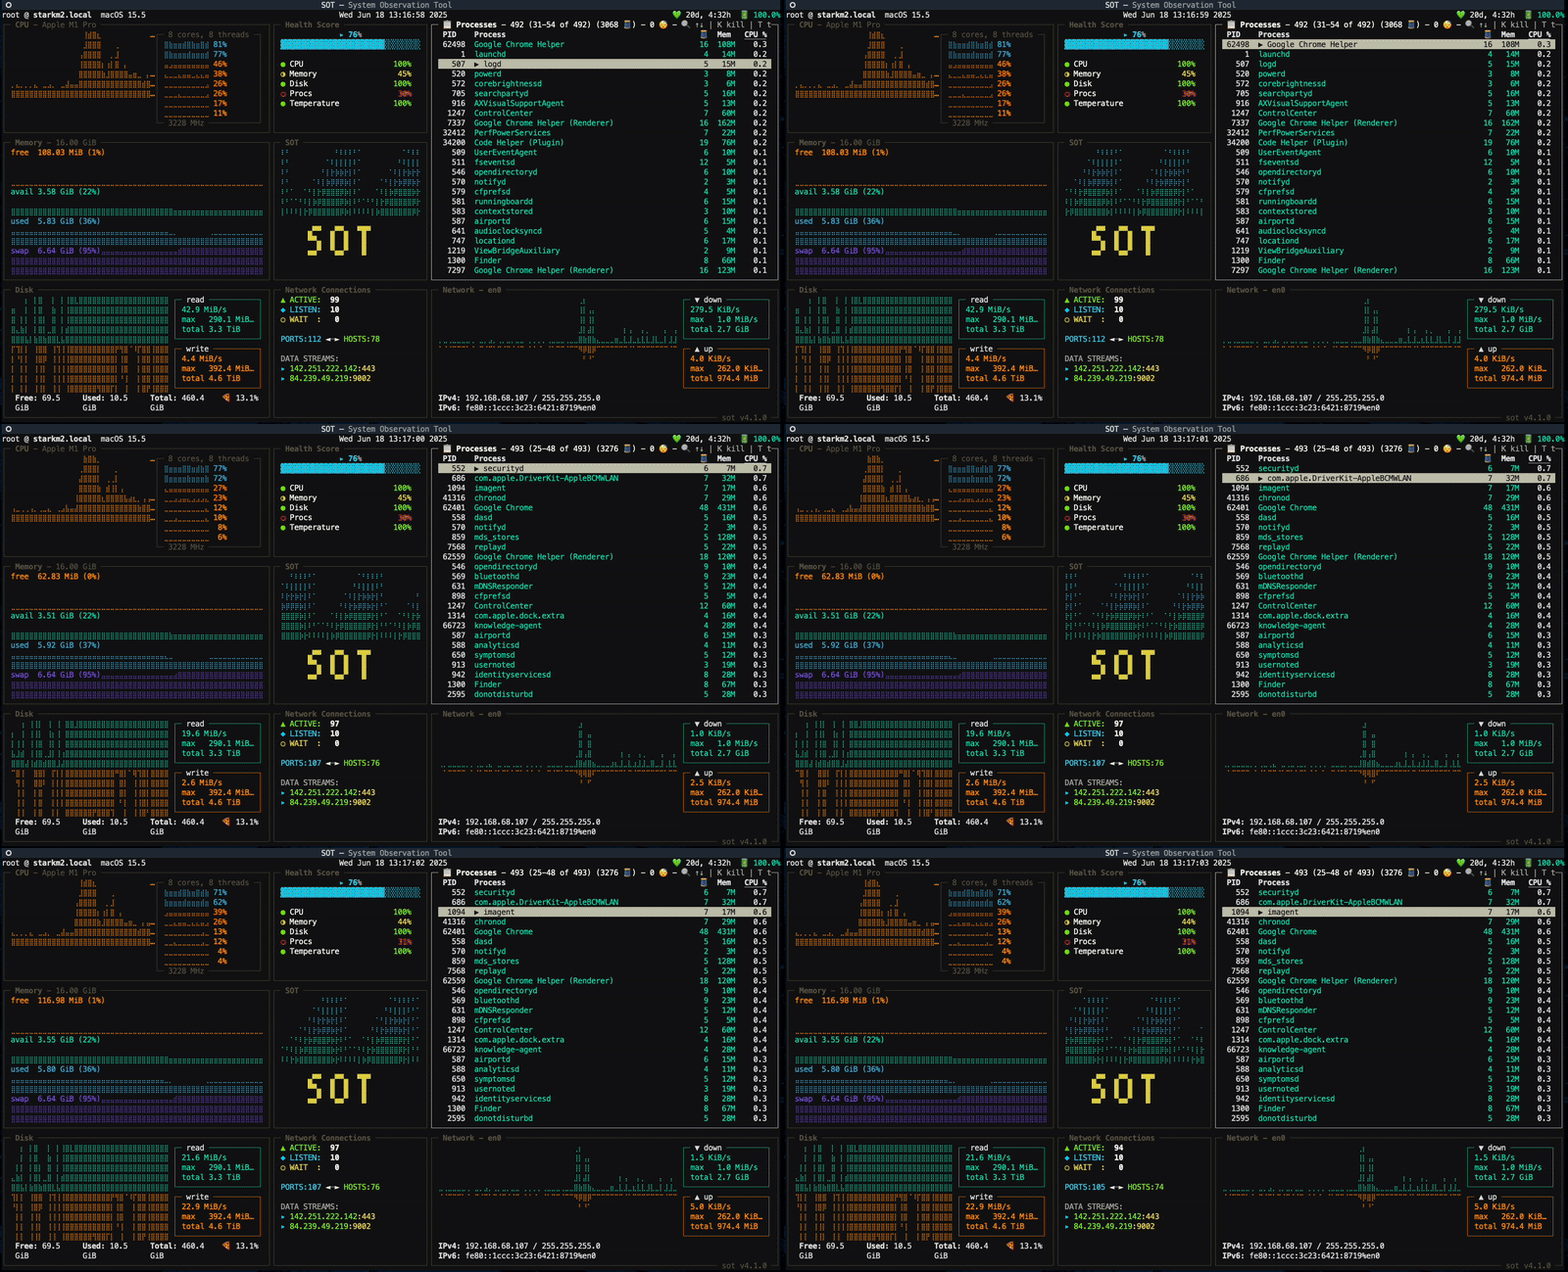
Features
System
- CPU Usage
- Per Core and Thread level
- Processes with ID, threads, memory and cpu usage
- Interactive Order By: Press
Oto enter order by mode, navigate columns with arrow keys, toggle sort direction with Enter (DESC ↓ → ASC ↑ → OFF → cycle)
- Interactive Order By: Press
Disk
- Interactive Disk TUI - View all physical disks with partitions
- Real-time disk usage monitoring with accurate APFS container calculations
- Visual usage bars and percentage indicators
- I/O statistics (read/write counts and bytes)
- Plain Listing -
sot disk --listprints every disk and partition as a static table (likedu, but with usage bars) - Disk Usage
- Per Read/Write
- Capacity
- Free
- Used
- Total
- Percent
Memory
- Memory Usage
- Capacity
- Free
- Available
- Used
- Swap
GPU
- Live GPU Widget - Real-time GPU stats in the main dashboard (shown automatically when a GPU is detected)
- Utilization history graph with current percentage
- Memory usage (used/total, or in-use/allocated on unified-memory systems)
- Temperature and power draw, when exposed by the platform
- Cross-platform detection
- Apple Silicon (via
ioreg, no sudo): utilization, memory, renderer/tiler breakdown, core count - NVIDIA (via
nvidia-smi): utilization, memory, temperature, power - AMD (via
rocm-smi): best-effort
- Apple Silicon (via
Network
- Local IP
- Upload/Download Speed
- Bandwidth
- Network Usage
- Select Interface: Use
--net/-Nto monitor a specific network interface
Options
- Disk Selection: Use
--disk/-Dto monitor a specific volumesot --disk- Interactive picker with arrow keyssot --disk /Volumes/External- Monitor specific volume
- Theme: Use
--theme/-Tto pick a color theme (classicorcyberpunk)sot --theme cyberpunk- Cyberpunk 2077 inspired neon theme- Set
SOT_THEME=cyberpunkto make it the default; also applies tosot psandsot disk
System Information
The sot info command displays comprehensive system information with a beautiful OS-specific ASCII logo.
Usage
sot info
Example Output
                  ,MMMM.            Host        -  john@macbook.local
                .MMMMMM             Model       -  MacBook Pro
                MMMMM,              SKU         -  MK1E3LL/A
      .;MMMMM:' MMMMMMMMMM;.        Identifier  -  MacBookPro18,1
    MMMMMMMMMMMMNWMMMMMMMMMMM:      Serial      -  C02YX2QZMD6R
  .MMMMMMMMMMMMMMMMMMMMMMMMWM.
  MMMMMMMMMMMMMMMMMMMMMMMMM.        OS          -  macOS 14.5.0 Sonoma
 ;MMMMMMMMMMMMMMMMMMMMMMMM:         Kernel      -  23.5.0
 :MMMMMMMMMMMMMMMMMMMMMMMM:         Firmware    -  10151.121.3
 .MMMMMMMMMMMMMMMMMMMMMMMMM.        DE          -  Aqua
  MMMMMMMMMMMMMMMMMMMMMMMMMMM.      WM          -  Quartz Compositor
   .MMMMMMMMMMMMMMMMMMMMMMMMMM.     Shell       -  zsh
     MMMMMMMMMMMMMMMMMMMMMMMM       Terminal    -  iTerm.app (3.5.2)
      ;MMMMMMMMMMMMMMMMMMMM.
        .MMMM,.    .MMMM,.          Chip        -  Apple M1 Pro (8P + 2E cores)
                                    GPU         -  Apple M1 Pro (16 cores)
                                    Memory      -  8 GiB / 32 GiB

                                    Displays    -  2560 x 1600 Retina (Color LCD)
                                                   3840 x 2160@60.00Hz (Dell U2720Q)

                                    Uptime      -  12d 4h 23m
                                    Battery     -  87% & Discharging
Features
The info command displays detailed system information organized into logical sections:
System Information
- Host (user@hostname)
- Model name (e.g., MacBook Pro)
- SKU/Model number
- Model identifier
- Serial number
Software
- Operating system with version name (e.g., macOS 15.6.1 Sequoia)
- Kernel version
- Firmware version
- Desktop Environment (DE)
- Window Manager (WM)
- Shell
- Terminal emulator
Hardware
- Chip details with performance/efficiency core breakdown (e.g., Apple M1 Pro with 6P + 2E cores)
- GPU model with core count
- Memory (used / total)
Displays
- All connected displays with resolutions, refresh rates, and display names
- Screen brightness (when available)
Status
- System uptime
- Battery status (percentage and charging state)
OS-Specific Logos
The command automatically detects your operating system and distribution, displaying the appropriate ASCII logo:
macOS: Apple logo
Linux Distributions:
- Ubuntu
- Debian
- Fedora
- Red Hat / RHEL
- Arch Linux
- Manjaro
- Pop!_OS
- CentOS
- Generic Linux/Tux (fallback)
Windows: Windows logo
Disk Viewer
The sot disk command shows every physical disk with its partitions.
Usage
# Interactive TUI - browse disks with arrow keys, live refresh
sot disk

# Plain listing - print once and exit, pipe-friendly
sot disk --list
sot disk -l
--list prints one row per disk, with its partitions nested underneath: device, mountpoint, filesystem, size, used, free, and a colour-coded usage bar (green → yellow above 80% → red above 95%), followed by a total across all disks. On narrow terminals the filesystem column is dropped and the bar shrinks so mountpoints stay readable.
System Cleanup
The sot clean command performs a deep clean of your system by removing caches, logs, and temporary files.
Usage
# Interactive mode - shows what can be cleaned and asks for confirmation
sot clean

# Dry run - preview what would be cleaned without deleting
sot clean --dry-run
What Gets Cleaned
The clean command intelligently detects your operating system and cleans platform-specific locations:
macOS:
- Application caches (
~/Library/Caches) - Application logs (
~/Library/Logs) - Homebrew package cache
- System temporary files (
/tmp) - Browser caches (Chrome, Safari, Firefox)
- Python pip cache
- npm cache
- Trash bin
- Coding agent caches (Claude Code, pi, opencode, Kilo Code)
Linux:
- User cache (
~/.cache) - Thumbnails cache
- System temporary files (
/tmp,/var/tmp) - Package manager caches (APT, DNF, Yum)
- Browser caches
- Python pip cache
- npm cache
- Coding agent caches (Claude Code, pi, opencode, Kilo Code)
Windows:
- User temporary files (
%TEMP%) - Windows temporary files
- Prefetch files
- Browser caches
- Python pip cache
- npm cache
- Coding agent caches (Claude Code, pi, opencode, Kilo Code)
Coding Agent Caches
Agents are only listed when they're actually installed, so the table stays limited to what's on your machine. Only caches, logs and scratch directories are touched. Conversation history, sessions, credentials and config are left alone.
| Agent | Cleaned |
|---|---|
| Claude Code | ~/.claude/{cache,paste-cache,debug,shell-snapshots,session-env,statsig}, ~/.cache/claude, ~/Library/Caches/claude-cli-nodejs |
| pi | ~/.pi/{cache,logs}, ~/.cache/pi |
| opencode | ~/.cache/opencode, ~/.local/share/opencode/{cache,log} |
| Kilo Code | ~/.kilocode/cache, plus kilocode.kilo-code/{cache,checkpoints} under the VS Code, Cursor and VSCodium global storage directories |
Notably left alone: ~/.claude/projects (session transcripts that claude --resume reads) and ~/.local/share/claude/versions (the installed binaries).
If you've relocated a cache directory, sot picks it up from the environment rather than assuming the default. Exported variables are read from the shell you run sot in:
| Variable | Overrides |
|---|---|
CLAUDE_CONFIG_DIR |
~/.claude |
XDG_CACHE_HOME |
~/.cache |
XDG_DATA_HOME |
~/.local/share |
XDG_CONFIG_HOME |
~/.config |
APPDATA / LOCALAPPDATA |
~/AppData/Roaming, ~/AppData/Local |
VSCODE_PORTABLE |
VS Code portable-mode user data (no default; paths are skipped when unset) |
Use sot clean --dry-run to confirm the resolved locations before deleting anything.
Permissions
Some cleaning targets require elevated privileges (sudo/administrator). The clean command will:
- Show which items require elevated privileges in the summary
- Skip these items during cleaning if not running with sudo
- Provide clear notifications about what was skipped
To clean items requiring sudo:
sudo sot clean
Safety Features
- Dry run mode: Preview what will be cleaned without making changes
- Interactive confirmation: Always asks before deleting files
- Clear reporting: Shows exactly what will be cleaned and how much space will be freed
- Graceful error handling: Skips files that can't be accessed rather than failing
Process Viewer
The sot ps command provides an interactive terminal-based process viewer with three synchronized panels for comprehensive system monitoring.
Usage
sot ps
Features
The process viewer displays three interactive panels:
Process List:
- All running processes with PID, name, memory usage, and CPU percentage
- Navigate with arrow keys (↑/↓)
- Sortable columns (same as main
sotinterface) - Real-time updates every 2 seconds
- Shows up to 500 processes
Listening Ports:
- All open ports listening for connections
- Shows port number, bind address, process name, and PID
- Useful for identifying which services are running on which ports
- Updates every 3 seconds
- Note: May require sudo on macOS for full port detection
Development Environment:
- Automatically detects running development servers
- Supports: Node.js, Python, Docker, Ruby, Go, Rust
- Shows process count, listening ports, CPU and memory usage per environment type
- Groups related processes (e.g., all Node processes together)
- Updates every 5 seconds
Navigation
- Tab: Switch focus between panels
- ↑/↓: Navigate within focused panel
- Q: Quit
Example
The process viewer is particularly useful for developers who want to:
- Monitor development server resource usage
- Identify which process is using a specific port
- Track multiple development environments running simultaneously
- Debug port conflicts quickly
Disk Benchmarking
The sot bench command allows you to measure disk performance with comprehensive benchmarks including sequential throughput, random IOPS, and latency distribution.
Interactive Mode (Default)
sot bench
This will display available disks and let you select one to benchmark interactively.
Benchmark Options
# Benchmark with default 10 second duration per test
sot bench

# Specify custom duration (in seconds)
sot bench --duration 5     # Quick 5-second benchmark
sot bench -d 30            # Longer 30-second benchmark for more stable results

# Specify custom output file
sot bench --output results.json

# Combine options
sot bench --duration 20 --output bench_results.json
Benchmark Tests
The benchmarking tool runs four comprehensive tests:
- Sequential Read - Measures sustained read throughput (MB/s)
- Sequential Write - Measures sustained write throughput (MB/s)
- Random Read IOPS - Measures random read operations per second
- Random Write IOPS - Measures random write operations per second
Each test runs for the specified duration (default: 10 seconds) and provides detailed metrics:
- Throughput/IOPS measurements
- Min/Avg/Max latencies
- p50, p95, p99 percentile latencies
- Total test duration
Duration Parameter
The --duration flag controls how long each test runs:
- Default: 10 seconds - Quick, reliable measurements for most use cases
- Shorter durations (5s) - Very quick benchmarks for rapid testing
- Longer durations (30s+) - More stable results, accounts for system variance better
For all options, see
sot -H
usage: sot [--help] [--version] [--log LOG] [--net NET] [--disk [DISK]]
           [--theme THEME] {info,bench,disk,clean,ps} ...

Command-line System Obervation Tool ≈

commands: {info,bench,disk,clean,ps}
    info                Display system information
    bench               Disk benchmarking
    disk                Interactive disk information viewer
    clean               Deep clean system caches, logs, and temp files
    ps                  Interactive process viewer with ports and dev environment

options:
  --help, -H                Show this help message and exit.
  --version, -V             Display version information with styling
  --log LOG, -L LOG         Debug log file path (enables debug logging)
  --net NET, -N NET         Network interface to display (default: auto-detect best interface)
  --disk [DISK], -D [DISK]  Disk mountpoint to display (use without value for interactive selection)
  --theme THEME, -T THEME   Color theme: classic, cyberpunk (default: $SOT_THEME or classic)
For benchmark-specific options:
sot bench -h
usage: sot bench [-h] [--output OUTPUT] [--duration DURATION]

options:
  -h, --help            show this help message and exit
  --output OUTPUT, -o OUTPUT
                        Output file for benchmark results (JSON format)
  --duration DURATION, -d DURATION
                        Duration for each benchmark test in seconds (default: 10s)
For clean-specific options:
sot clean -h
usage: sot clean [-h] [--dry-run]

options:
  -h, --help  show this help message and exit
  --dry-run   Show what would be cleaned without actually deleting
Main Theme:
| Color | Hex | RGB |
|---|---|---|
| sky_blue3 | #5fafd7 |
rgb(95,175,215) |
| aquamarine3 | #5fd7af |
rgb(95,215,175) |
| yellow | #808000 |
rgb(128,128,0) |
| bright_black | #808080 |
rgb(128,128,128) |
| slate_blue1 | #875fff |
rgb(135,95,255) |
| red3 | #d70000 |
rgb(215,0,0) |
| dark_orange | #d75f00 |
rgb(215,95,0) |
All supported colors.
🏴 ≈ 🏴
sot uses:
Tested Systems:


If you use a system that's not listed above, feel free to add to the list. If you're facing any issues, would be happy to take a look.
Other top alternatives in alphabetical order:
1 maintainer

Metadata
1 maintainer
Release files for sot 6.3.0
For a detailed explanation of source distributions (sdists) and built distributions (wheels), please see the package formats documentation.
Source distribution (sdist)
| File | Size | Uploaded | |
|---|---|---|---|
| sot-6.3.0.tar.gz | 244.9 kB | Details |
Built distribution (wheel)
| File | Interpreter | ABI | Platform | Reset |
|---|---|---|---|---|
| sot-6.3.0-py3-none-any.whl | Python 3 | none | any | Details |
Total release size: 337.5 kB
Release files / sot-6.3.0.tar.gz
| Download URL | sot-6.3.0.tar.gz |
|---|---|
| Size | 244.9 kB |
| Tags | Source |
|
SHA-256 checksum How to use checksums |
b55c428c9bd5d174aa831188f545ccd4ac8e0a8aebd6bdaac661364267a694b3
|
|
BLAKE2b-256 checksum How to use checksums |
efd23f228a0b0644b29ea30113012f6f8b0729e119e472cd97147aba615efa20
|
| Upload date | |
|
Uploaded using Trusted Publishing? What is trusted publishing? |
Yes |
| Uploaded via |
twine/7.0.0 CPython/3.13.14
|
Provenance
Provenance describes where a file came from. On PyPI, provenance is shared via attestations, which provide a verifiable record of the build or publishing details. View details, limitations and caveats.


PyPI Publish Attestation
PyPI verified that this artifact, at this checksum, originated from the publisher listed below.
Signed by GitHub Actions, verified by PyPI on Oct 7, 2026.
Transparency logRelease files / sot-6.3.0-py3-none-any.whl
| Download URL | sot-6.3.0-py3-none-any.whl |
|---|---|
| Size | 92.6 kB |
| Tags | Python 3 |
|
SHA-256 checksum How to use checksums |
4b2113cea1a9c6700a74ae03d7ba6e581a65dfc599e2cdaa335ceb6fc0ed59e0
|
|
BLAKE2b-256 checksum How to use checksums |
645682e51cdb10f15f22b6c3b58e6e08dd33046505b47d4846f69da209715c92
|
| Upload date | |
|
Uploaded using Trusted Publishing? What is trusted publishing? |
Yes |
| Uploaded via |
twine/7.0.0 CPython/3.13.14
|
Provenance
Provenance describes where a file came from. On PyPI, provenance is shared via attestations, which provide a verifiable record of the build or publishing details. View details, limitations and caveats.
PyPI Publish Attestation
PyPI verified that this artifact, at this checksum, originated from the publisher listed below.
Signed by GitHub Actions, verified by PyPI on Oct 7, 2026.
Transparency log













